

Results as text, a chart or a map
A result opens in the grid. The switch in the result bar shows the same rows three other ways: Text, as psql
prints a result; Chart, its number columns as bars, lines or points; and Map, when the result has a PostGIS
geometry or geography column. None of them runs the query again: pgjumbo’s engine reads the rows the result already
holds.
The switch shows in Query Tool tabs. A data tab, which shows a table’s rows, always uses the grid. Each query tab keeps its choice for its next runs.
Results as text
Section titled “Results as text”Click Text in the result bar, choose QueryResults as Text, or choose Results as Text in the toolbar’s More (…) menu. The menu items are ticked while the tab shows text, and choosing one again goes back to the grid. None of them has a key.
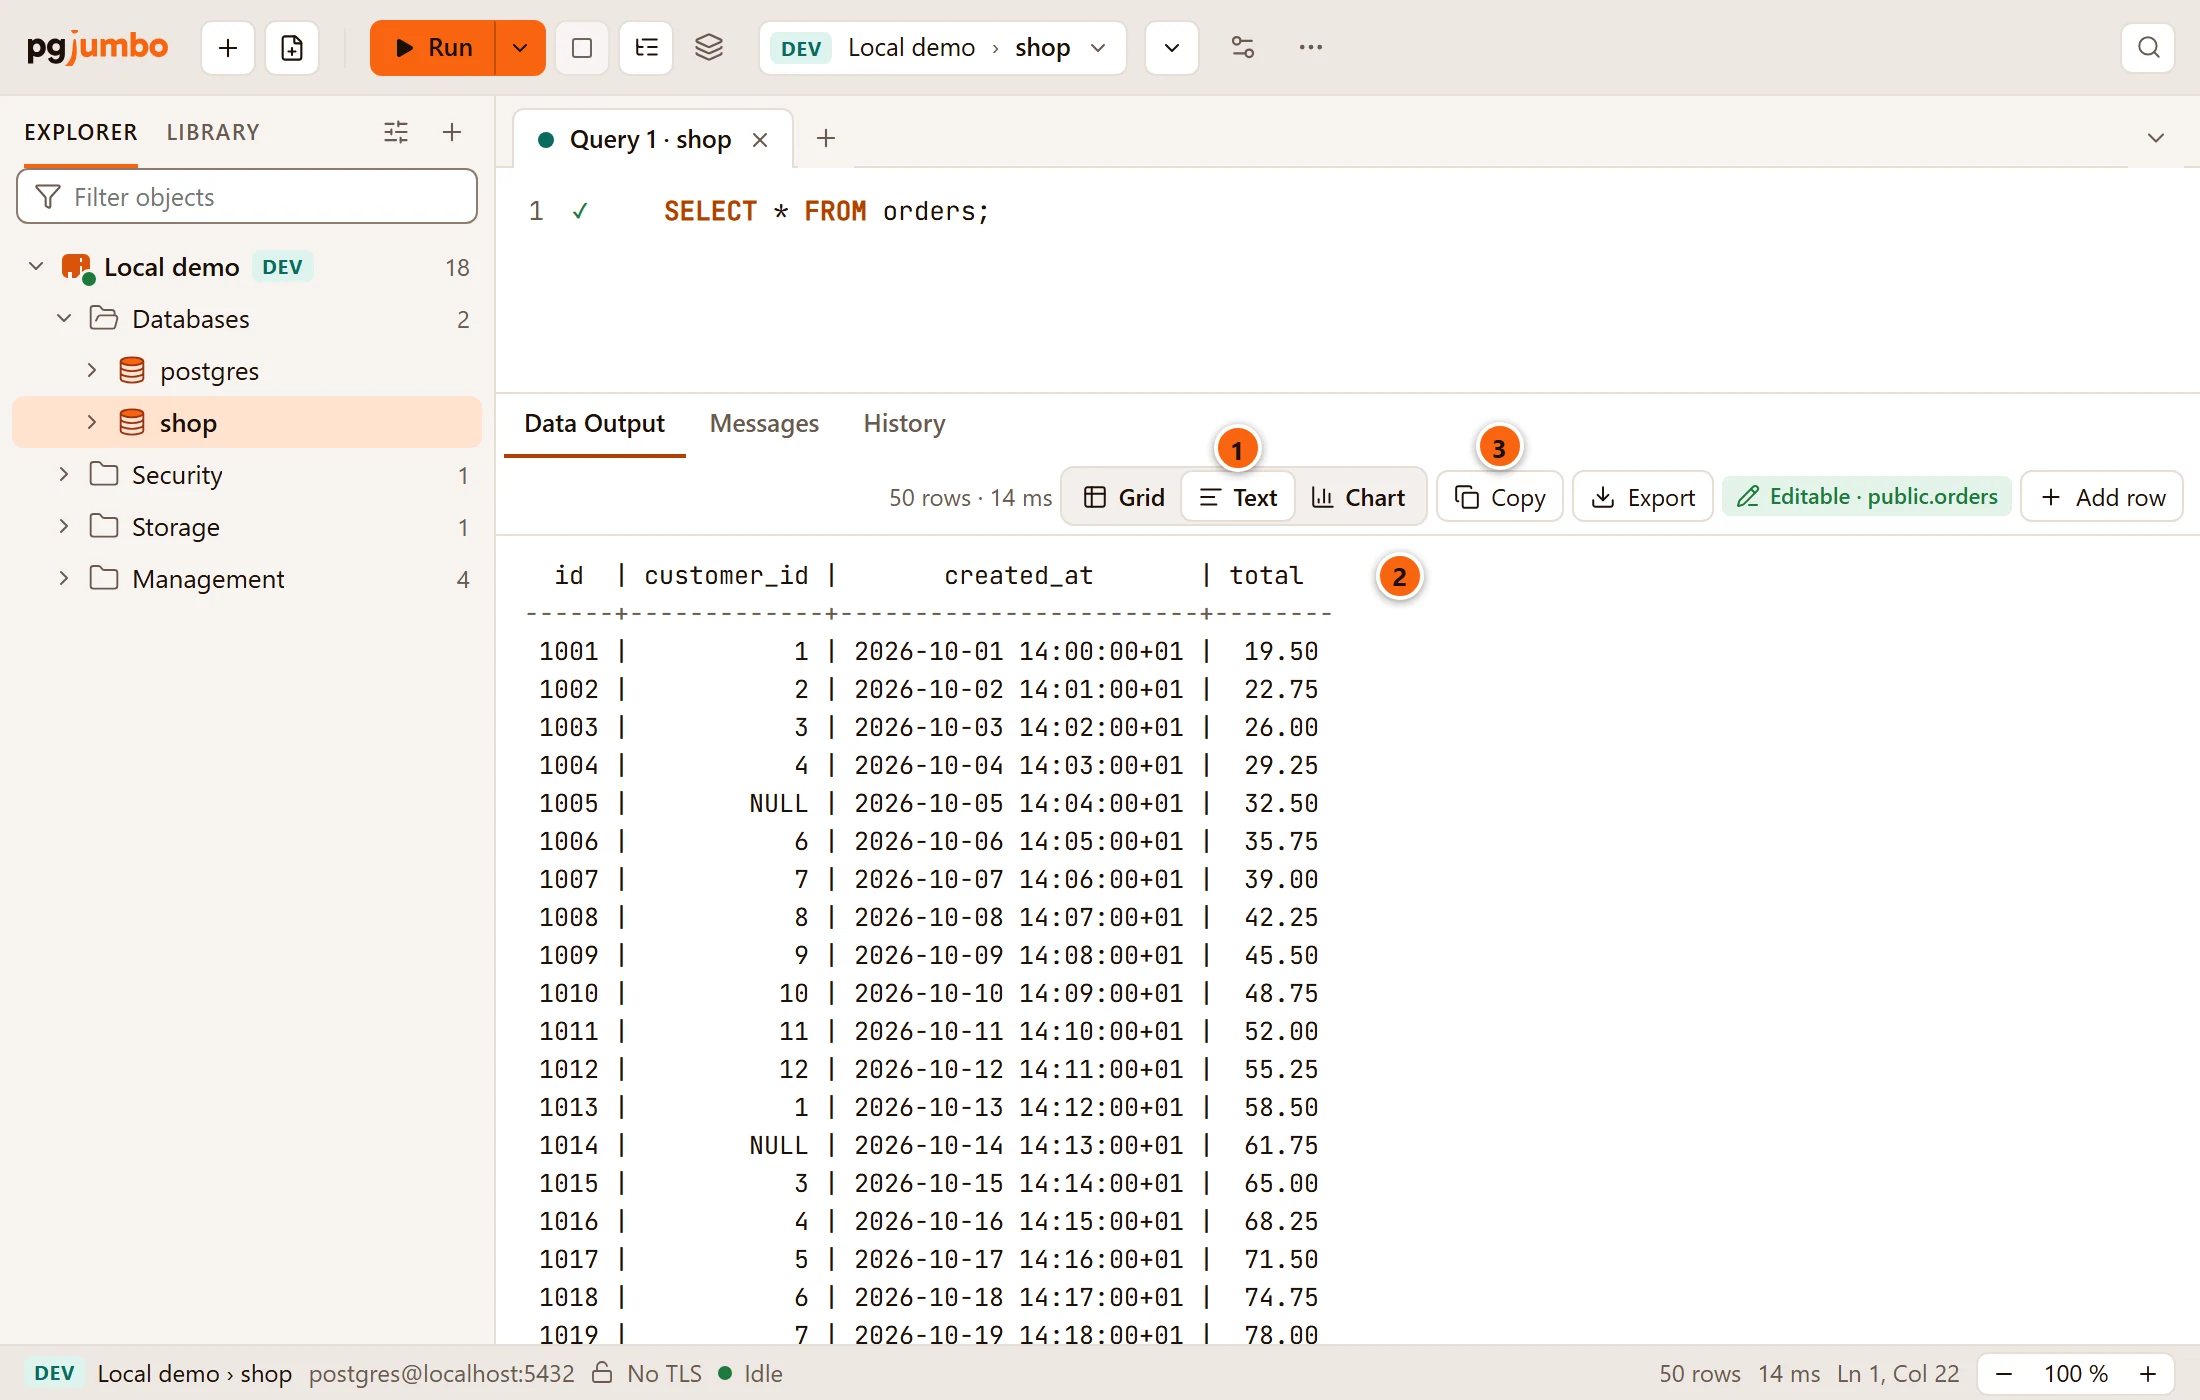
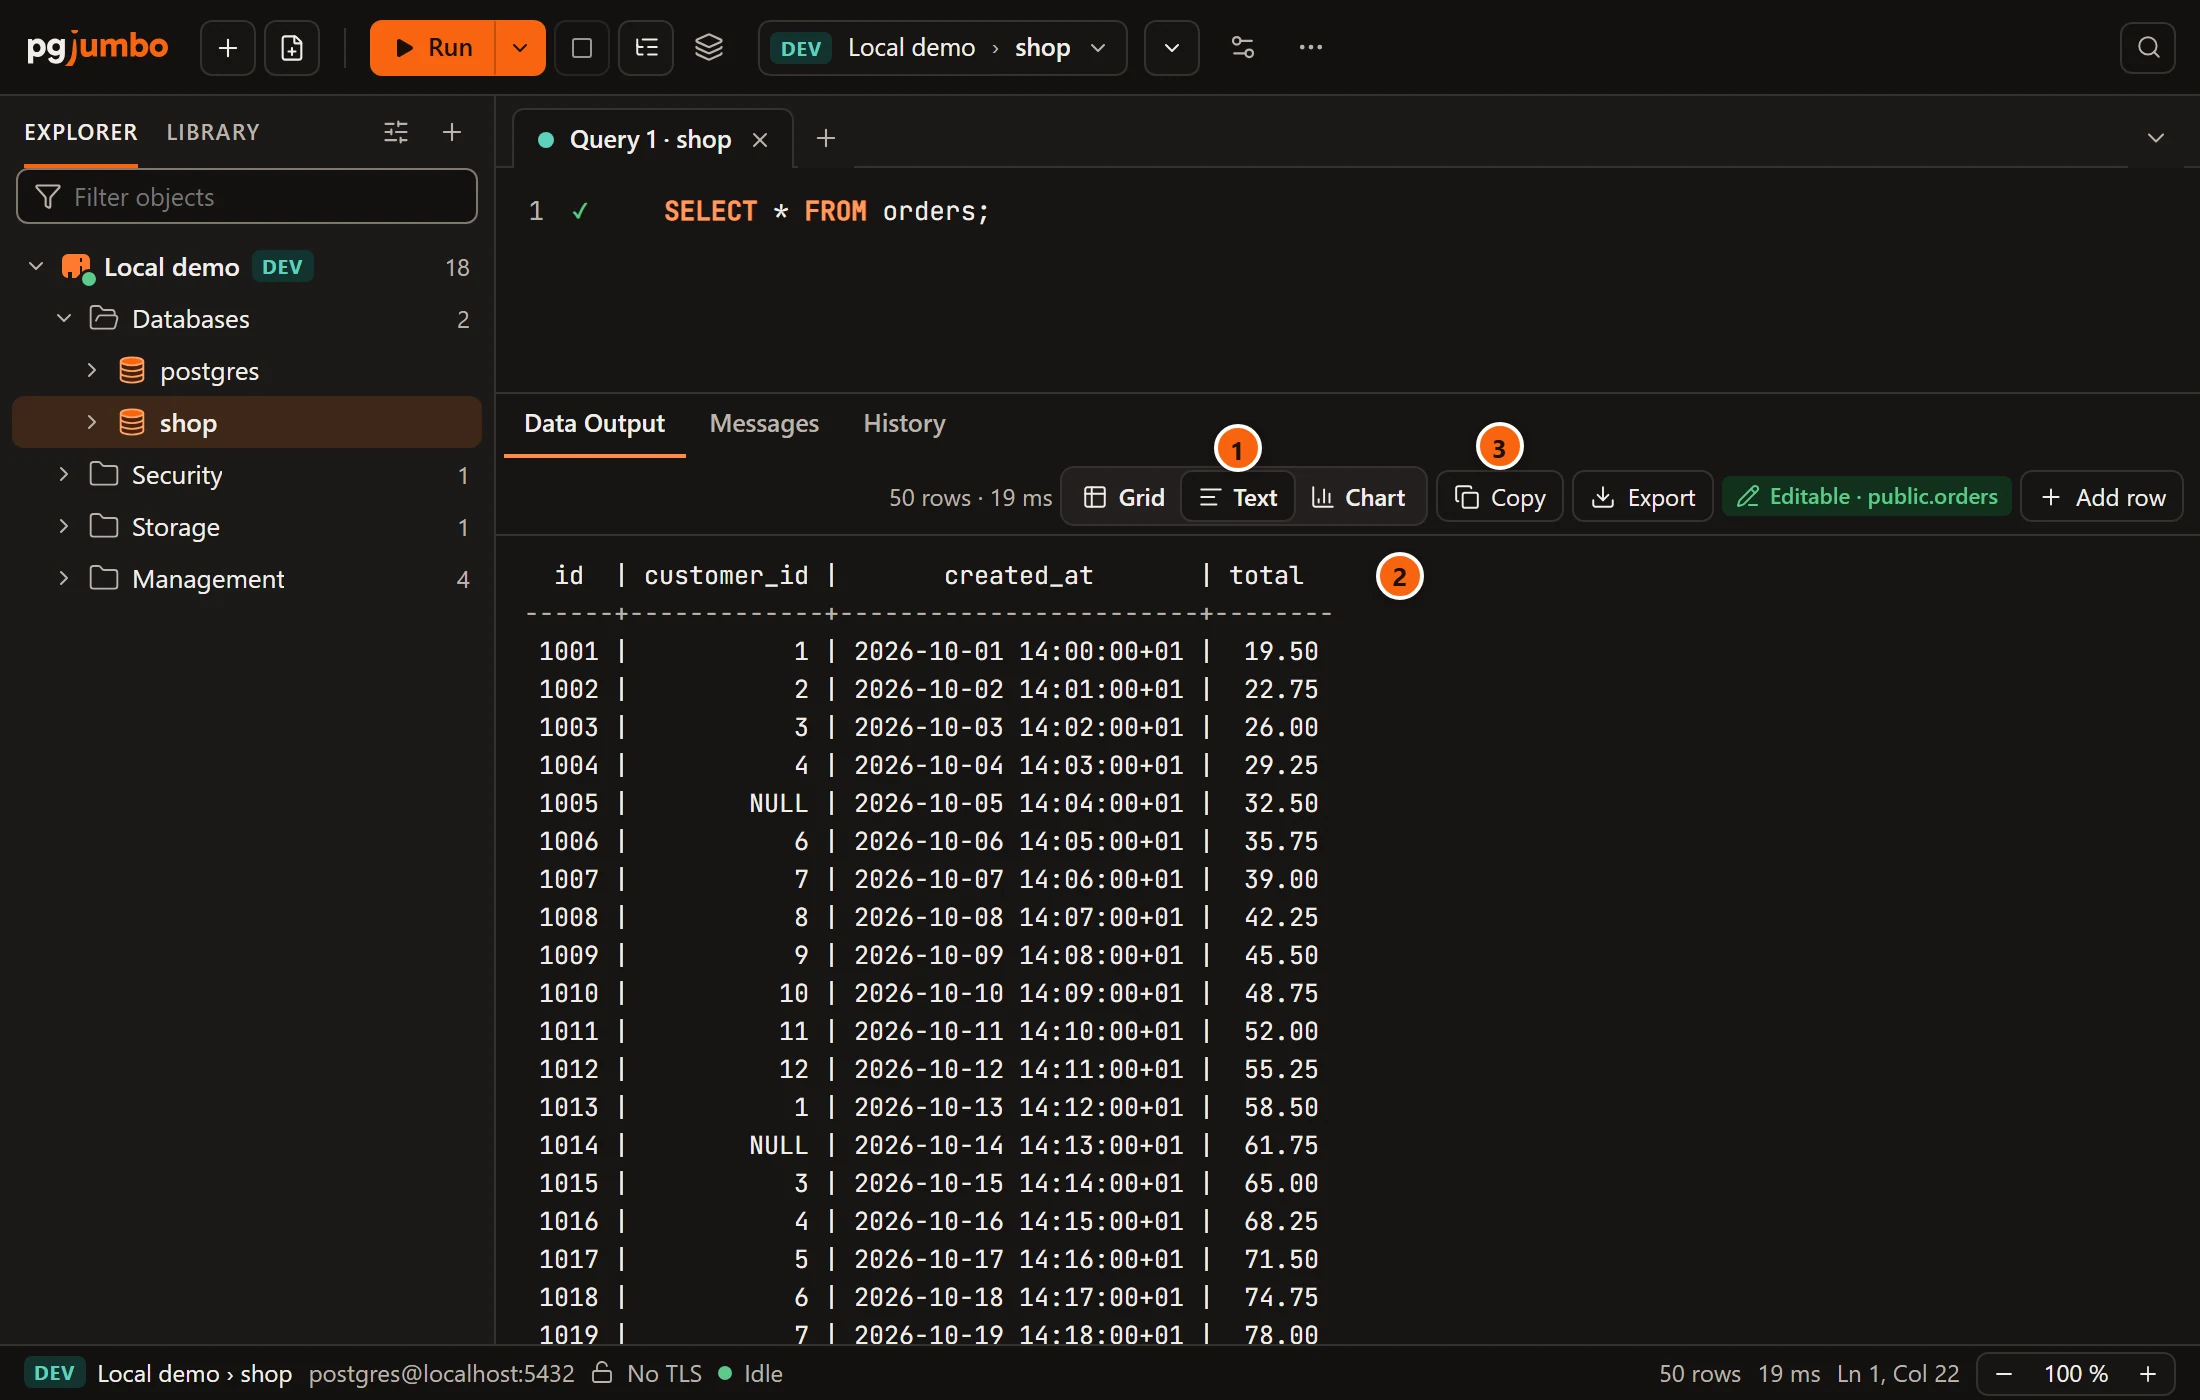
- 1 Text is selected in the result bar.
- 2 The result is laid out the way
psqlprints it: the column names centred over their values, a line under them, numbers on the right and everything else on the left. - 3 Copy copies the text as you see it, ready to paste into a ticket or a chat. Copy as is the grid’s and is not offered here.
How the text is written:
- A value with line breaks goes on over several lines, each marked with
+where the column ends, aspsqlmarks it. A tab in a value becomes four spaces. - Values are the server’s text. The grouping of numbers and the regional formats of
How values look do not apply, and a
NULLis always writtenNULL. - The rows follow the grid: sorted or filtered there, the text has the same rows in the same order. The filter field itself shows only over the grid, so switch to Grid to change it.
- Only the lines on screen are drawn, so long text scrolls as readily as short.
The last line counts the rows:
| Last line | When |
|---|---|
(50 rows) |
The text holds every row of the result. |
(the first 10000 of 50000 rows) |
The text holds at most the first 10,000 rows. |
(11 rows in the filtered view) |
The grid’s filter keeps only some of the rows. |
(8000 rows of the 250000 the server sent were kept) |
The result itself holds only part of what the server sent: see Large results. |
While a tab shows text, Results Stacked is greyed out, as text shows one result at a time (see Keep and compare results).
A result as a chart
Section titled “A result as a chart”Chart draws the result’s number columns, one mark for each row, so a trend or an outlier shows at a glance without leaving the Query Tool.
Open it in one of two ways:
- Click Chart in the result bar. It is greyed out until the result has all its rows.
- Right-click a result tab and choose ChartBars, Lines or Points.
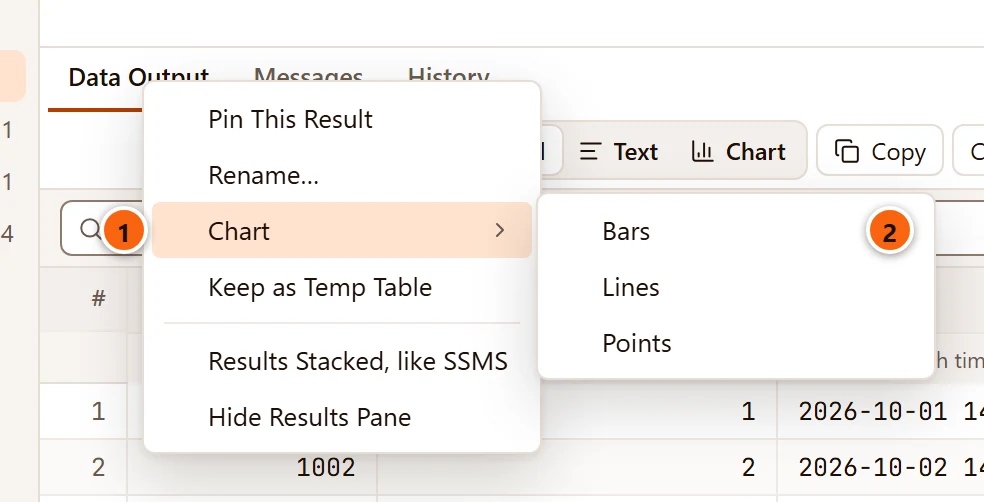
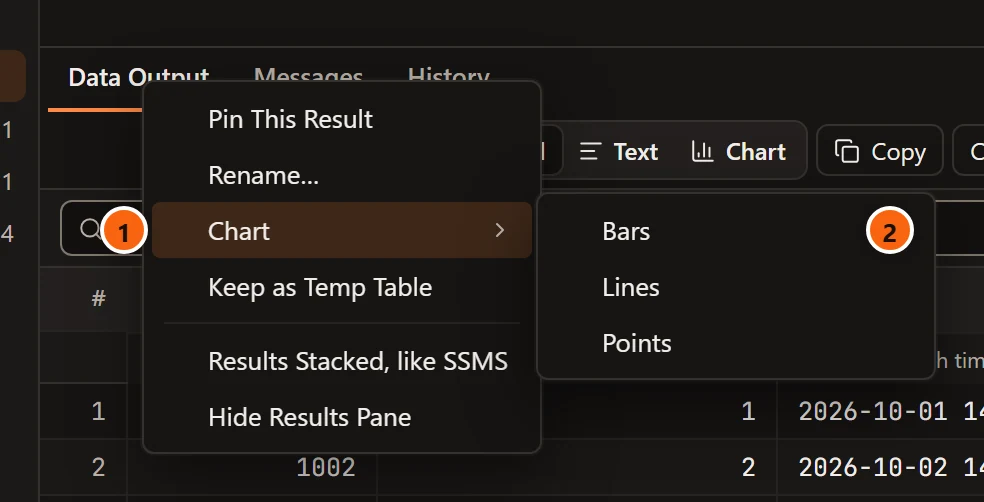
- 1 Chart in the result tab’s menu. The other items are on Keep and compare results.
- 2 The kind of chart to open with.
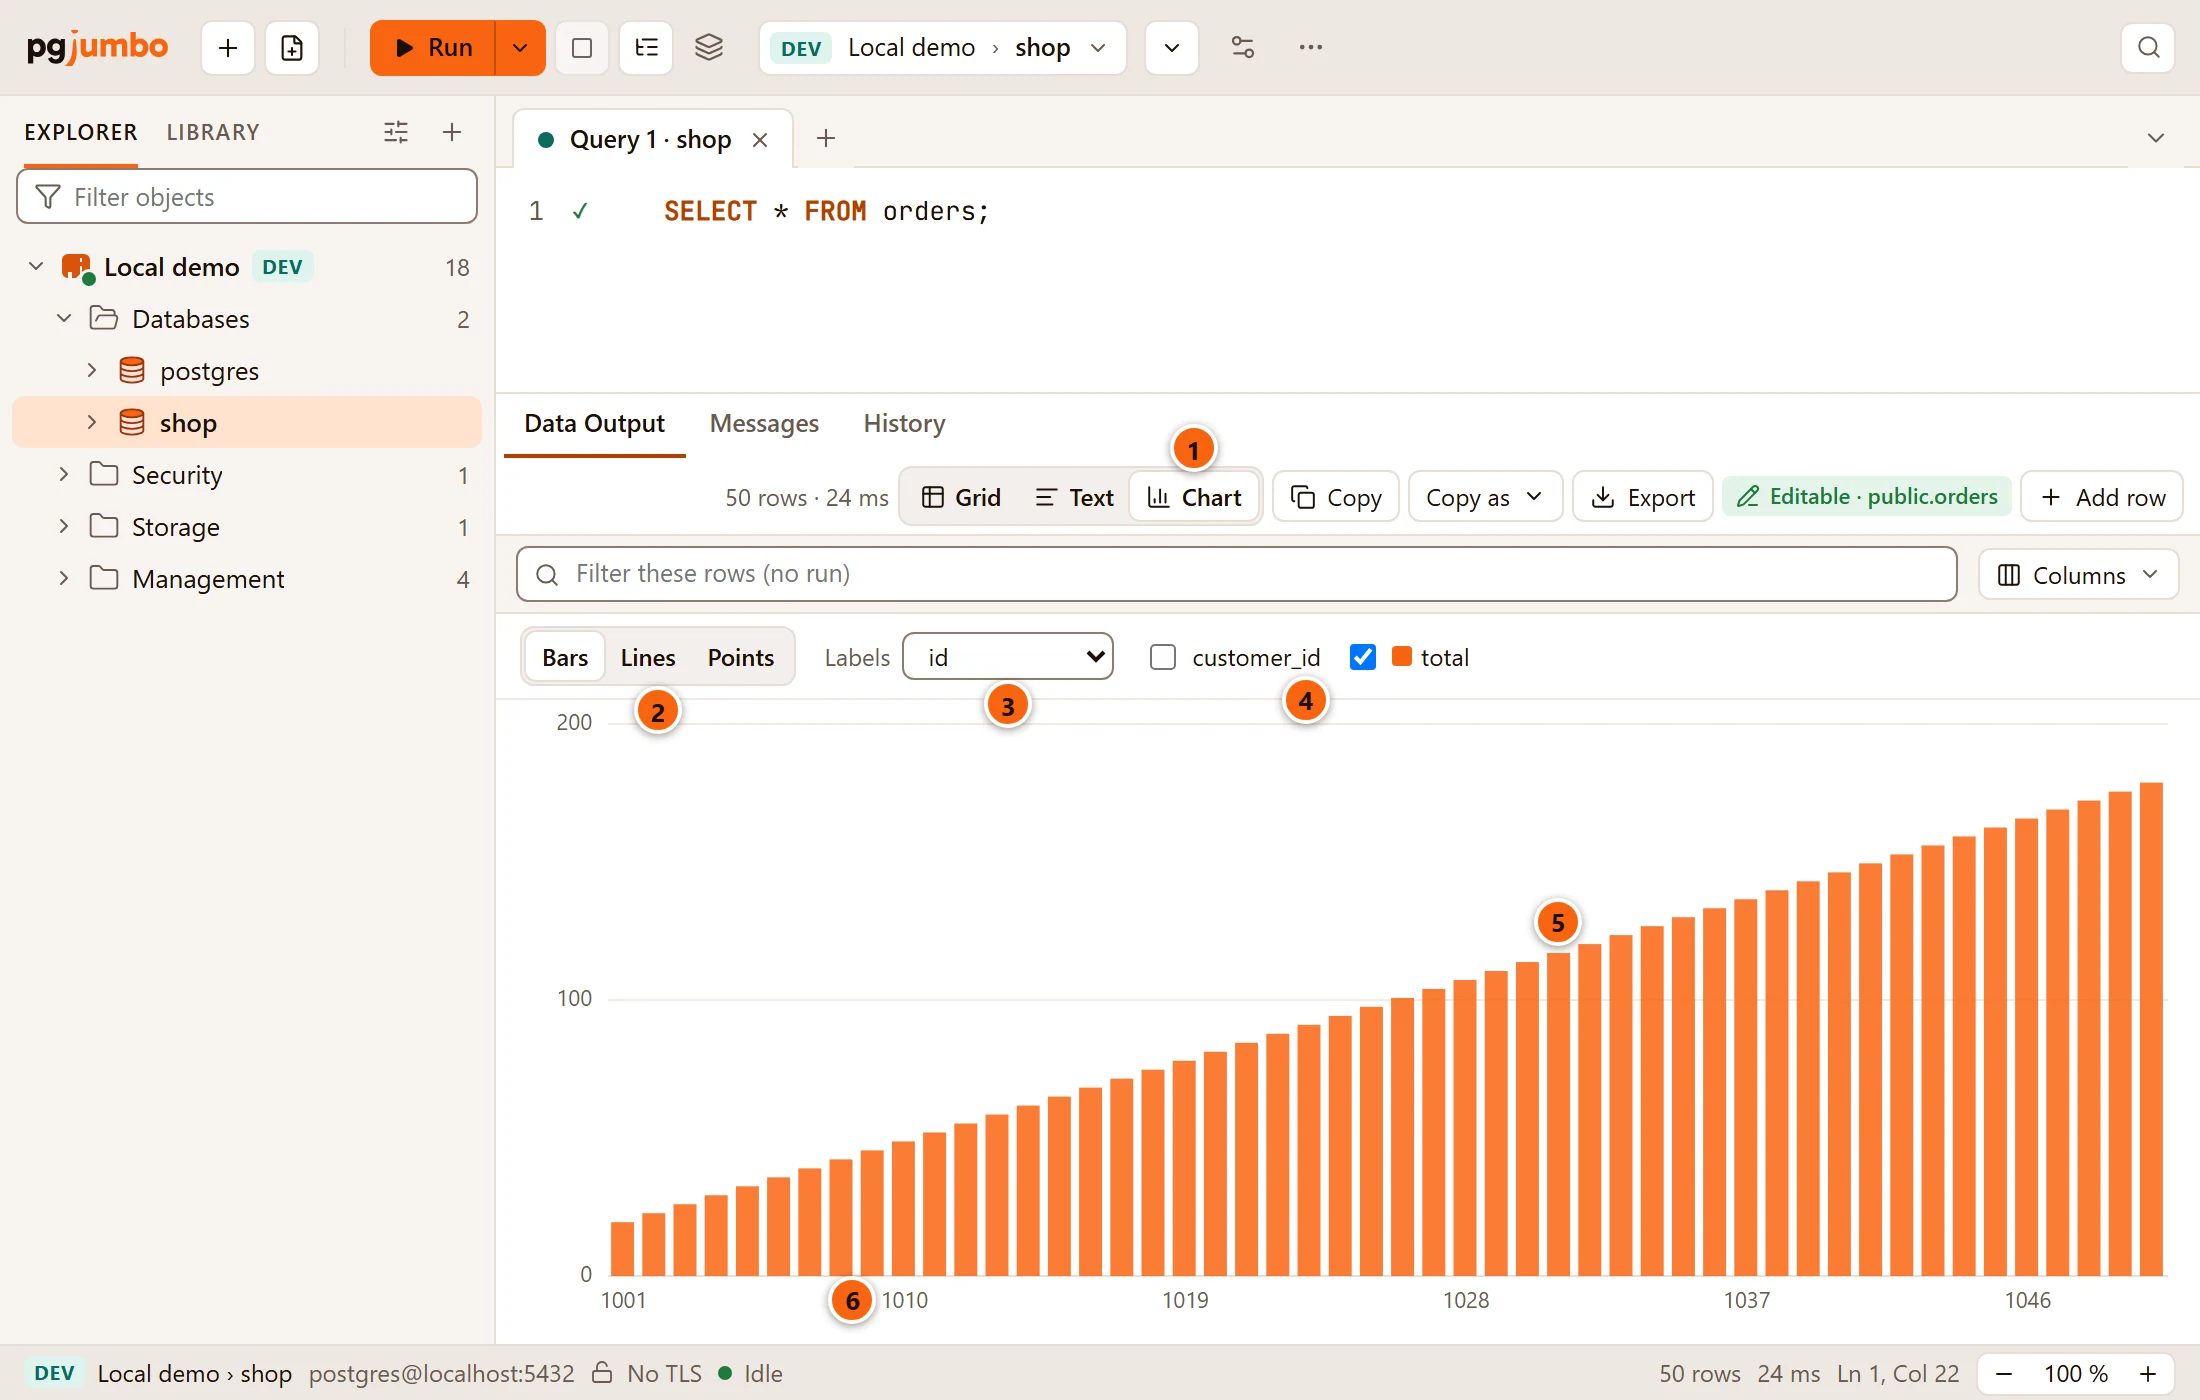
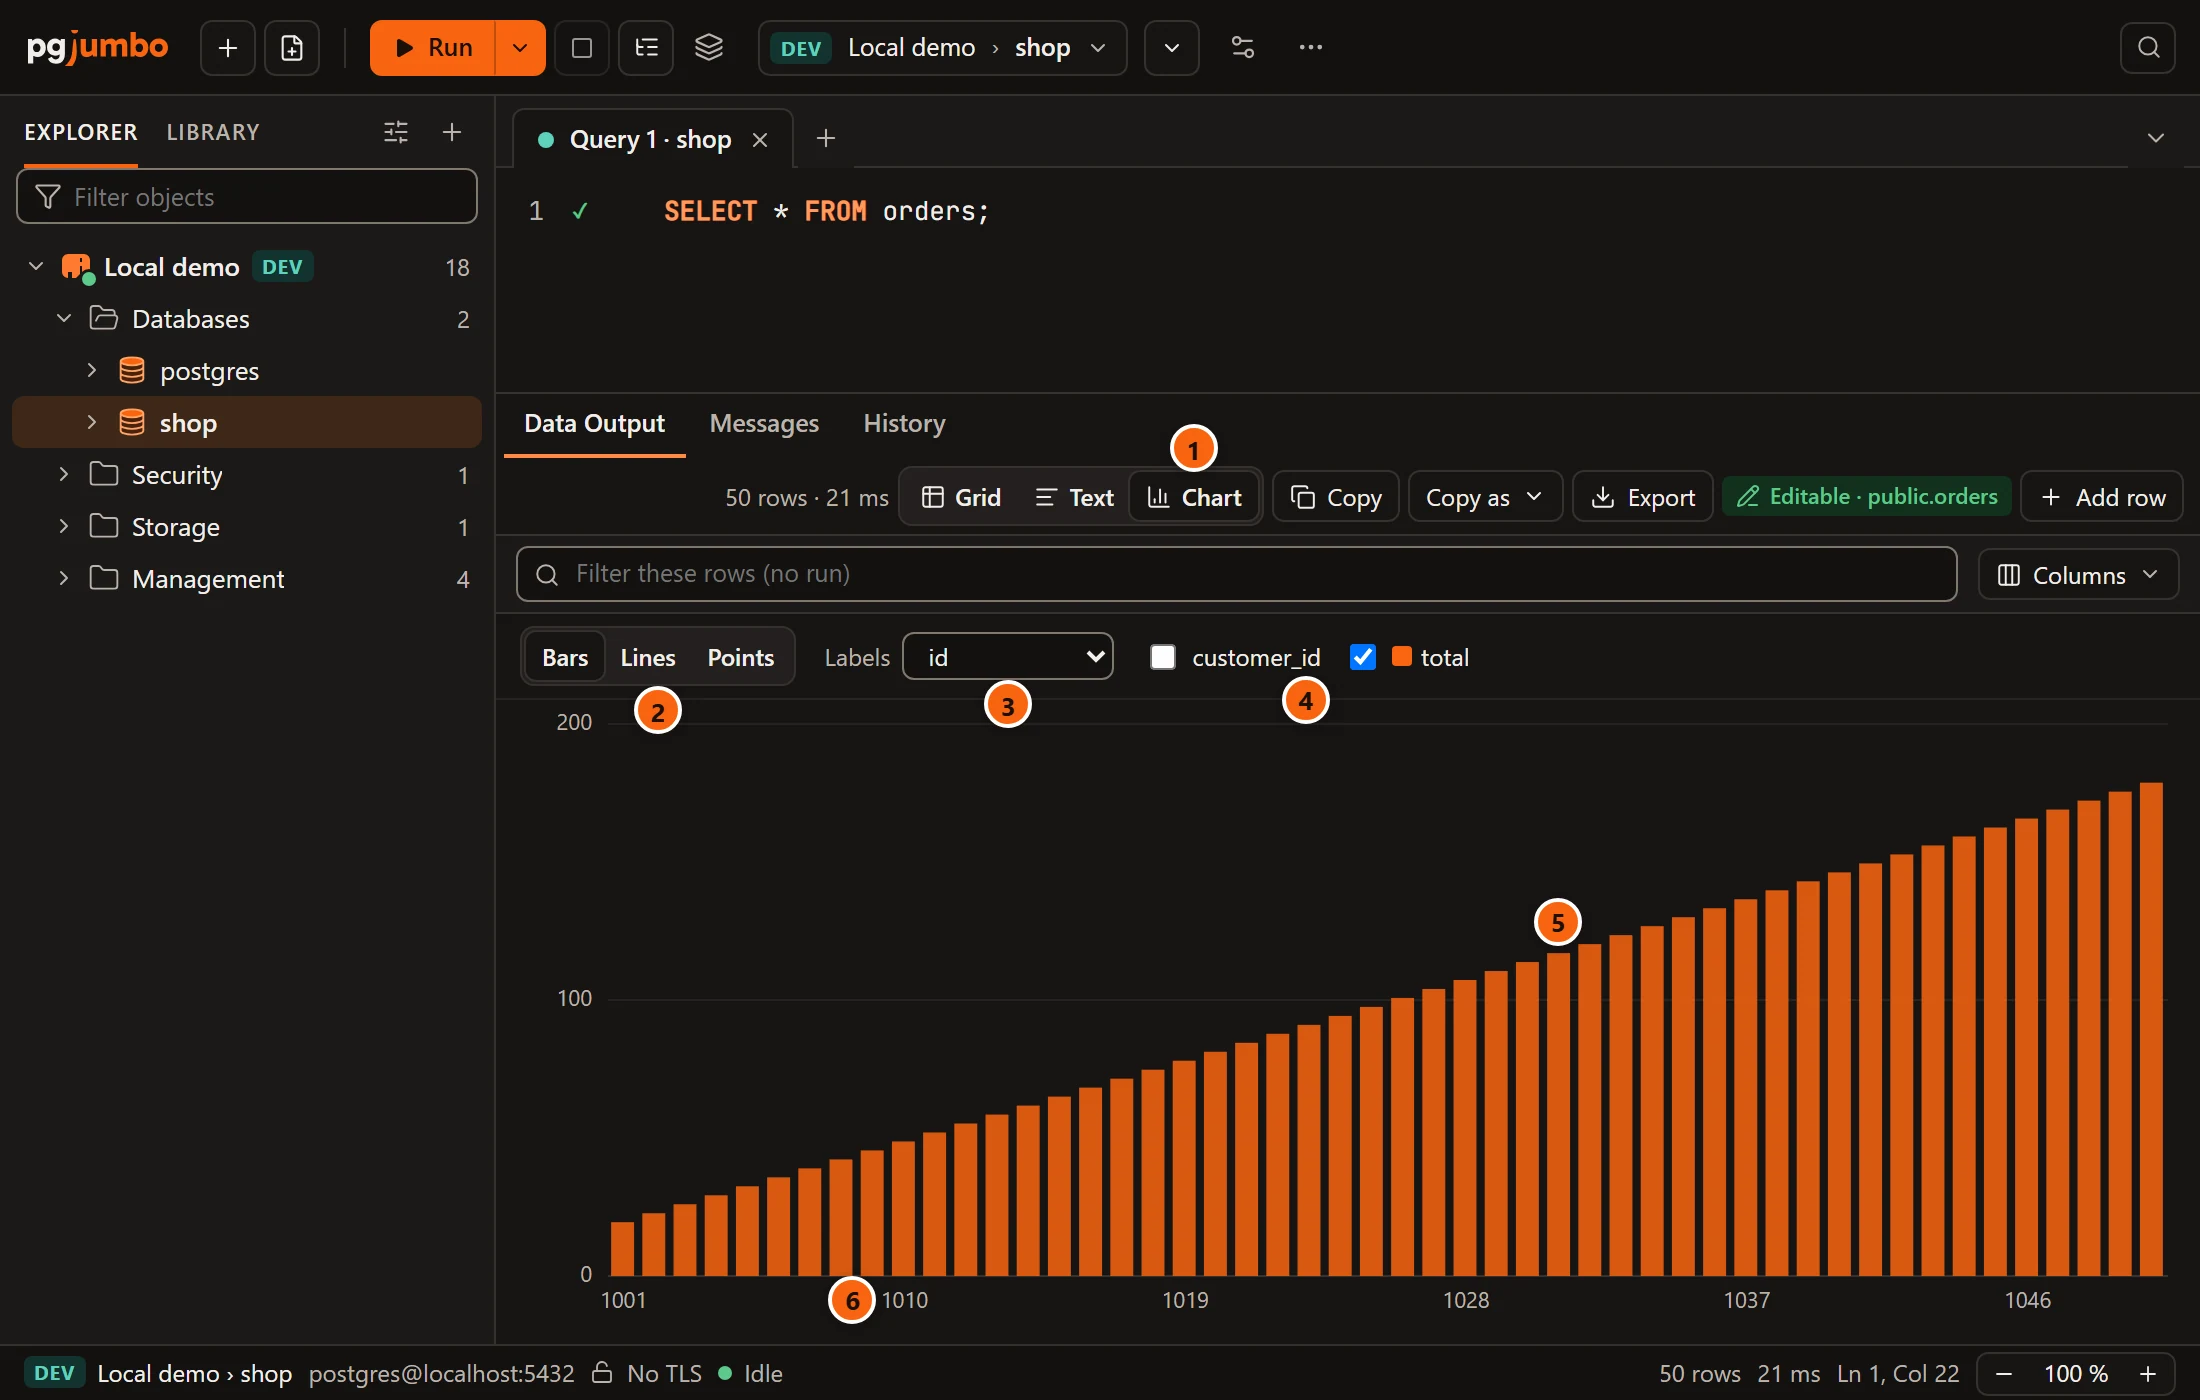
- 1 Chart is selected in the result bar.
- 2 Bars, Lines and Points switch the kind of chart.
- 3 Labels picks the column that names each mark along the bottom, or Row number. At first pgjumbo takes the first column that is not a number.
- 4 One tick box for each number column. Tick the ones to draw, six at most; each gets its own colour, shown beside its name. The column chosen for Labels is not among them.
- 5 A mark. Hover over it for its label, its column and its value, for example
1031 · total: 117. - 6 The labels under the axis. When there is no room for all of them, pgjumbo shows some at even steps. A long label is cut at twelve characters; hover over it to read all of it.
What the chart draws:
- Number columns are
smallint,integer,bigint,oid,real,double precisionandnumeric. A result without one says “This result has no number column to draw. Grid and Text show it.” With none ticked it says “Tick a column to draw.” - The rows are the grid’s, sorted and filtered as it shows them, and the first 1,000 of them. When there are more, the
chart’s bar says so:
The first 1,000 of 50,000 rows. To chart other rows, sort or filter in the grid, or narrow the query. - A
NULL, and a value that is not a finite number, draws no mark; a line has a gap there. - With several columns, the bars of one row stand side by side, and each line has its own colour and its own dash pattern, so they can be told apart without colour. A line over more than 60 rows is drawn without dots.
- The left scale covers every drawn column, so a column of large numbers flattens one of small numbers. Untick one to see the other.
The chart is for looking. Copy, Copy as and Export in the result bar still take the rows, not the picture.
A time axis
Section titled “A time axis”When the Labels column is a date, a timestamp or a timestamp with time zone, Lines and Points place
each row by its time instead of side by side.
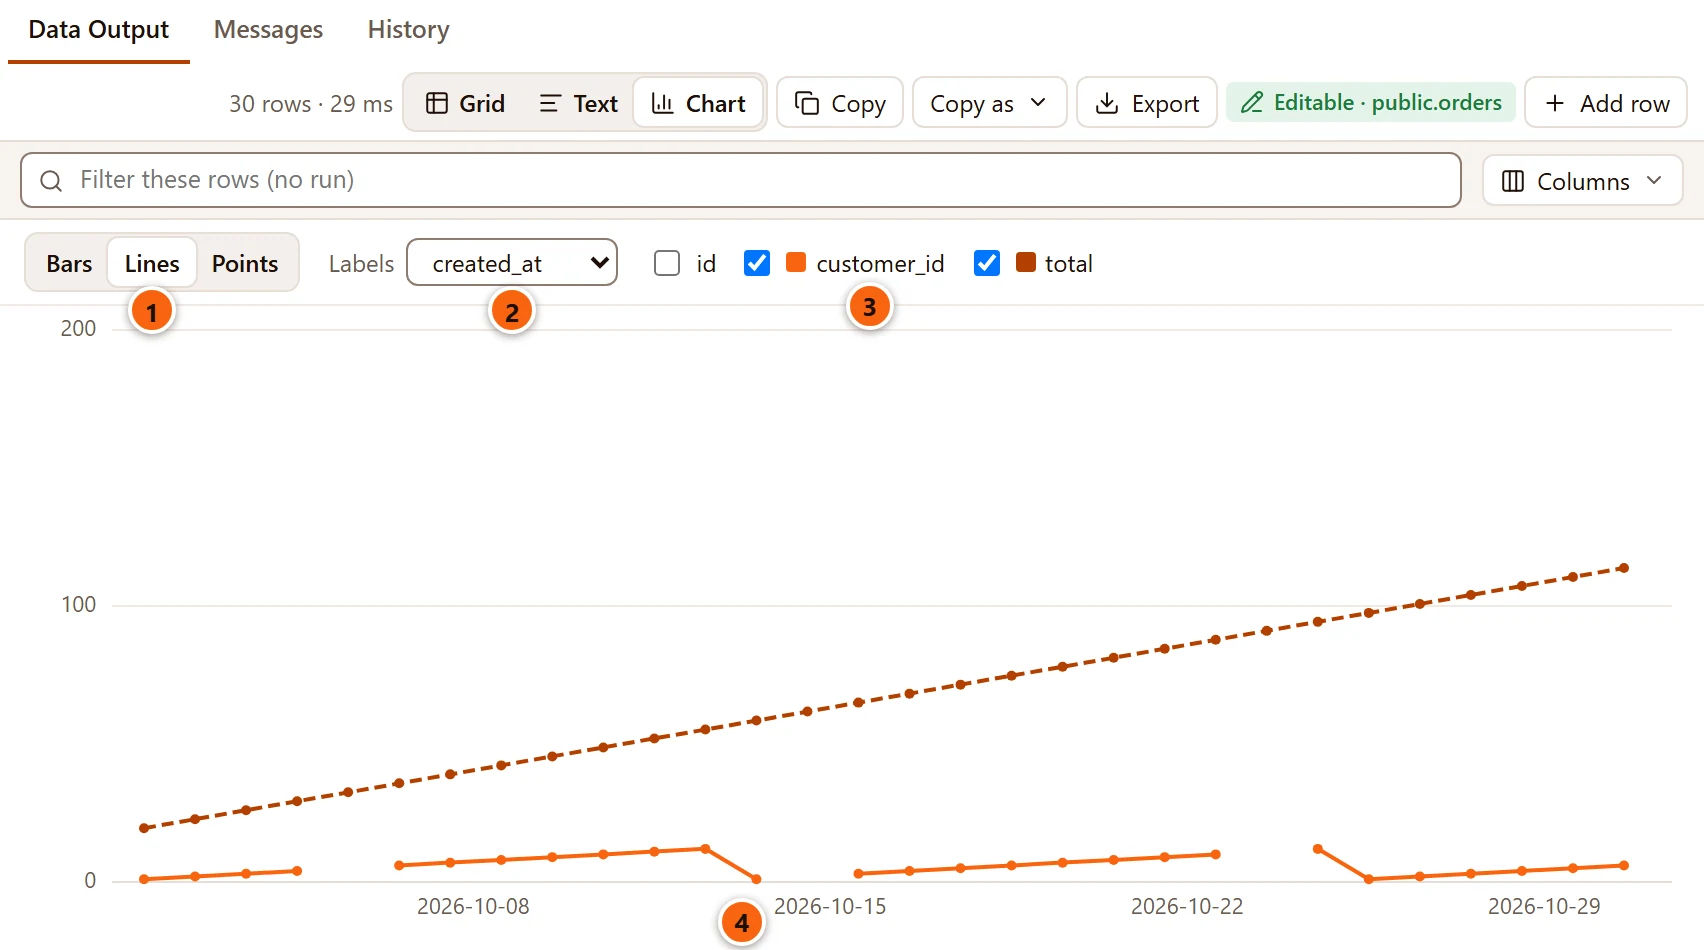
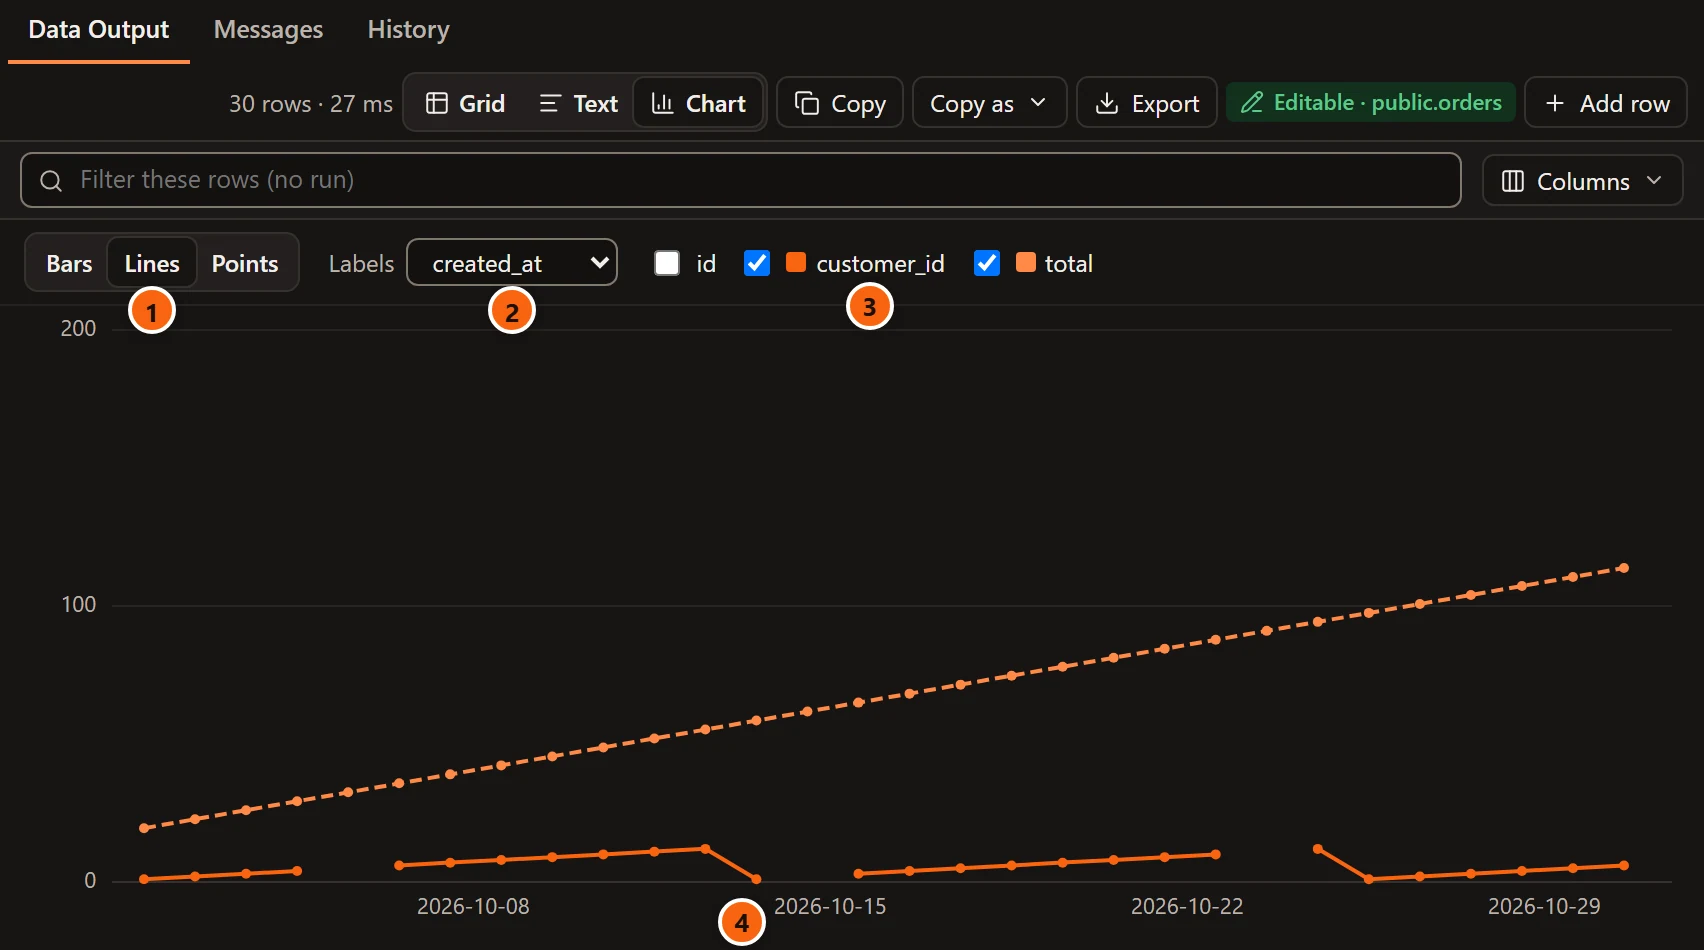
- 1 Lines is selected.
- 2 Labels is
created_at, atimestamp with time zone. - 3 Two columns are drawn, each in its own colour.
- 4 The labels fall on round dates (the start of a week, the first of a month), so a gap of five months looks like five months. The line joins the rows in the order of their times, whatever order the grid has them in.
A row whose time is NULL is not drawn on a time axis. Bars stay one bar a row, and say so under the axis: “One bar
a row, not a time axis”.
A result on a map
Section titled “A result on a map”When a finished result has a PostGIS geometry or geography column, the result bar offers Map. pgjumbo reads
the values in its engine and draws their points, lines and polygons. Only x and y are drawn; Z and M are read past.
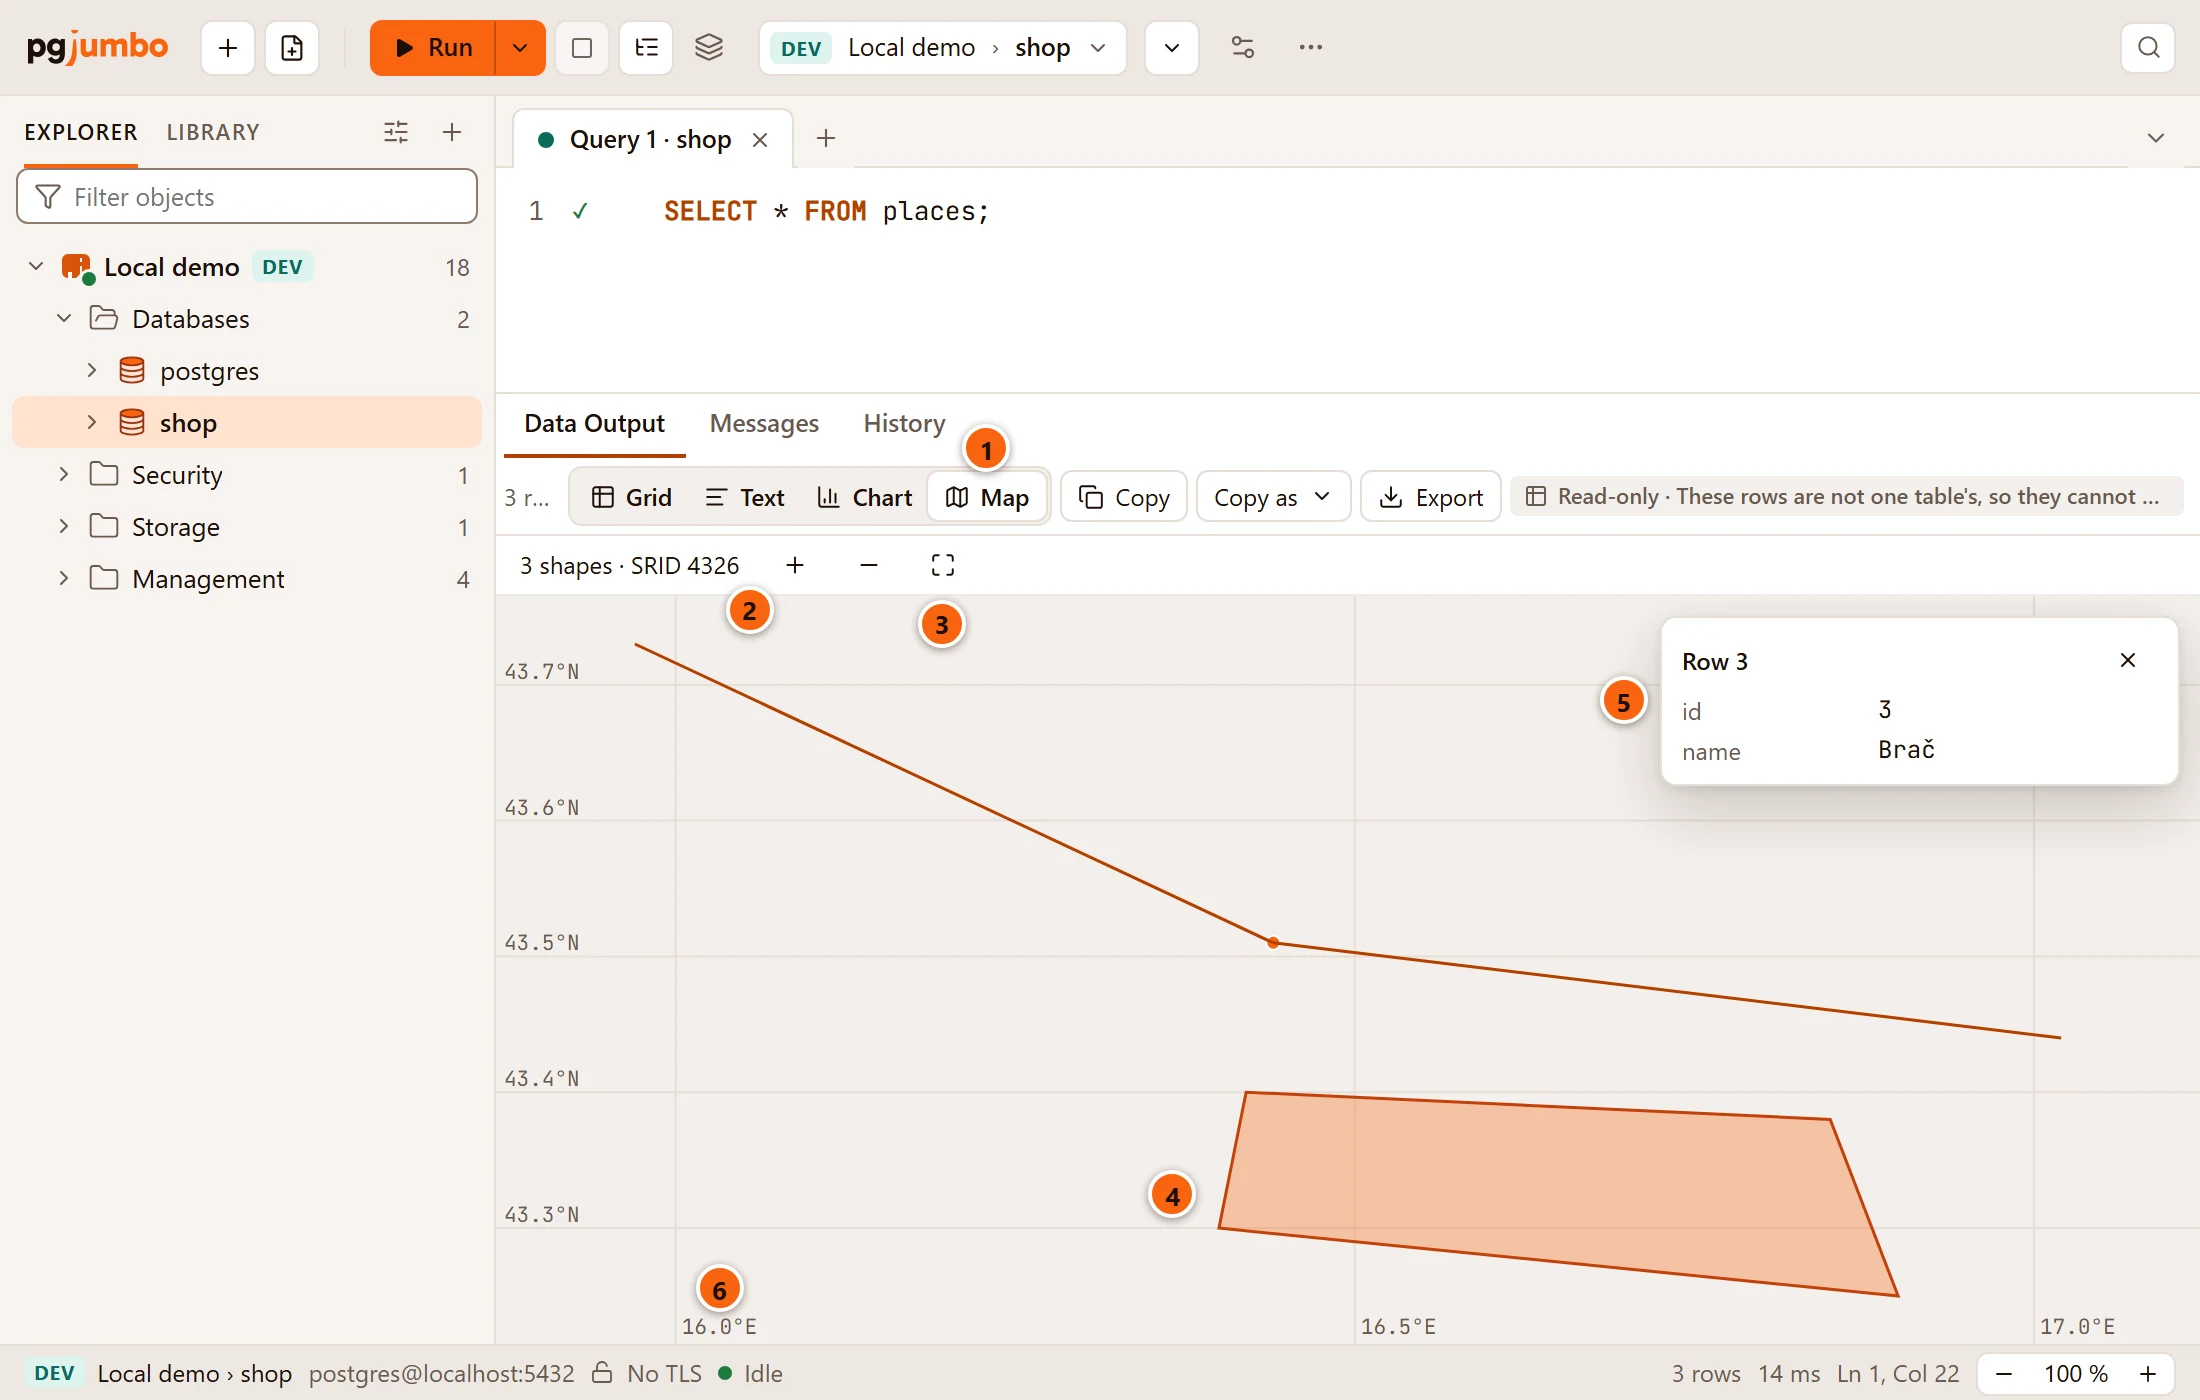
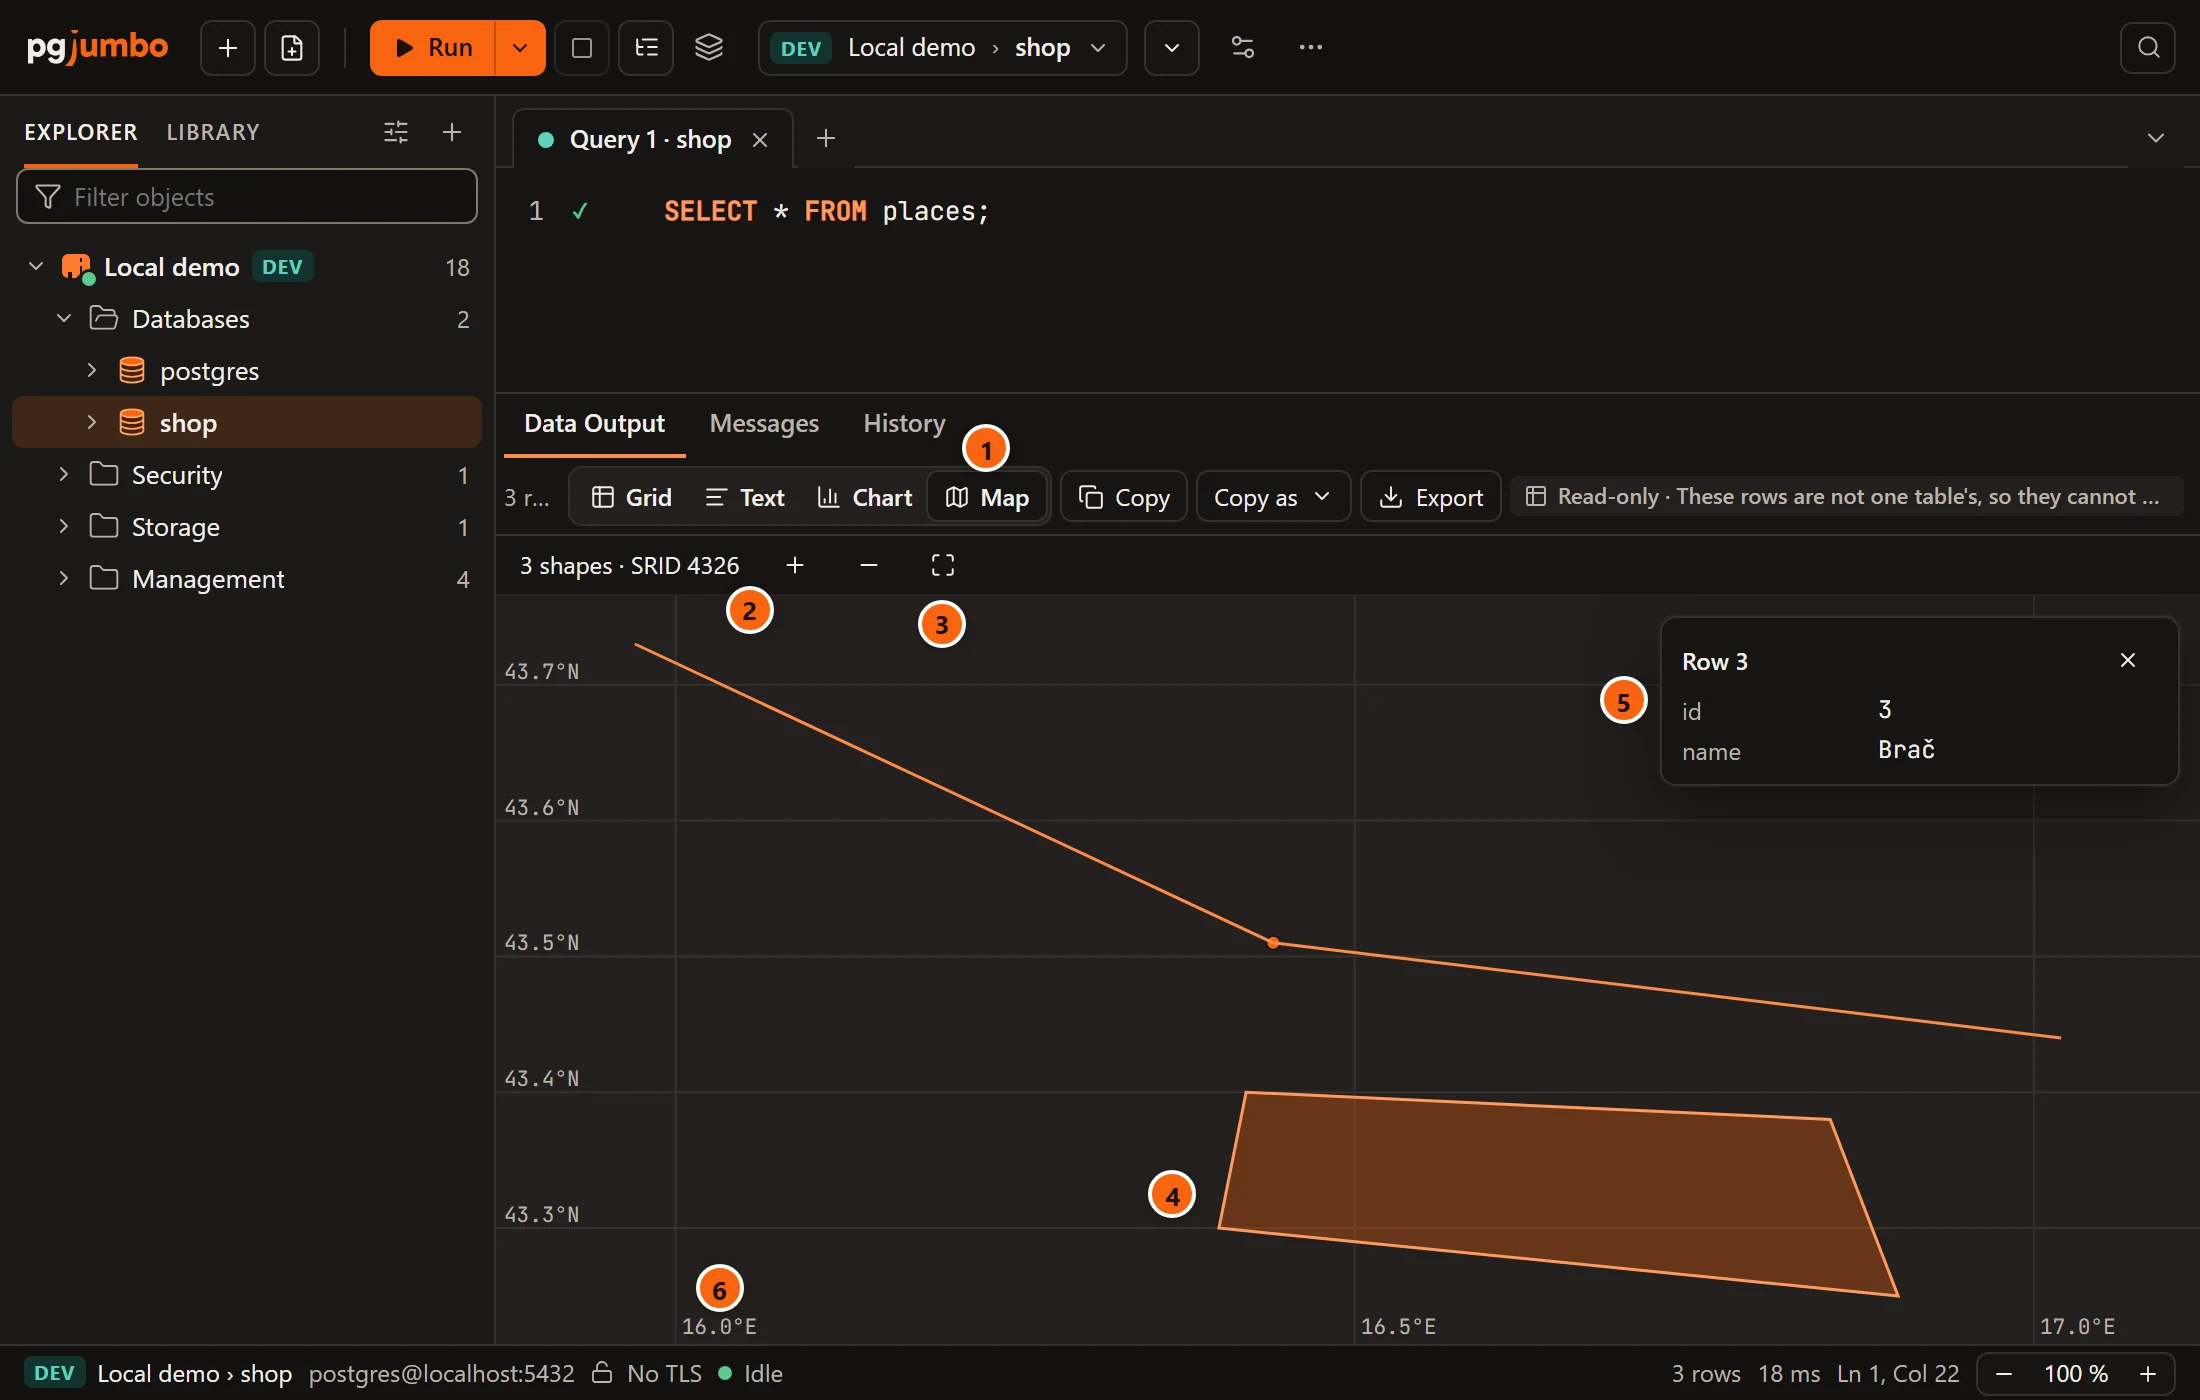
- 1 Map in the result bar.
- 2 What was drawn: the number of shapes and their SRID, or “no SRID”; a
geographycolumn is always SRID 4326. The line also says when some values were empty orNULL(2 empty), could not be read (1 not readable), or when the drawing stopped after 250,000 points (the rest left out: too many points). It saysReading shapes…while pgjumbo reads them. - 3 Zoom in (+), Zoom out (−) and Fit, which shows every shape again.
- 4 A shape. Hover over it to see its row number; click it to see the row.
- 5 The row of the shape you clicked, with up to eight of its other columns, each value as the grid shows it. The × closes the card.
- 6 The grid lines are labelled in the data’s own units: degrees (
16.5°E,43.5°N) for longitude and latitude, plain numbers for other coordinate systems.
With the mouse, the wheel zooms in and out around the pointer, dragging moves the map, and a double-click zooms in two
times around that spot. When a result has more than one geometry column, a list at the start of the map’s bar picks
the column to draw. If every value is empty or NULL, the map says “Nothing to draw: every value is empty or NULL.”
The map draws the rows the grid shows. Sorted or filtered there, it draws only the rows the filter keeps, and a shape’s row number is the one it has in the grid. A row’s card closes when the sort or the filter changes, as the number would then mean another row.
Rows in another SRID
Section titled “Rows in another SRID”A map shows one coordinate system at a time: the first row’s. Rows whose geometry is in another SRID are not drawn, and the map’s bar says how many and in which.


- 1
2 rows in SRID 3857 not drawn: the map shows one coordinate system at a time. To see those rows, filter the query to one SRID, or bring every row to the same one withST_Transform.
Map tiles
Section titled “Map tiles”At first the shapes sit on a plain grid and pgjumbo downloads nothing. To see them over a street map, enter a tile
server’s address in SettingsResultsMapsMap tiles under geometry, for example
https://tile.openstreetmap.org/{z}/{x}/{y}.png. The address must start with https:// and hold {z}, {x} and
{y}, where the tile’s zoom and place go. Empty it again and the map is back on the plain grid.
Tiles are used only for longitude and latitude (SRID 4326, which geography always is). The map then draws in Web
Mercator over the tiles without grid lines, shows the coordinates of its centre in the map’s bar, and names the tile
server at the bottom (Tiles: tile.openstreetmap.org). For data in another SRID, the bar says “tiles need longitude
and latitude (SRID 4326)” and the map keeps its plain grid.