

Query history
pgjumbo keeps every query you run, per server: the SQL, when it ran, on which database, how long it took and how it ended. The History tab of a Query Tool lists them, newest first, so you can search them, open one in the editor, run it again or copy it.
Open the History tab
Section titled “Open the History tab”Every Query Tool tab has a History tab under the editor, beside Messages. It shows the history of the tab’s server: what you ran there from every tab and on every database, also from tabs you closed long ago. Data tabs have no History tab.
What goes into the history:
- every run of a Query Tool, whatever way you started it (see Run SQL), whether it succeeded, failed or was cancelled: the text that ran, which is the selection when there was one;
- the
SELECTof a data tab, each time it reads its rows; - a run on several databases: one entry on each server it ran on, naming the database, or how many databases there were.
Explain and Explain Analyze are not recorded. Each server keeps its last 10,000 runs; older ones go as new ones come. A script larger than 1 MiB is not kept. A server’s history goes when you delete the server.
Every run
Section titled “Every run”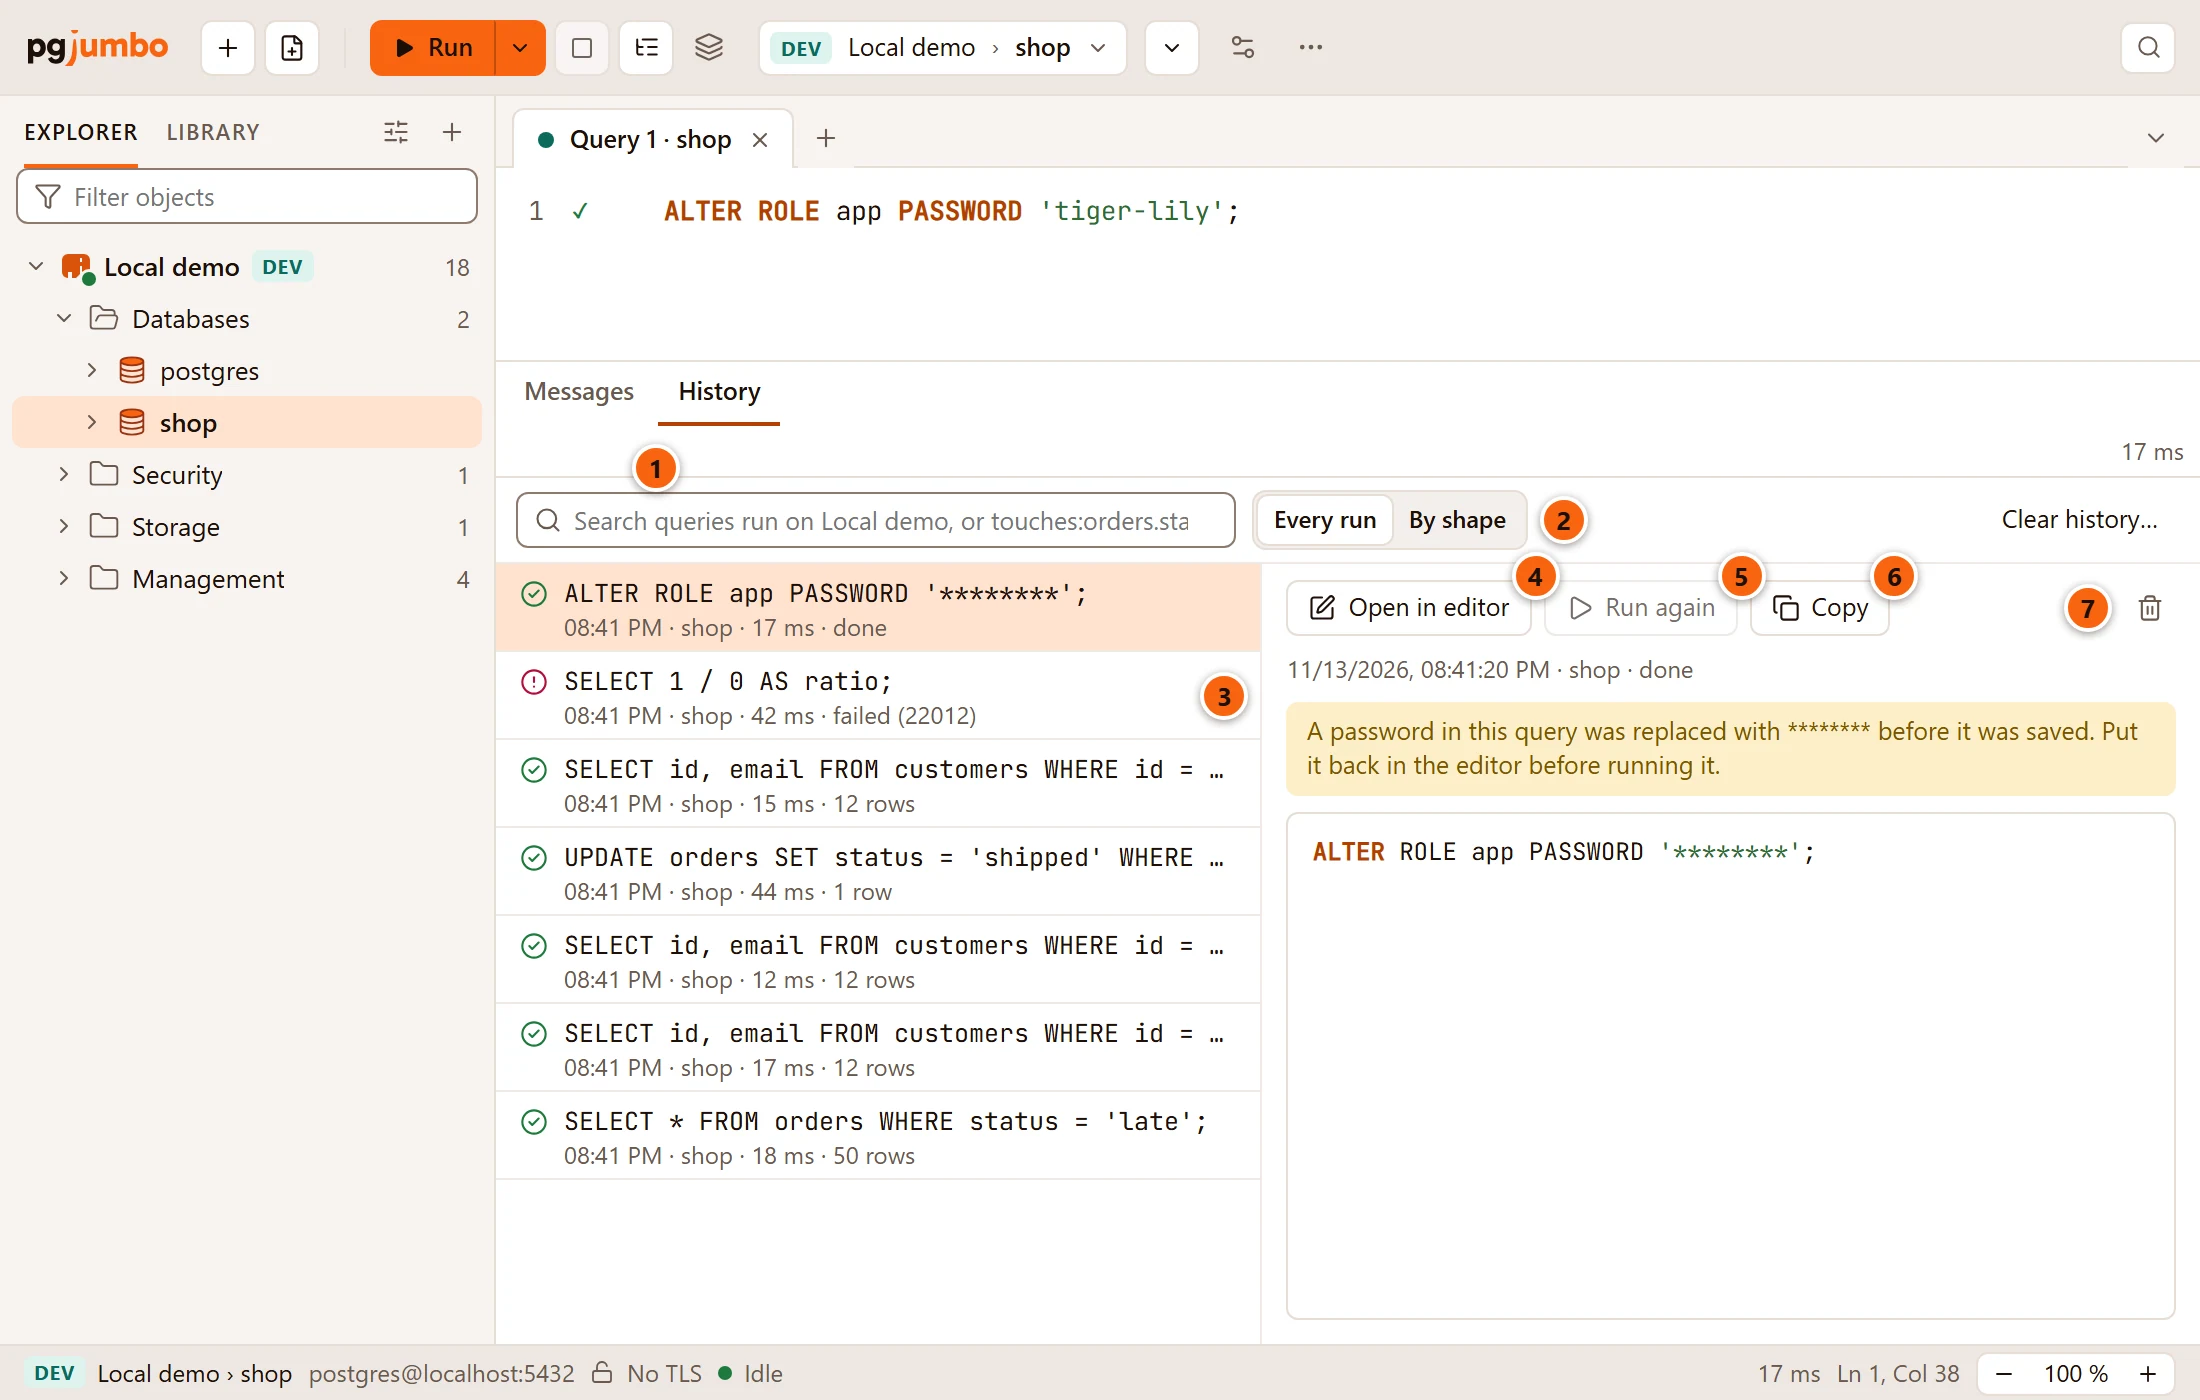
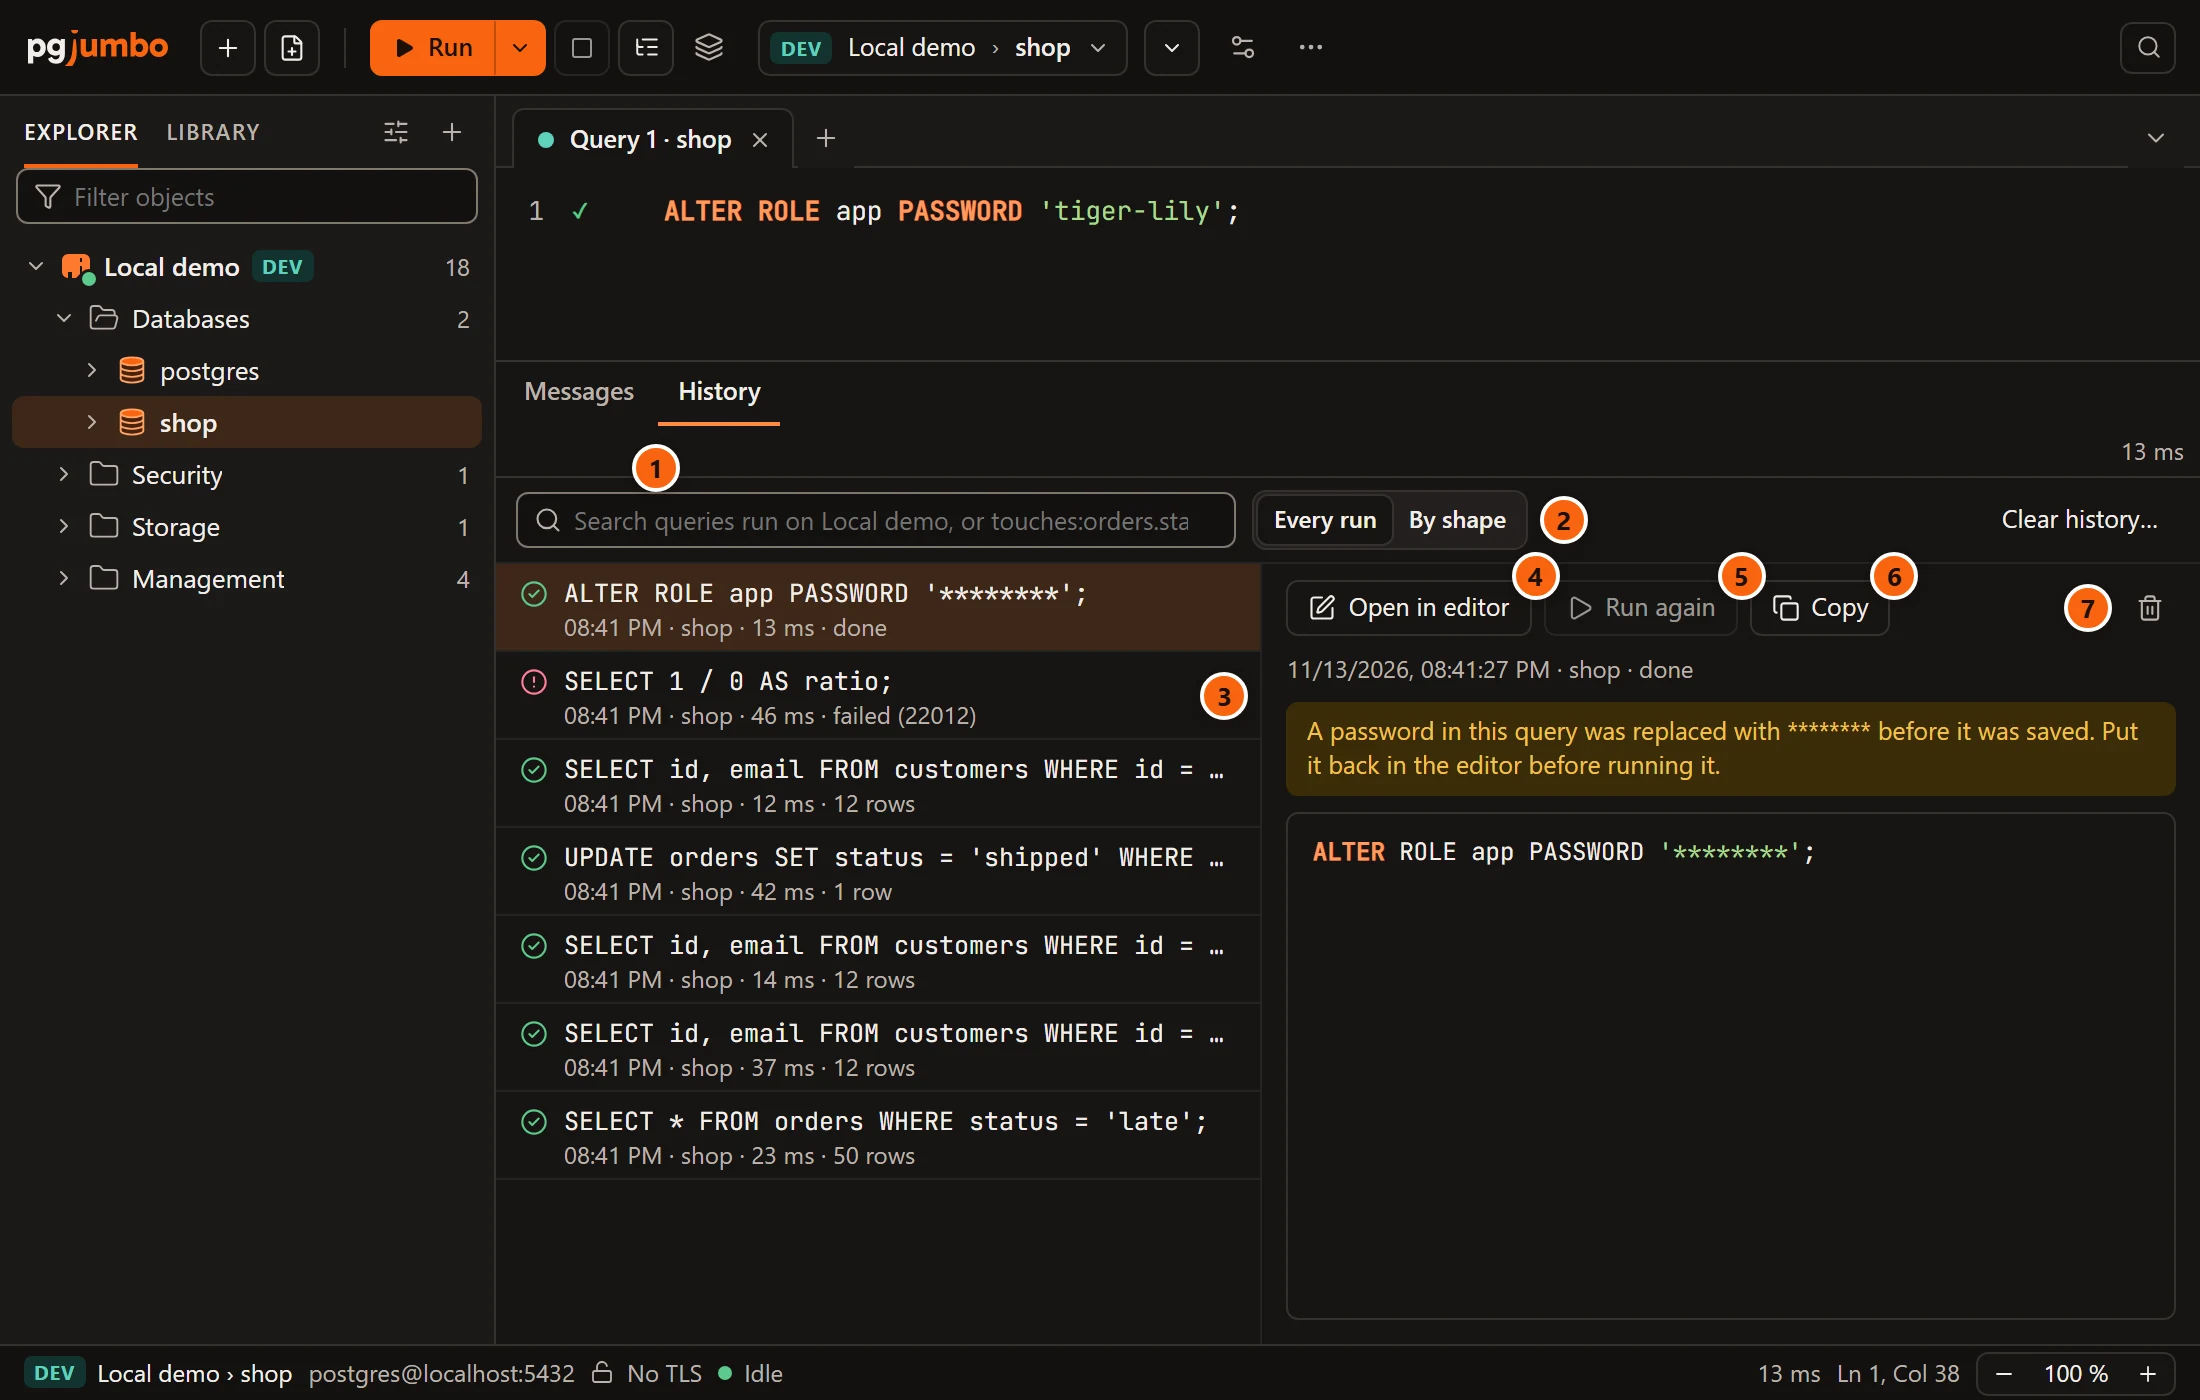
- 1 The search field. See Search the history.
- 2 Every run lists each run; By shape groups the runs of one query (see Runs grouped by shape). pgjumbo remembers your choice.
- 3 Each run shows an icon (succeeded, failed or cancelled), its SQL on one line, then when it ran (the time for today, the date and time for earlier days), the database, how long it took and how it ended: so many rows, done, failed with its SQLSTATE, such as failed (22012), or cancelled. The newest run is selected at first; click another to see it on the right.
- 4 Open in editor puts the query in this tab’s editor, selected: in place of the text when the editor is empty, otherwise below it. Undo (⌘ Z (Ctrl+Z on Windows and Linux)) takes it out again.
- 5 Run again does the same, then runs the query, as Run runs a selection. It runs in this tab, on this tab’s database, which may not be the database the run names. A Production server that asks before destructive statements asks again, and a query with parameters asks for their values again. It is greyed out while the tab is not connected or is running something, and for a query whose password was masked.
- 6 Copy puts the query on the clipboard; the result bar says Copied the query.
- 7 The bin, Delete from the history, deletes this run at once, without asking.
Under the buttons, a line gives the run’s full date and time, its database and how it ended. Under it come a note when a password was masked, the values its parameters were given (a line that starts with With, see Parameters in History), and the whole query.
| In the list | What it does |
|---|---|
| ↑ ↓ | Selects the run above or below. |
| Page Up Page Down | Moves ten runs. |
| ↩︎ (Enter on Windows and Linux), or a double-click | Open in editor. |
The list loads more runs as you scroll. With nothing run yet it says Queries you run on Local demo appear here.
Runs grouped by shape
Section titled “Runs grouped by shape”Choose By shape to see one row per query, however many times it ran. Runs have the same shape when they differ only
in their values and spacing, as PostgreSQL itself would group them: WHERE id = 7 and WHERE id = 31 are one shape.
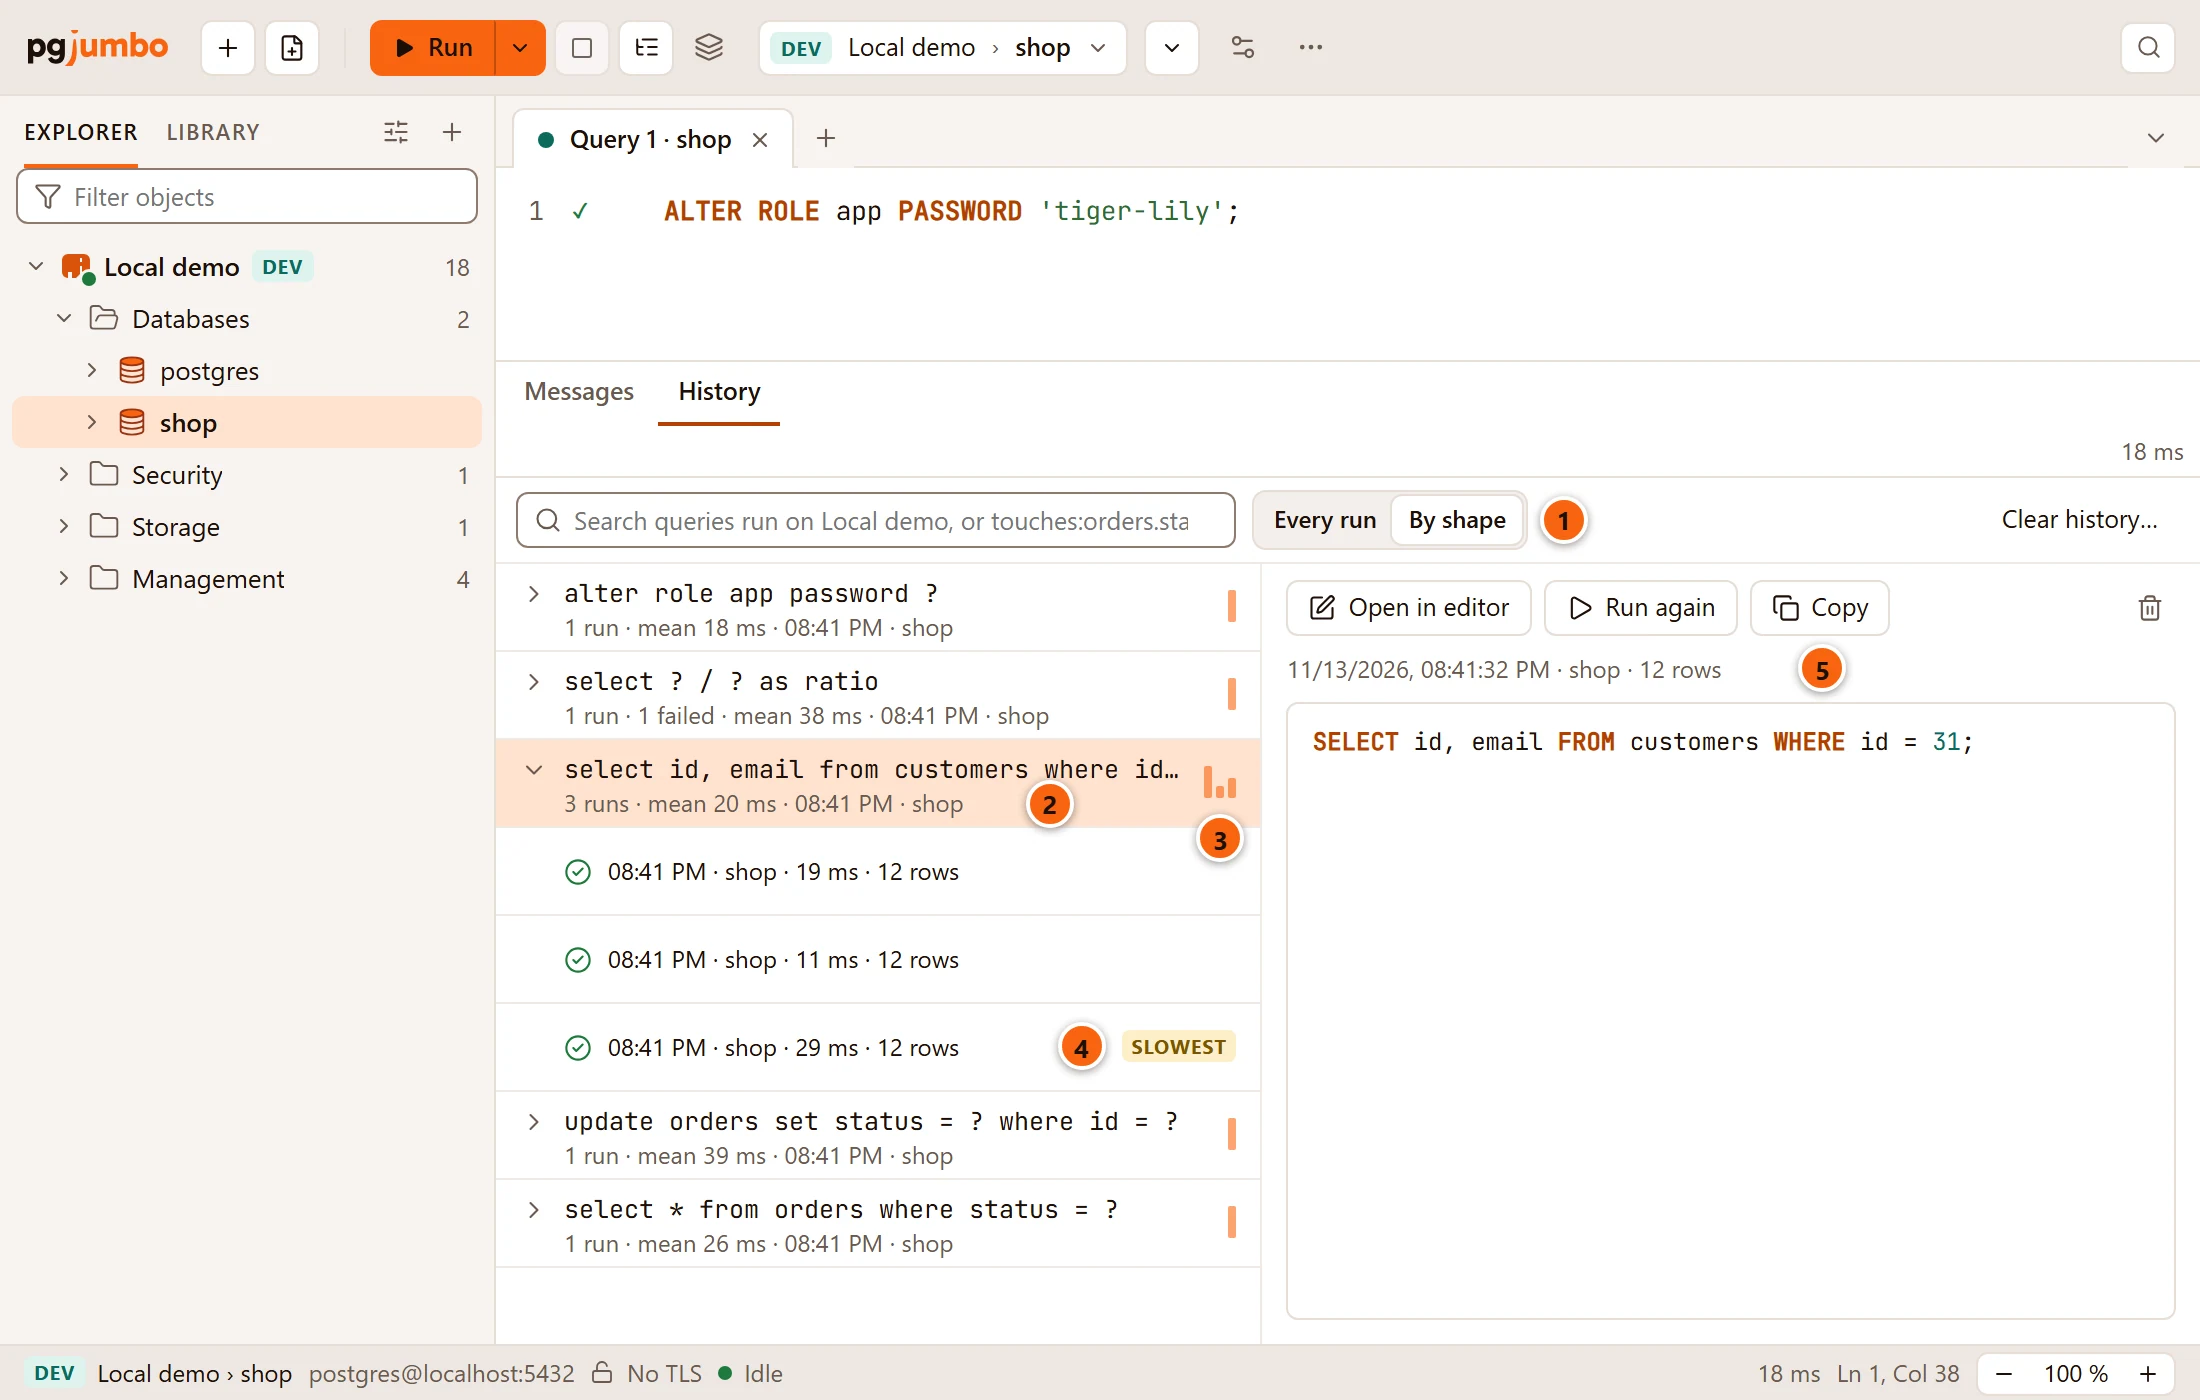
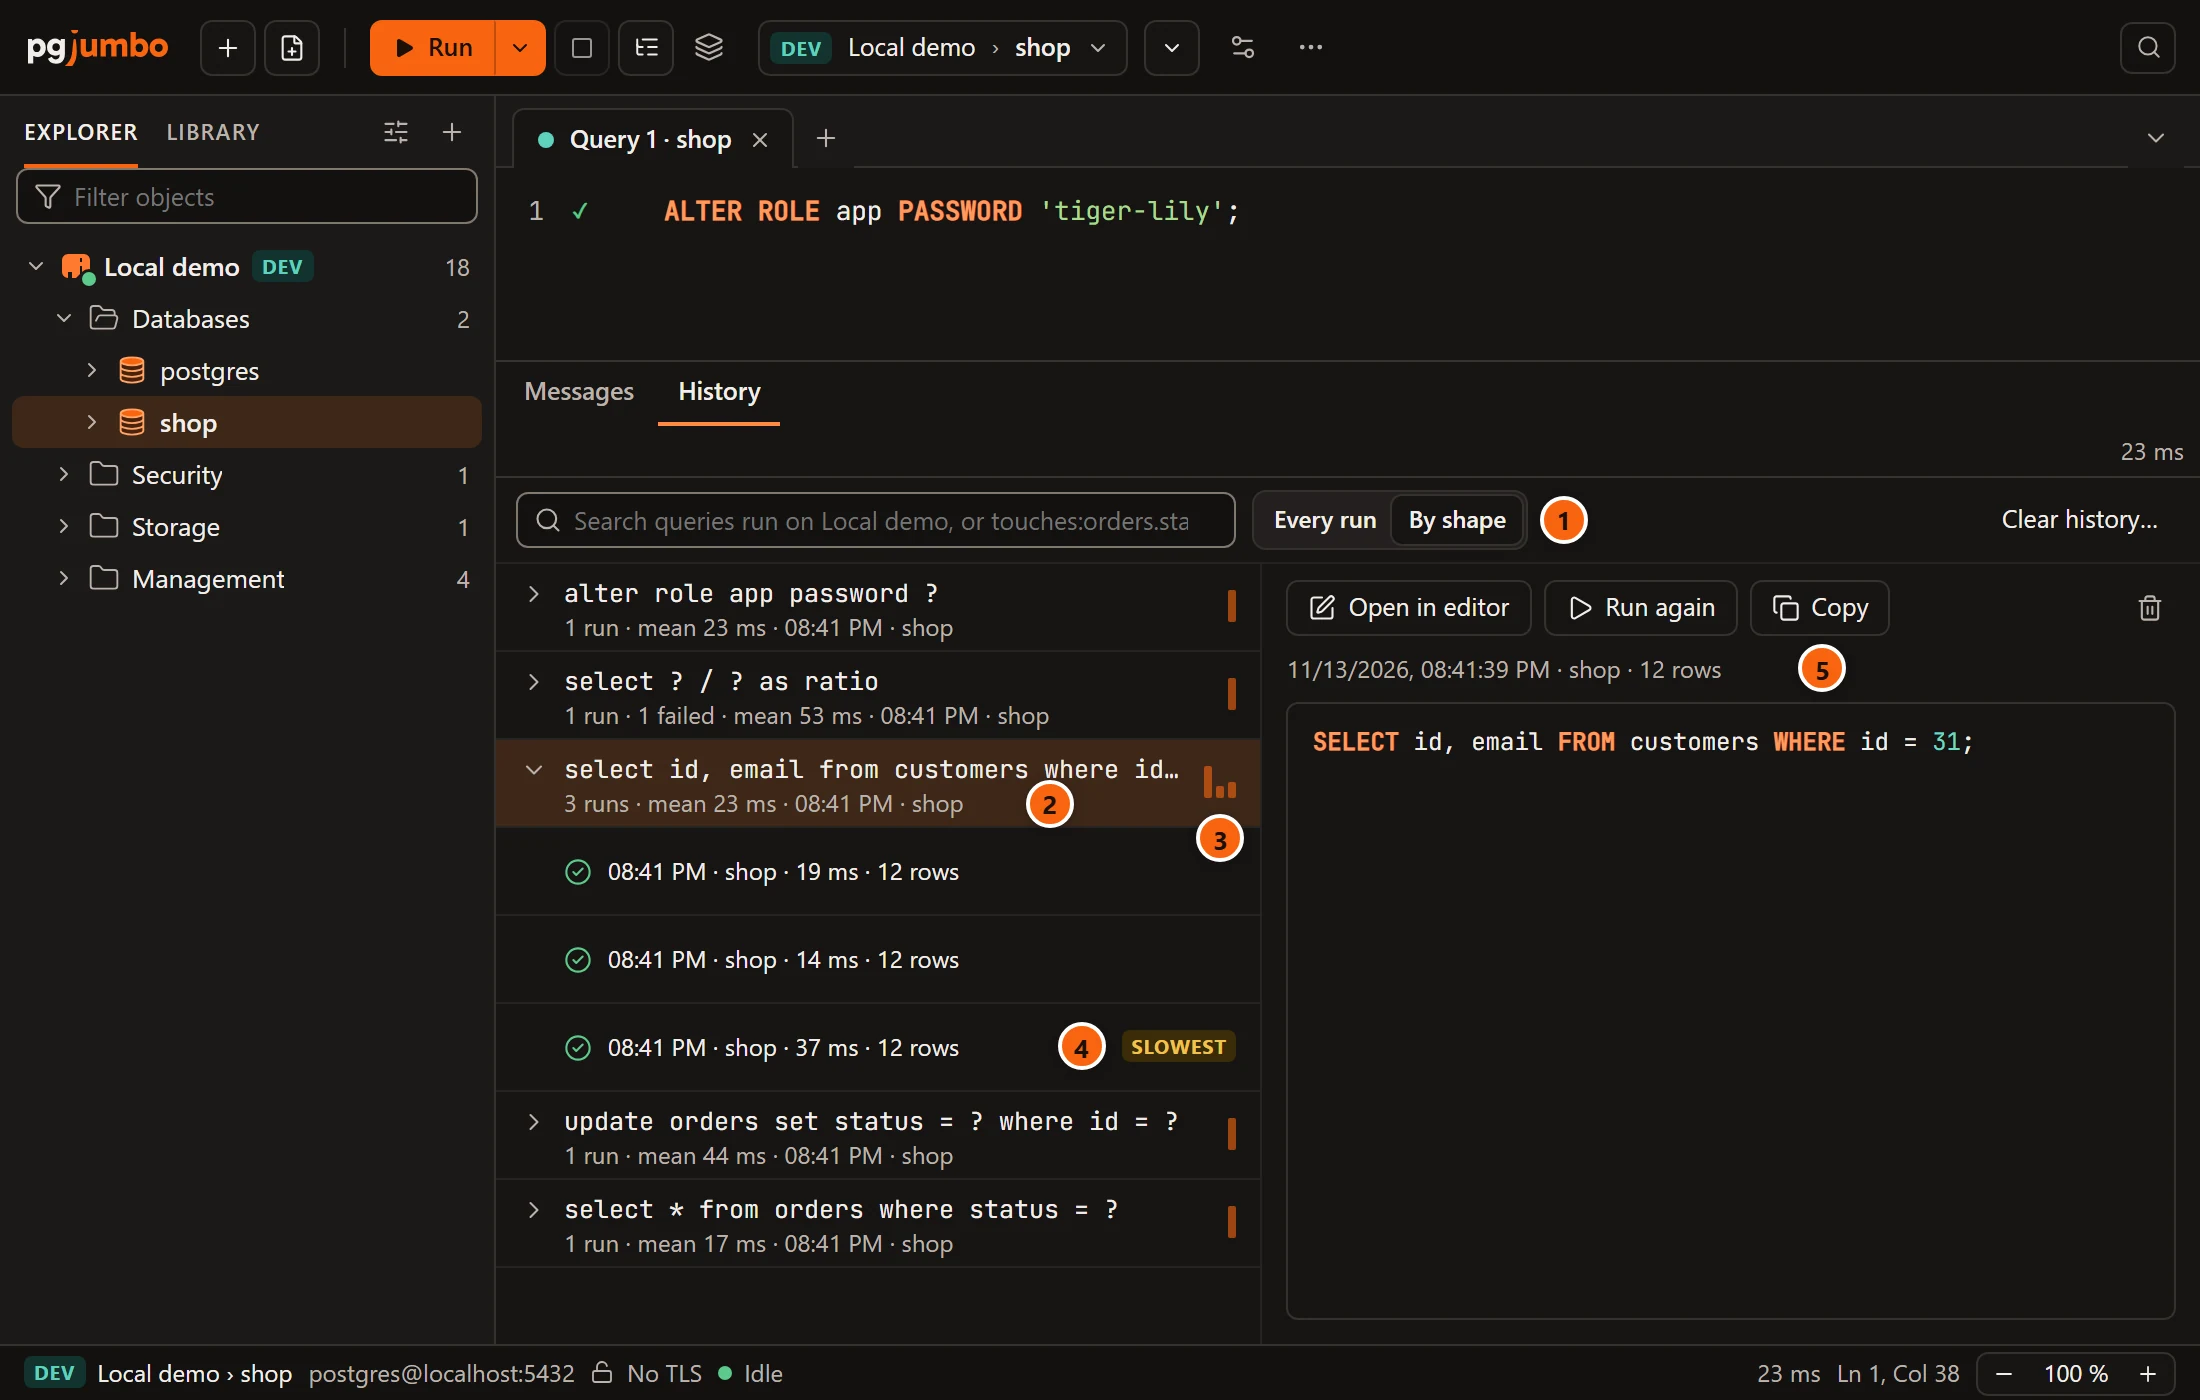
- 1 By shape is chosen.
- 2 Each group shows the query’s shape, with every value as
?, then how many runs it has, how many failed, their mean time, when it last ran and on which database, such as3 runs · mean 40 ms · 03:43 PM · shop. - 3 A small chart of the times of its last twelve runs, oldest first: a tall bar is a slow run.
- 4 Click a group to open it: it lists each run with its time, database, duration, rows and the values of its parameters, newest first. The slowest run is marked Slowest when the group has more than one. Click the group again to close it.
- 5 On the right is the run you selected, or the newest run of the open group, with the buttons of Every run. With a closed group selected, it says Open a group to see each run with its values, time and rows; the slowest is marked.
Groups are listed by when they last ran, newest first.
| In the list | What it does |
|---|---|
| ↑ ↓, Page Up Page Down | Selects the row above or below, or ten rows on. |
| → | Opens the selected group. |
| ← | Closes the open group and selects it. |
| ↩︎ (Enter on Windows and Linux) | Opens or closes the selected group; on a run, Open in editor. |
| A double-click on a run | Open in editor. |
Search the history
Section titled “Search the history”Type in the search field to keep only the runs that match. The search covers the whole history of the server, not only what the list has loaded. With By shape, it keeps the groups that have a matching run.
- Words: every word you type must match the start of a word in the query, in any case.
upd ordfindsUPDATE orders SET …. Punctuation is ignored. touches:ordersfinds the runs that read or wrote the tableorders.touches:orders.statusfinds the runs that named the columnstatusoforders, also through an alias, as inSELECT o.status FROM orders o.
A touches: word names a whole table or column, in any case: touches:order does not find orders. You can give
several, and mix them with words: touches:orders.status update finds the runs that changed that column with an
UPDATE. Hover over the field for a reminder.
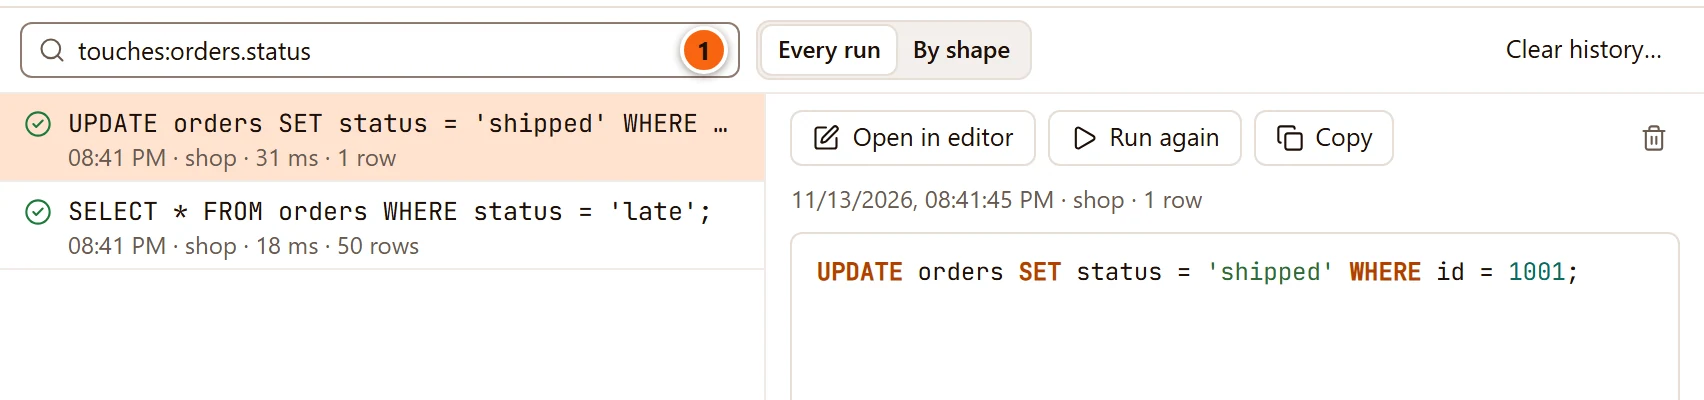
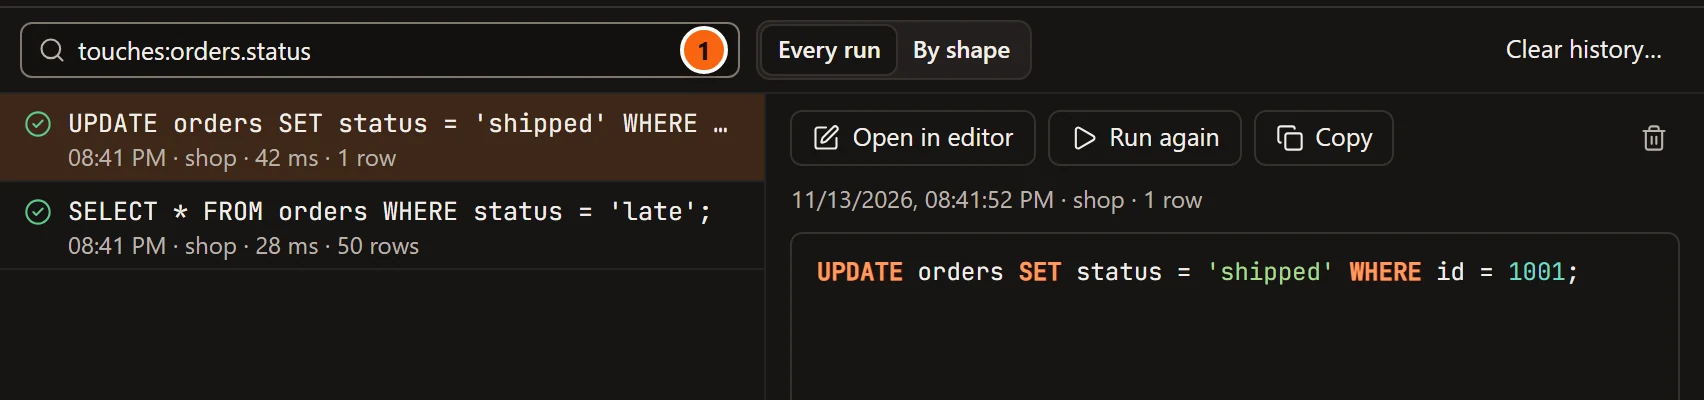
- 1 The search. Here it keeps the two runs that named
orders.status; the one that readcustomersis gone.
When a search finds nothing, the list says No query matches and your search. Empty the field to see every run again.
Clear the history
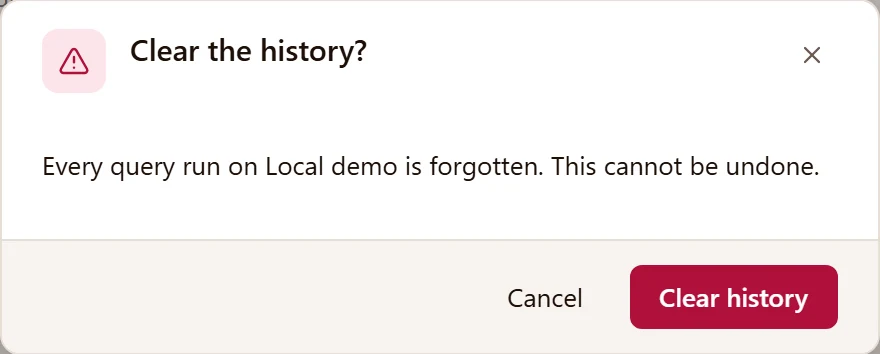
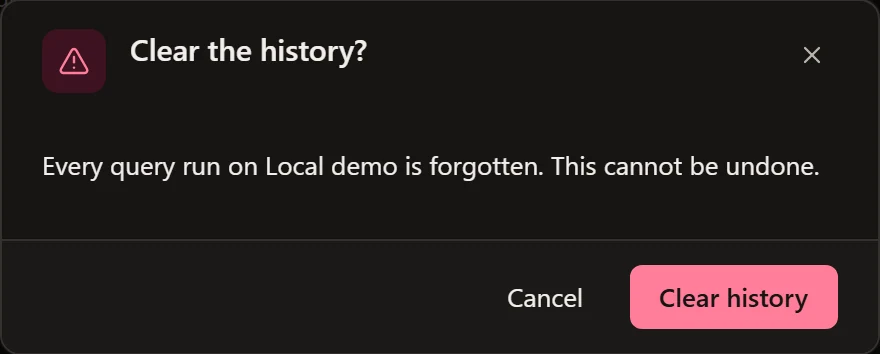
Section titled “Clear the history”Clear history… at the right of the bar forgets every query run on the server, whatever the search shows. In Every run it is greyed out while the list is empty. It asks first:
Passwords are masked
Section titled “Passwords are masked”Before a query goes into the history, pgjumbo replaces what looks like a password with ********:
| Written as | Example | Kept as |
|---|---|---|
A string right after the word PASSWORD, also OPTIONS (password '…') |
ALTER ROLE app PASSWORD 'tiger-lily' |
PASSWORD '********' |
password= in a connection string, inside a string or not |
CONNECTION 'host=db1 user=rep password=s3cret' |
password=******** |
| The password of a connection URI | 'postgresql://app:s3cret@db1/shop' |
app:********@ |
PGPASSWORD=, an upper-case name ending in _PASSWORD=, a name ending in _password= or Password= |
POSTGRES_PASSWORD=s3cret |
POSTGRES_PASSWORD=******** |
"password": "…" as JSON writes it, and password: … as YAML and plain text do |
'{"user": "app", "password": "s3cret"}' |
"password": "********" |
The password of a .pgpass line |
db1:5432:shop:app:s3cret |
db1:5432:shop:app:******** |
It looks inside comments, quoted names and dollar-quoted bodies too (a DO block, a function’s body). It leaves alone
what reads as SQL rather than a secret: a column named password, WHERE password = $1, password::text. Anything
written another way, such as a key passed to a function, stays readable in the history: delete that run with the bin.
A run with a masked password cannot run as it is, as the ALTER ROLE run in the picture of
Every run shows. Its note says A password in this query was replaced with
******** before it was saved. Put it back in the editor before running it., and Run again is greyed out,
with the tooltip “Put the password back in the editor first”. Click Open in editor, type the password in place of
********, and run it.
The values of a run’s parameters are masked by their names: see Parameters in History.