

Run with Profiler
Explain shows where a query’s time goes, and stops at a function call: a function is one number in a plan. Run with Profiler looks inside. It runs your SQL with the profiler of the plpgsql_check extension on, for that run only, and then lists the PL/pgSQL functions and procedures the run called, each with the time and the number of runs of every line of its body.
Run with the profiler on
Section titled “Run with the profiler on”Write the SQL that calls the function, as you would run it: a SELECT that uses it, a CALL of a procedure, a write
that fires a trigger function. Then choose Run with Profiler in one of two places:
- QueryRun with Profiler in the menu bar;
- the ⌄ beside Run in the toolbar (More ways to run).
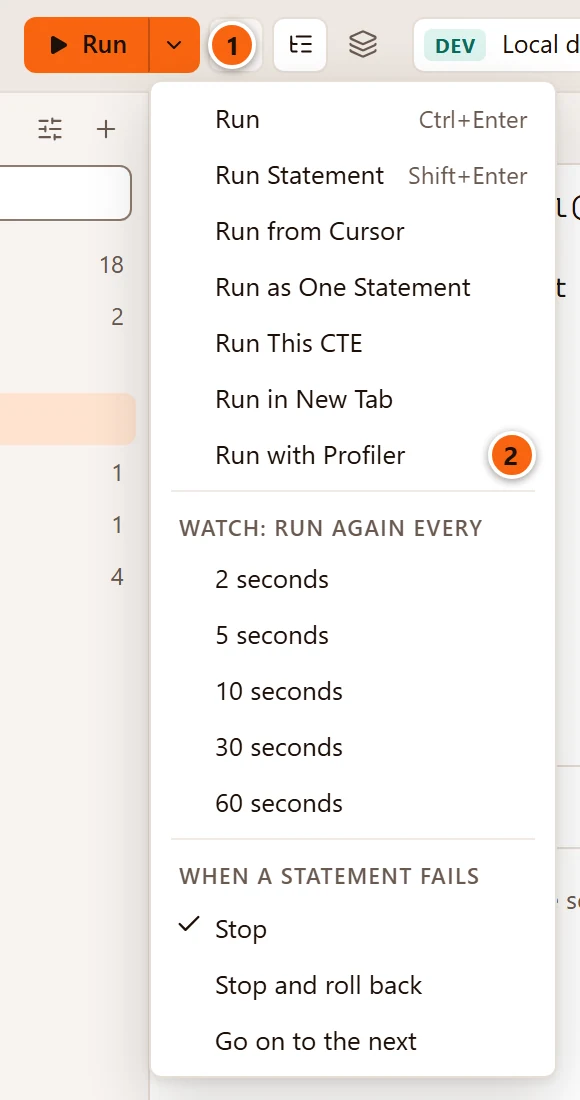
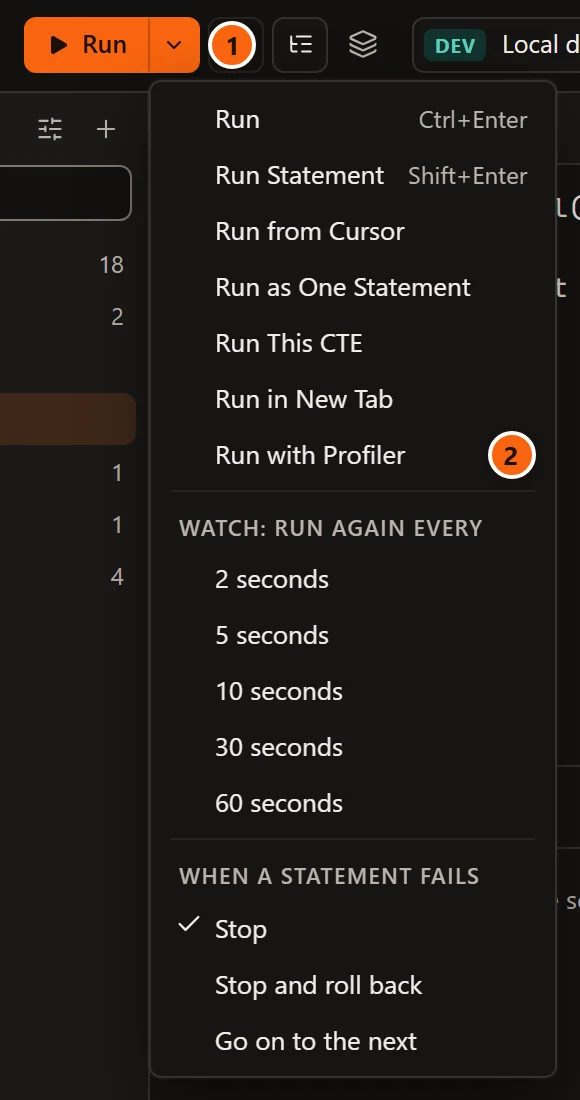
- 1 More ways to run, the ⌄ beside Run.
- 2 Run with Profiler. It has no shortcut of its own; Change the shortcuts says how to give it one.
It runs what Run runs: the selection if there is one, else the whole tab. It is a real run, with everything Run SQL says about one: the statements change what they change, the results come to Data Output and Messages, a statement with parameters asks for its values, and a server tagged Production asks before a destructive statement. The item is greyed out while the tab is not connected or still runs something.
Read the Profile tab
Section titled “Read the Profile tab”When the run ends, a Profile tab comes forward beside the results.
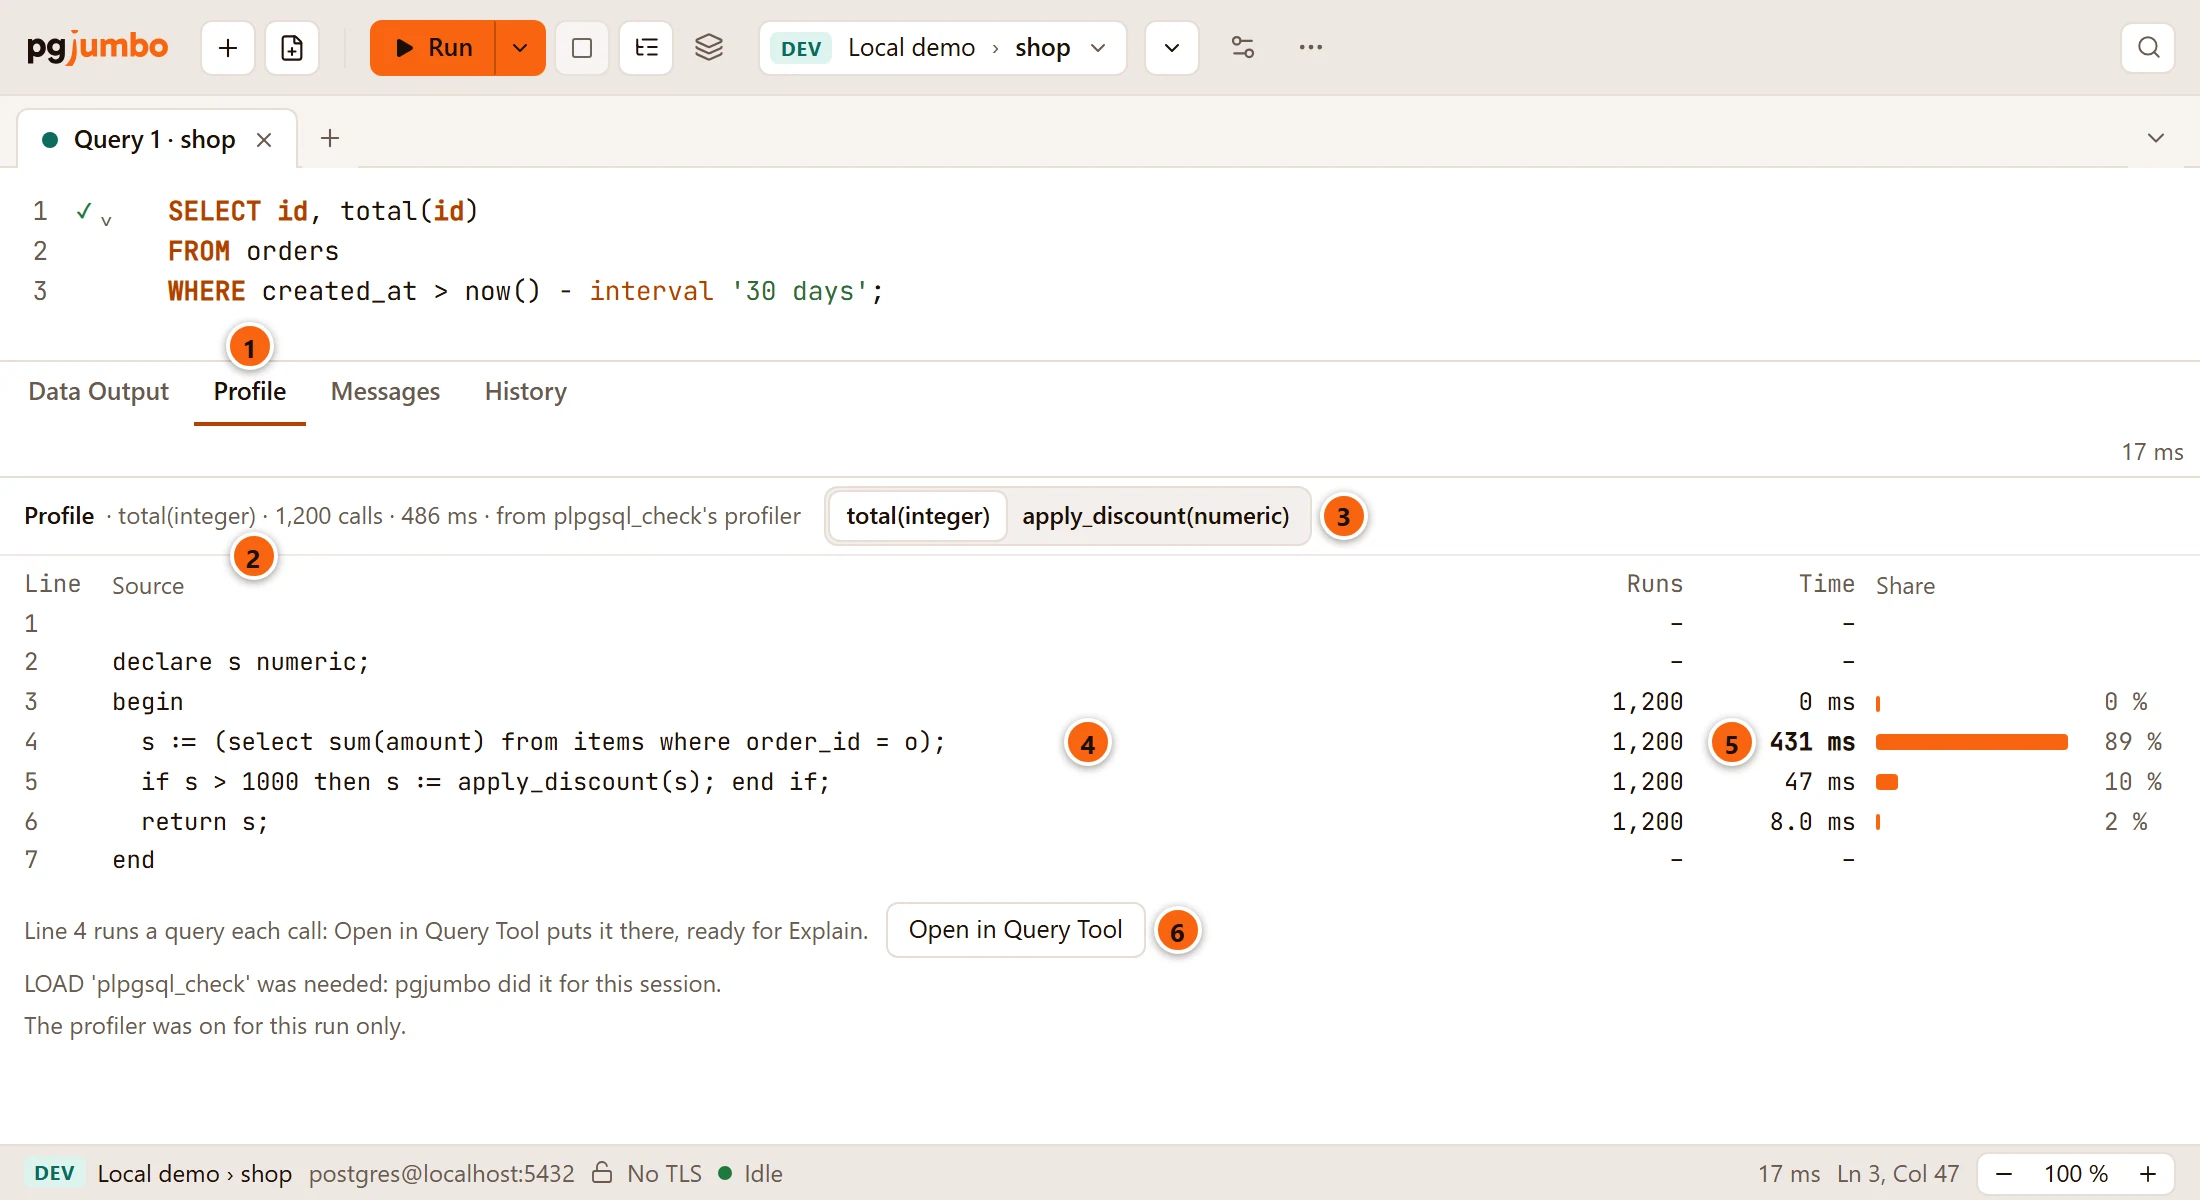
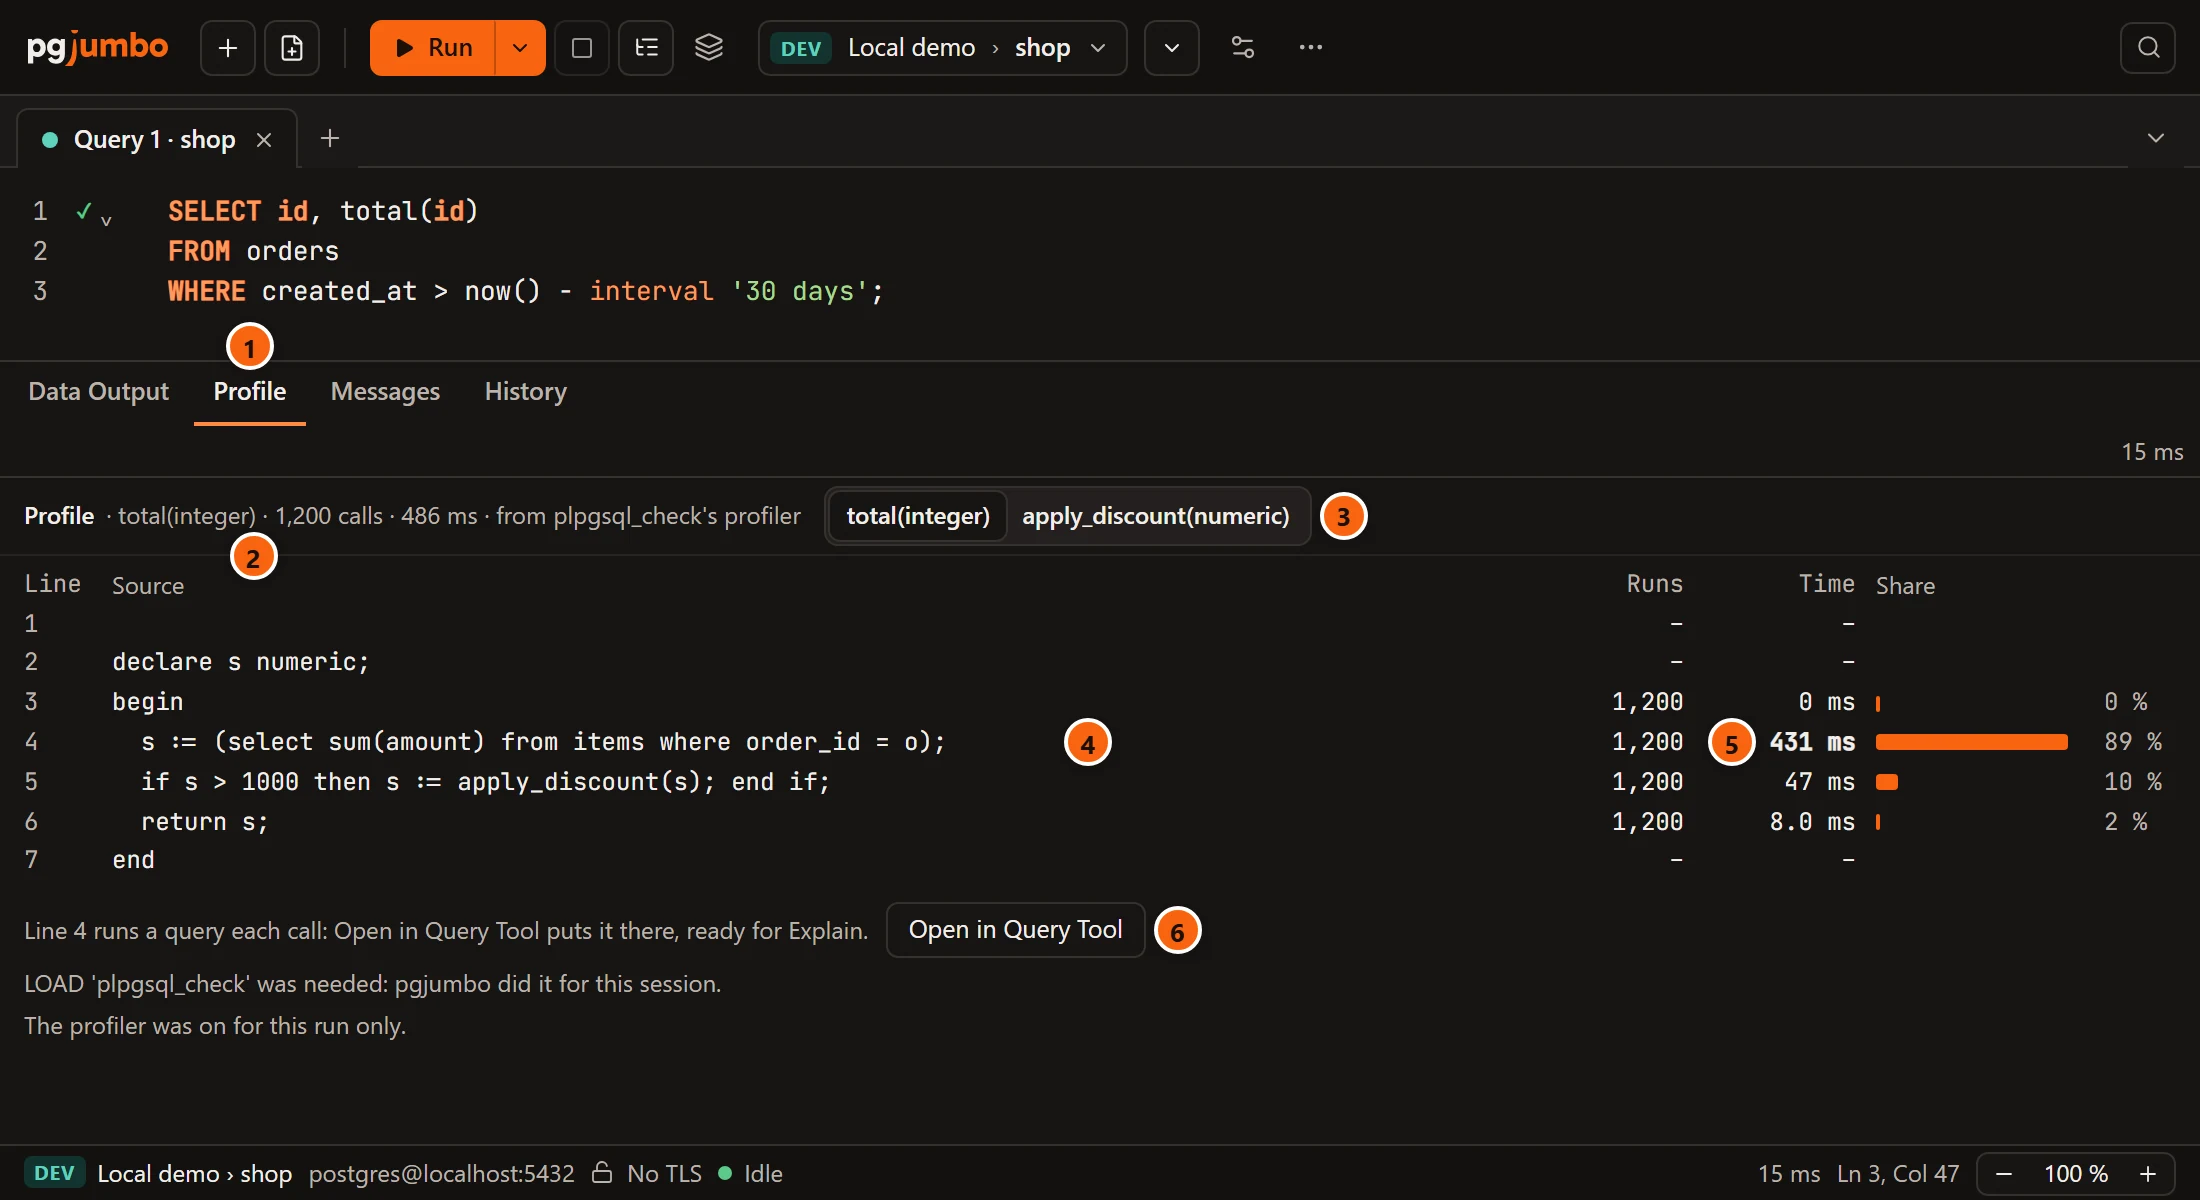
- 1 The Profile tab. It belongs to this run: the next run without the profiler takes it away.
- 2 The function shown, as PostgreSQL writes it with its argument types, how many times the run called it, and the time spent inside it, its own lines and what they called together.
- 3 One button for each function the run called, the slowest first. Click one to see its lines. With one function there is no switch.
- 4 The function’s body, line by line, as PostgreSQL keeps it.
- 5 The line that took the most time has its time in bold.
- 6 Open in Query Tool, when that line runs a query: see Go from a slow line to its query.
The columns:
| Column | What it says |
|---|---|
| Line | The line’s number in the function’s body, from 1. The body starts after the $$ that opens it, so line 1 is often empty. |
| Source | The line’s text on the server. |
| Runs | How often the statement that starts on this line ran. A dash where no statement starts, such as declare or end. |
| Time | The time spent in the line’s statement, over all its runs, not counting the lines inside it (the body of an IF or a loop has lines of its own). |
| Share | The line’s time as a share of the time of all the function’s lines, as a bar and a number. A sliver reads <1 %. |
The lines are the body on the server, never the editor’s text. So Format SQL in the editor does not move them, and
when the editor holds a CREATE FUNCTION of the same name with another body, the tab says “The editor holds a version
of total not created yet: these times are for the one on the server.”
Under the lines, the tab may also say:
| Line | What it means |
|---|---|
| “The profiler was on for this run only.” | Always there: the setting is back as it was. |
| “LOAD ‘plpgsql_check’ was needed: pgjumbo did it for this session.” | The tab’s session had not loaded the extension’s library, so pgjumbo loaded it. Later runs in this tab do not need to. |
| “3 more functions were called; the slowest are listed.” | The run called more than 40 functions. The 40 slowest have a button. |
Go from a slow line to its query
Section titled “Go from a slow line to its query”When the slowest line runs a query, the tab says so, as “Line 4 runs a query each call: Open in Query Tool puts it there, ready for Explain.”
Open in Query Tool opens a new Query Tool tab on the same database with that query, the function’s variables written as parameters:
select sum(amount) from items where order_id = :oNothing runs. Explain it there; it asks for a value for :o first (see
Parameters), and the plan is the plan for that value.
When the run called no function
Section titled “When the run called no function”

- 1 “The run called no PL/pgSQL function, so the profiler measured nothing.” The profiler sees PL/pgSQL only: a function written in SQL or in another language is not listed.
When the database does not have plpgsql_check
Section titled “When the database does not have plpgsql_check”Run with Profiler needs the plpgsql_check extension created in the tab’s database. It is a PostgreSQL extension that checks PL/pgSQL code and profiles it. Where it is missing, the item is not greyed out: it says what it needs, and opens how to add it.


In Run’s ⌄ menu the item reads Run with Profiler…, with “needs plpgsql_check” beside it. In the Query menu it reads Run with Profiler… too. Choosing it runs nothing and opens this dialog:
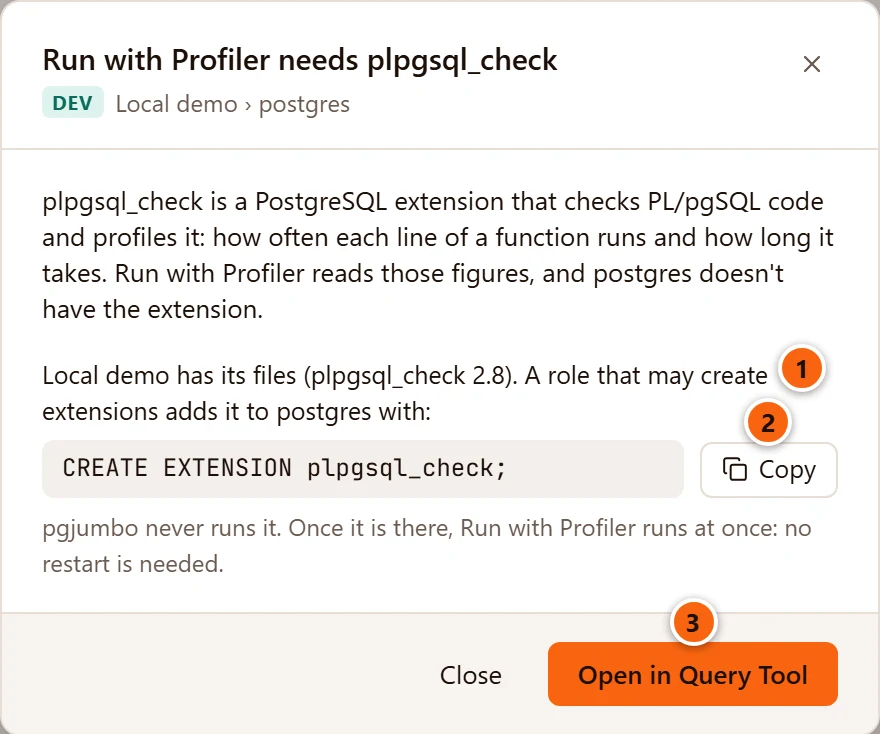
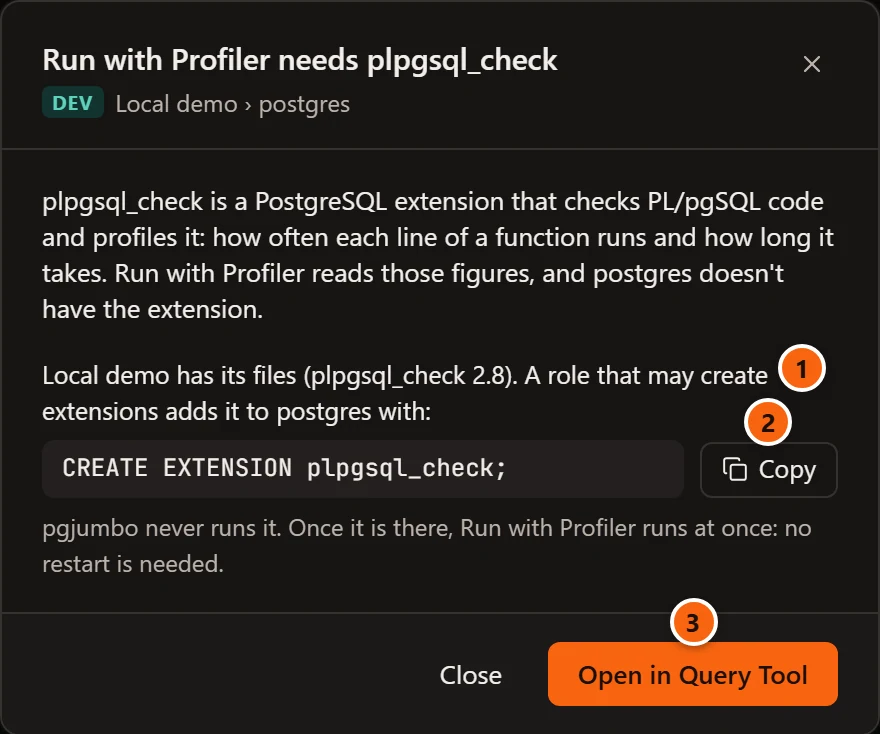
- 1 Whether the server has the extension’s files, and in which version. Under the title are the server and the database the tab is on.
- 2 The one statement that adds it, and Copy, which then reads Copied.
- 3 Open in Query Tool puts the statement in a new Query Tool tab on that database, without running it. Close closes the dialog.
pgjumbo never runs the statement for you. A role that may create extensions runs it. Once the extension is there, Run with Profiler runs at once, with no restart: pgjumbo asks the database again each time you open the menu or choose the item.
When the server does not have the extension’s files, the dialog says so instead: “Local demo doesn’t have its files, so
the extension can’t be added yet. Whoever runs the server installs them first (on Debian and Ubuntu, the package
postgresql-18-plpgsql-check).” The package’s name carries the server’s major version. CREATE EXTENSION would fail
until then, so Open in Query Tool is no longer the main button, and the dialog ends “pgjumbo never runs it, and
installs nothing on the server.”
What the profiler changes, and what it never does
Section titled “What the profiler changes, and what it never does”- The profiler is on for the one run. Its setting goes back to what the tab’s session had, after a run that ended in a failed transaction too.
- pgjumbo reads only plpgsql_check’s own figures. It notes what they hold before the run and shows what the run added. Nothing is reset, so on a server that loads plpgsql_check for every session, where the figures are shared, nobody else loses theirs.
- The run itself is a normal run. What it writes is written; the profiler undoes nothing. To time a write and take it back, run it inside a transaction and roll back (see Transactions).
When it goes wrong
Section titled “When it goes wrong”| Messages or the tab says | What to do |
|---|---|
| “The profiler cannot start inside a failed transaction: roll it back first.” | The tab’s transaction had failed before the run. Click Rollback, then run with the profiler again. |
| “The run ended in a failed transaction, where nothing can be read, so its profile is lost: roll back, then run it with the profiler again.” | A statement of the run failed inside a transaction. Roll back and run again. |
| “The connection was lost, and the profile with it.” | Reconnect the tab and run again. |
| “The profile could not be read:”, then the server’s error | The run is as it was; only the reading failed. The error says why. |
| “Run with Profiler needs the plpgsql_check extension in this database.” | pgjumbo could not ask beforehand, and the run was refused. See When the database does not have plpgsql_check. |