
Health check
The health check looks for the problems that hurt a PostgreSQL database quietly: a replication slot filling the disk, a table nearing transaction ID wraparound, indexes nobody uses, sessions left idle in a transaction. It runs eighteen checks and sorts what it finds into To fix and To look at, with everything that passed under Fine.
The check only reads. Where a finding has a fix, pgjumbo shows the script and opens it in a Query Tool for you to read, change and run yourself. pgjumbo never runs a fix.
Run the health check
Section titled “Run the health check”The health check runs on one database, and lives in the server’s reports tab, under the database picker. The server must be connected. There is no key for it.
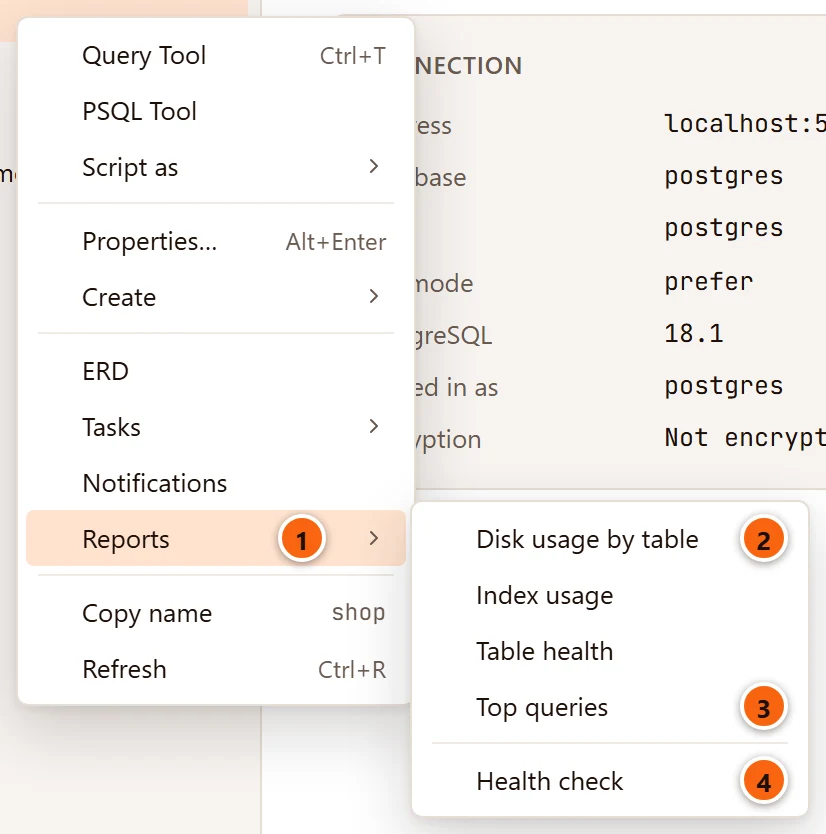
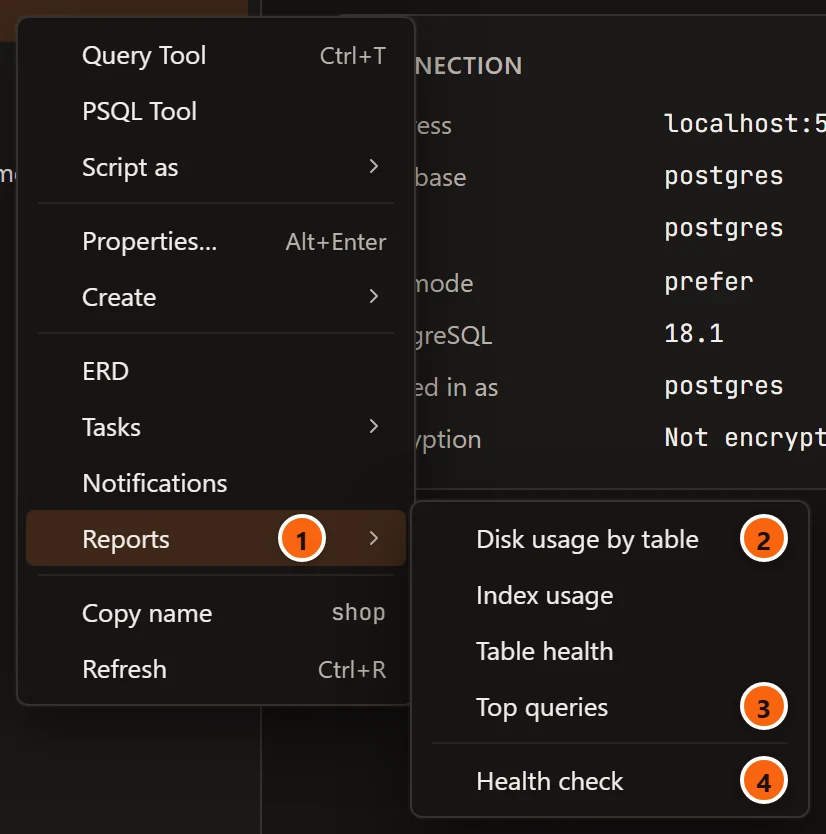
- 1 Right-click a database and point to Reports.
- 2 The database’s reports, which share the tab with the health check.
- 3 Top queries, the server’s report kept to this database.
- 4 Health check opens the reports tab on the health check of this database.
| Where | Which database it checks |
|---|---|
| Right-click a database, ReportsHealth check | That database. |
| ToolsHealth Check with a database selected in the Explorer | That database. |
| ToolsHealth Check with a server selected | The server’s maintenance database (the database its connection names), or, when the server’s reports tab is open already, the database its picker names. The item is greyed out unless a connected server or one of its databases is selected; a table or any other row greys it out too. |
| Management ▸ Health Check under a server in the Explorer: double-click it, press ↩︎ (Enter on Windows and Linux), or right-click it and choose Open | The server’s maintenance database, or, when the server’s reports tab is open already, the database its picker names. |
| Health check on the left of an open reports tab | The database the picker above it names. Choose another database in the picker to check that one. |
Template databases, which the Explorer lists when it shows system objects, have no Reports menu and do not turn on ToolsHealth Check.
The check runs when the tab shows it. While it runs, the tab says Checking shop…, and an error from the server shows in place of the results. When the server is disconnected, the tab says Local demo is not connected. instead.
Read the results
Section titled “Read the results”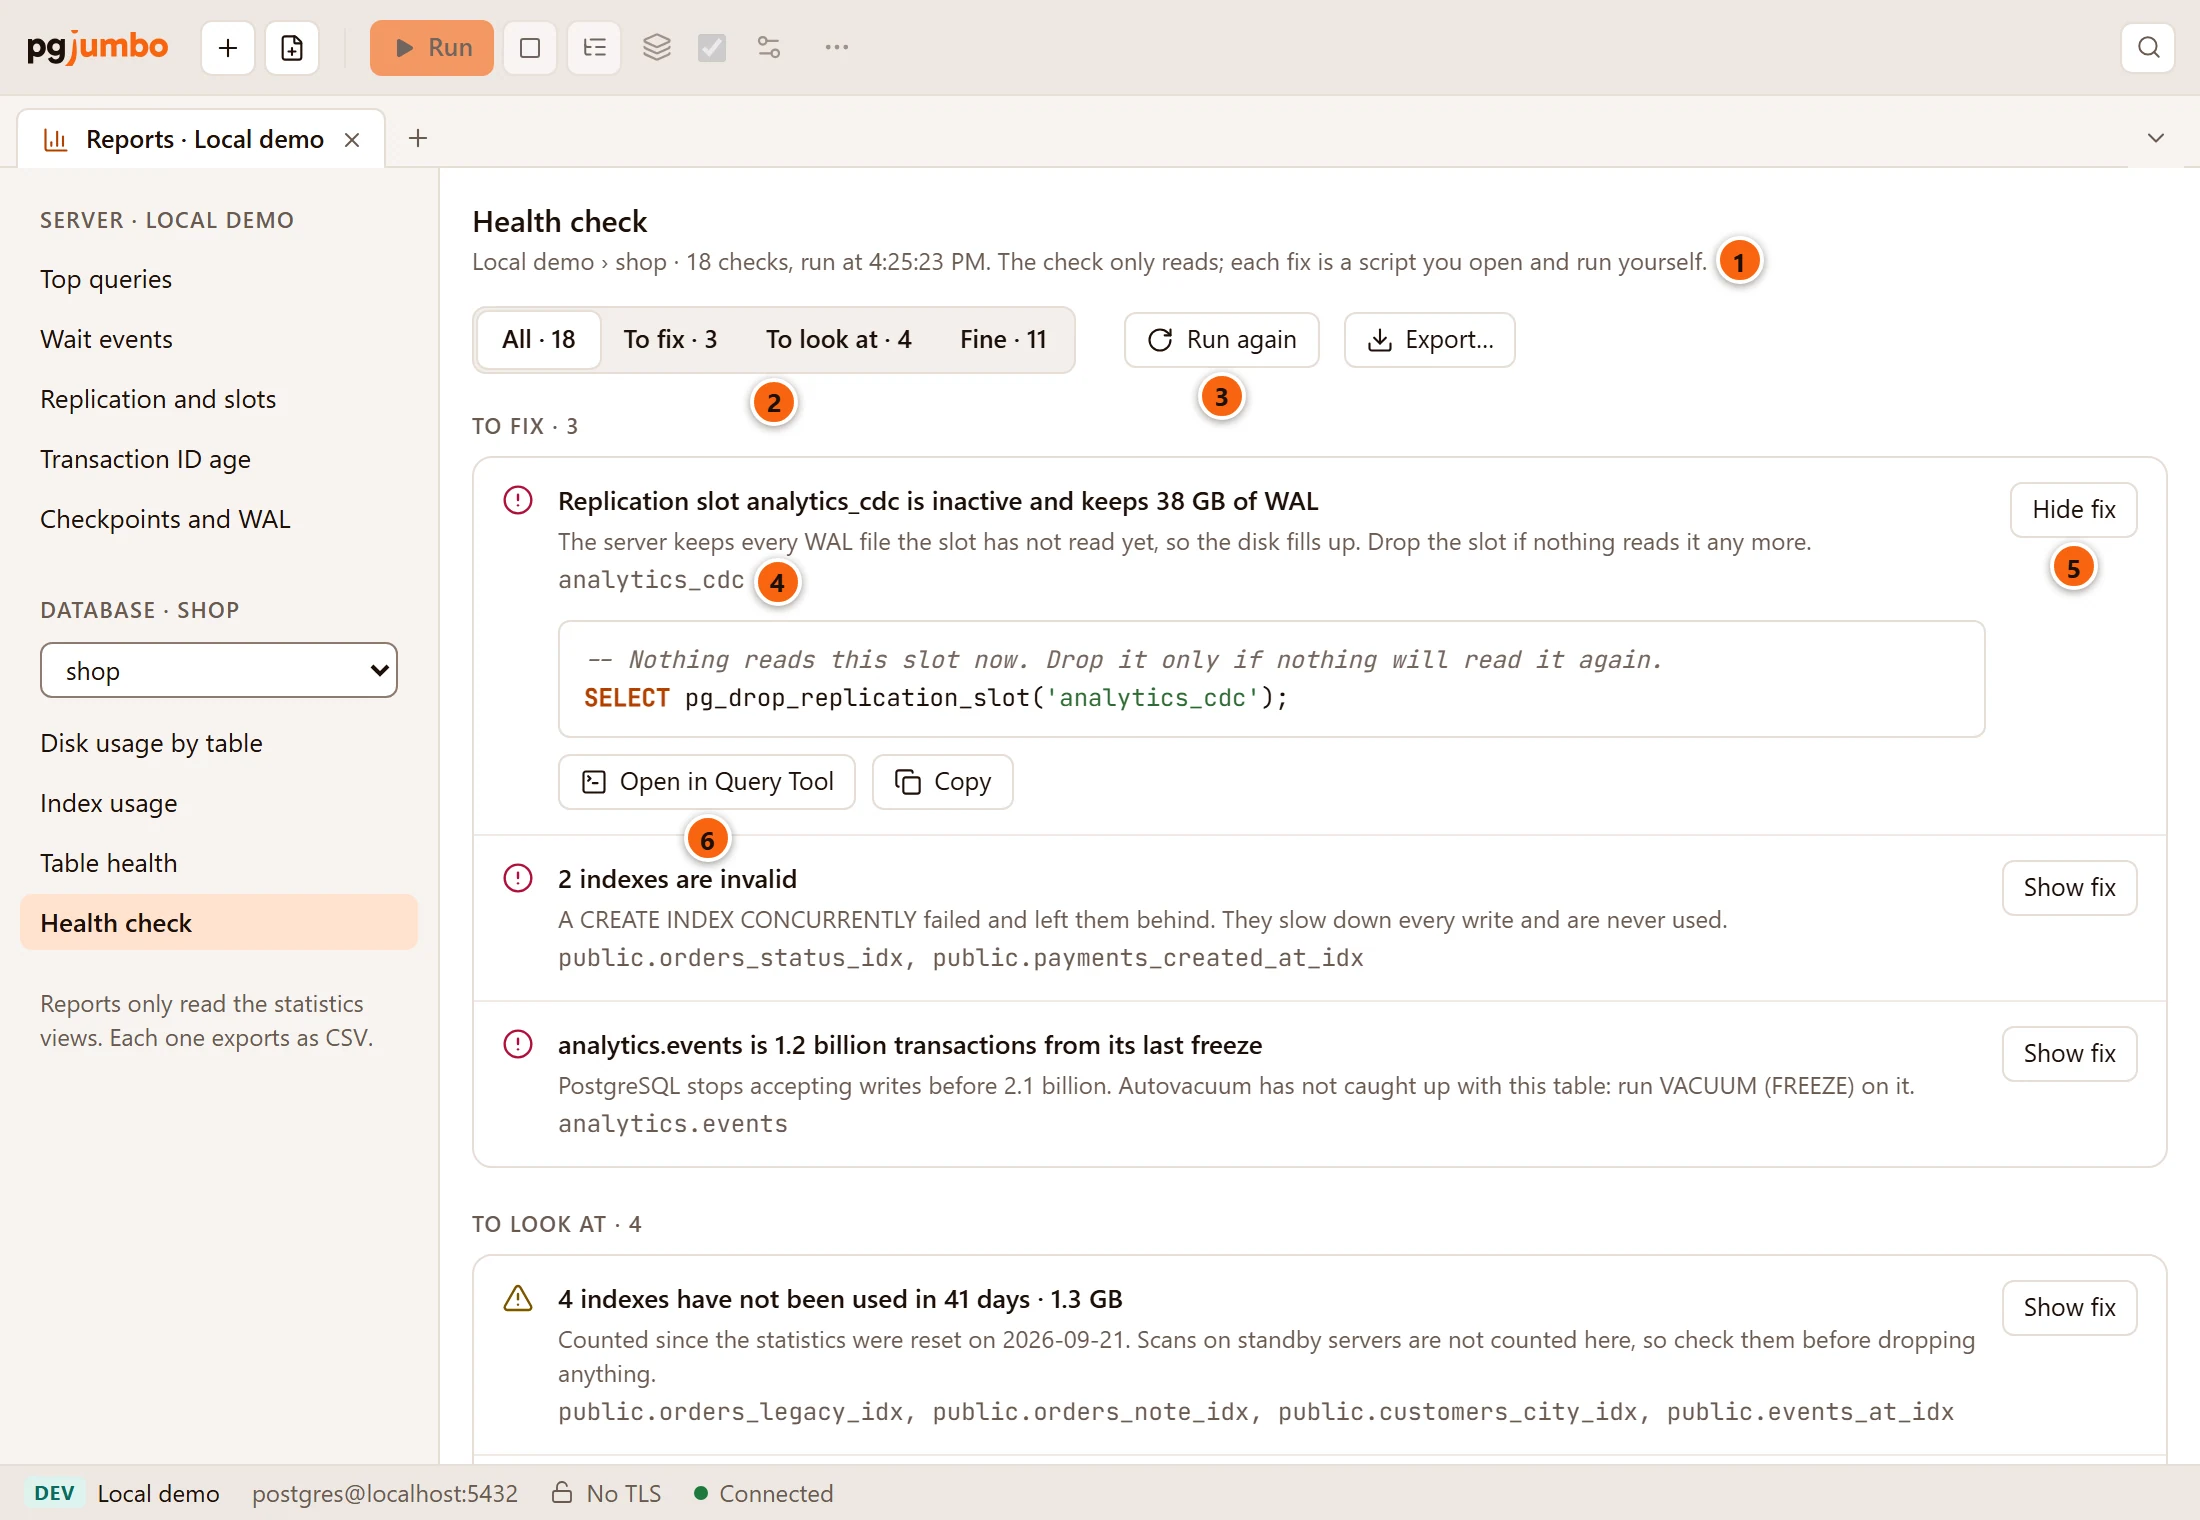
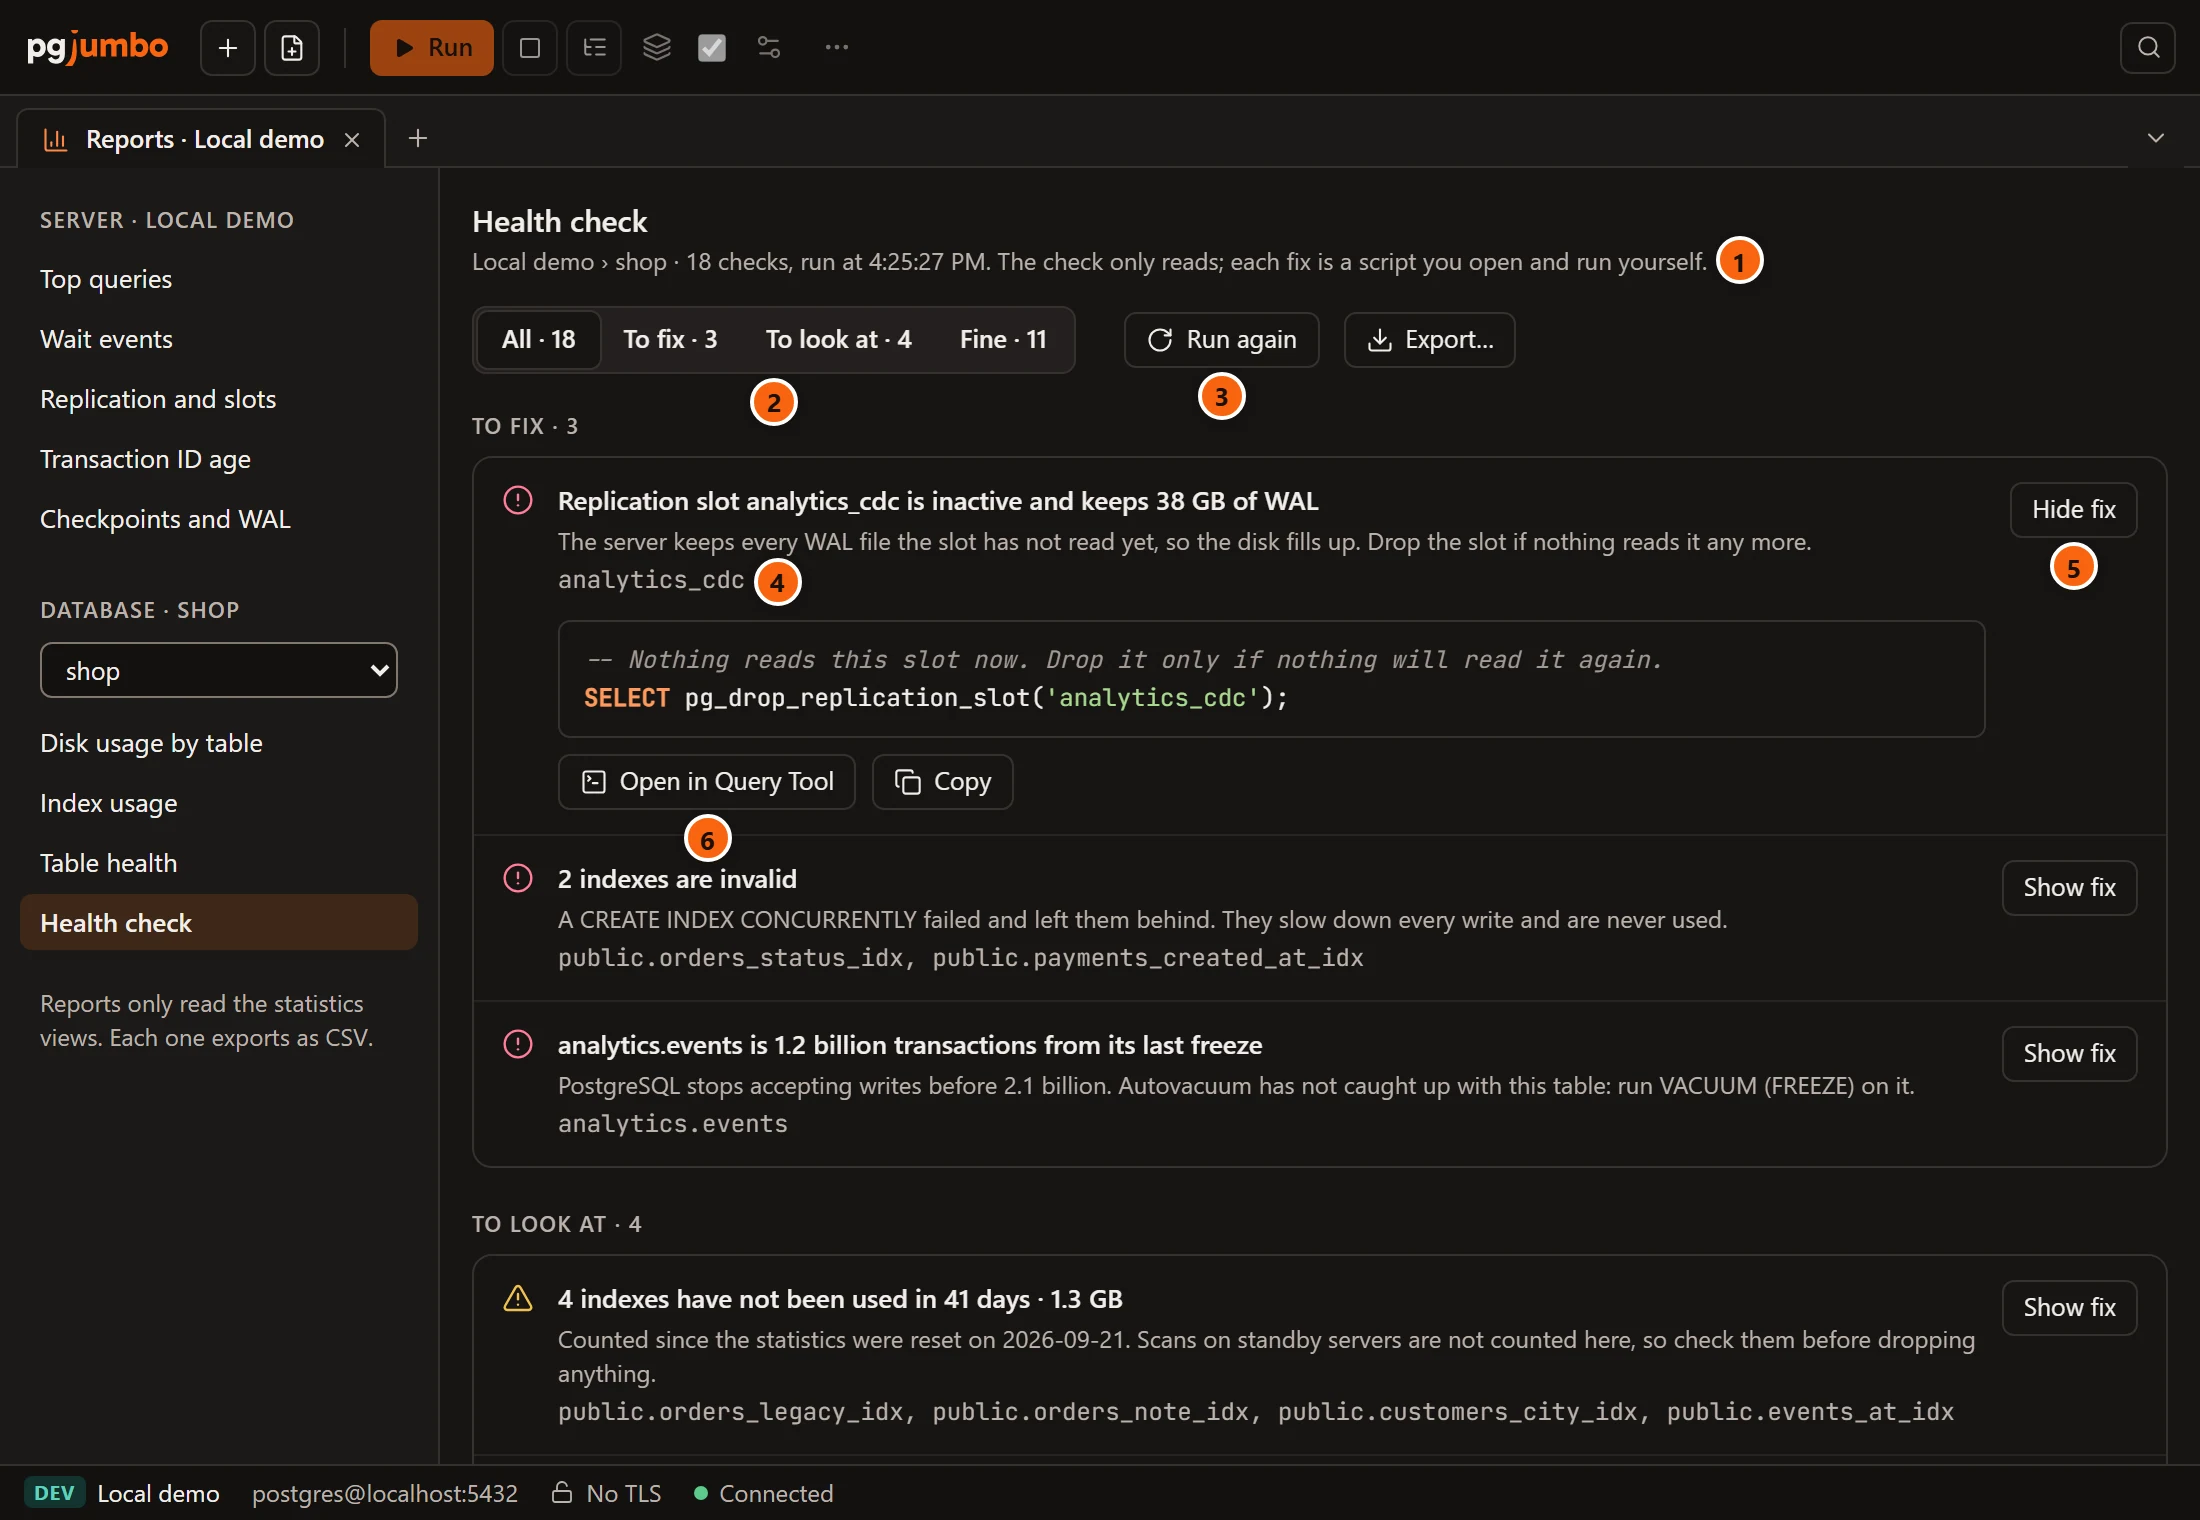
- 1 The server and database checked, how many checks ran and when: Local demo › shop · 18 checks, run at and the time, then The check only reads; each fix is a script you open and run yourself.
- 2 Show All, or only To fix, To look at or Fine. Each button says how many there are.
- 3 Run again runs every check once more, after you fixed something for example; it is greyed out while the check runs. Export… beside it saves the results as CSV.
- 4 Each finding says what is wrong, then why it matters, then the objects it is about in SQL’s own
spelling, here the slot
analytics_cdc. - 5 Hide fix and Show fix close and open the finding’s fix script. The first finding to fix starts open.
- 6 Open in Query Tool puts the script in a new Query Tool tab on the database checked. Copy copies it.
The results come in three groups, the findings To fix first:
| Group | Icon | What it means |
|---|---|---|
| To fix | A red circle with an exclamation mark | Harm is on its way: a disk filling up, writes about to stop, locks that nothing will release. |
| To look at | An amber triangle | Worth a look. It may be fine where it is: an unused index may serve a monthly report, a table without a primary key may be a log. |
| Fine | A tick | The check passed. |
Filter the findings
Section titled “Filter the findings”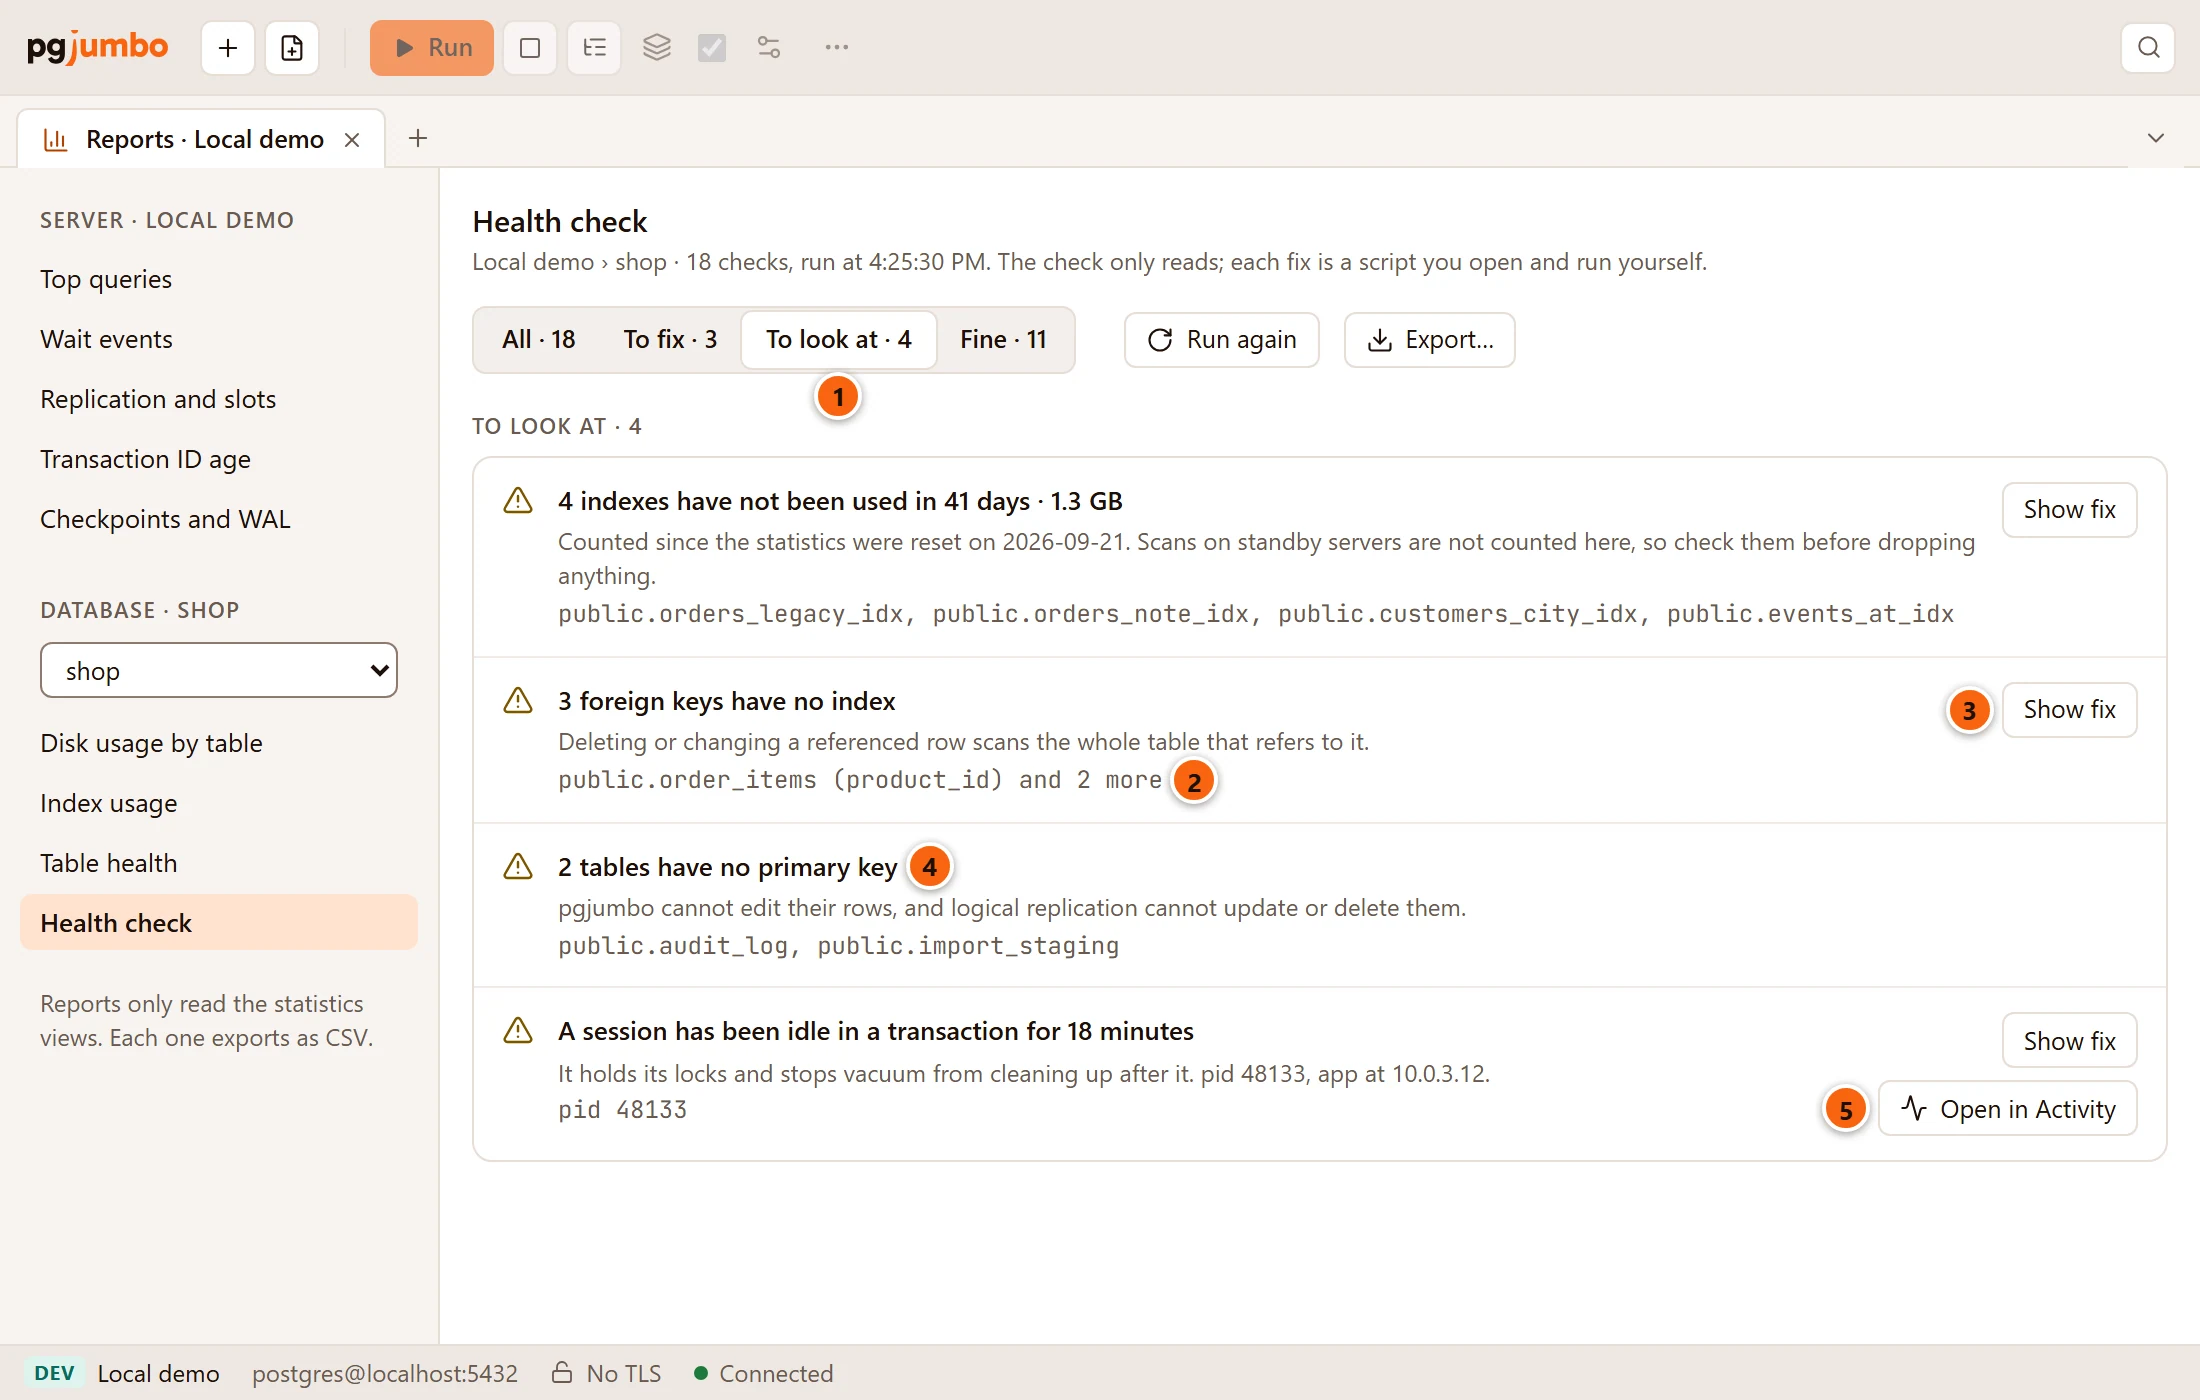
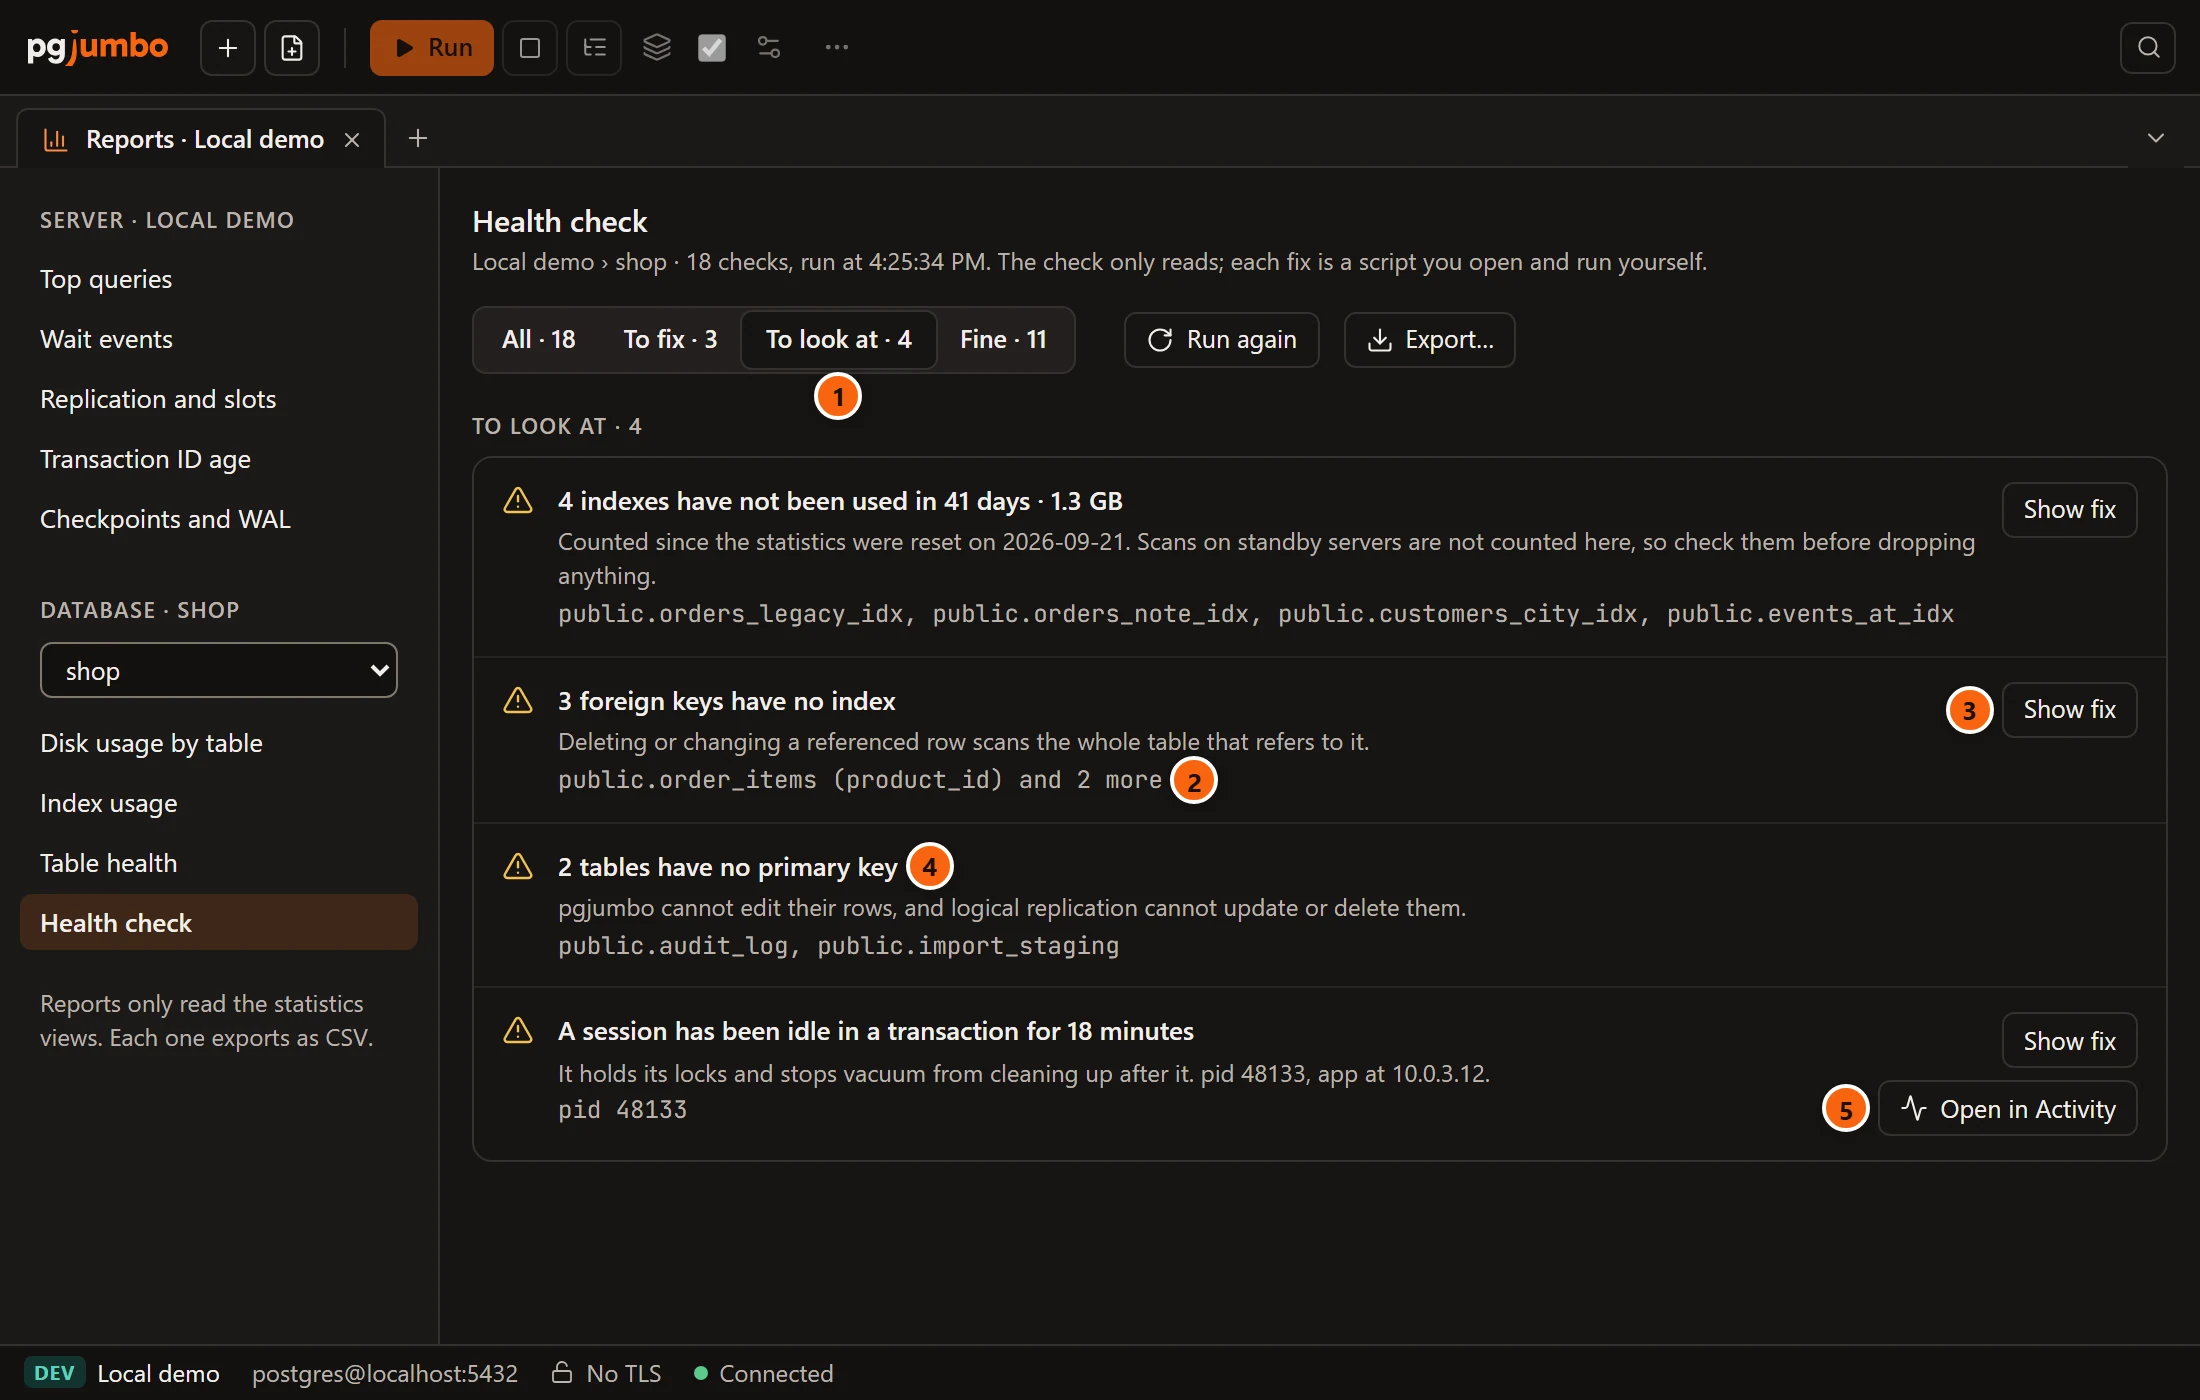
- 1 To look at shows only the findings worth a look. When a filter has nothing, the tab says Nothing to fix. or Nothing to look at.
- 2 A finding names at most twelve objects, then says how many more there are: and 2 more. Its fix script covers all of them, up to 200 statements.
- 3 Show fix opens the script under the finding.
- 4 Some findings have no script, because the fix is a decision only you can make, such as which column becomes a table’s primary key.
- 5 Open in Activity opens the Activity view of the server’s tab, where you can see the sessions a finding is about and cancel or end them.
What was fine
Section titled “What was fine”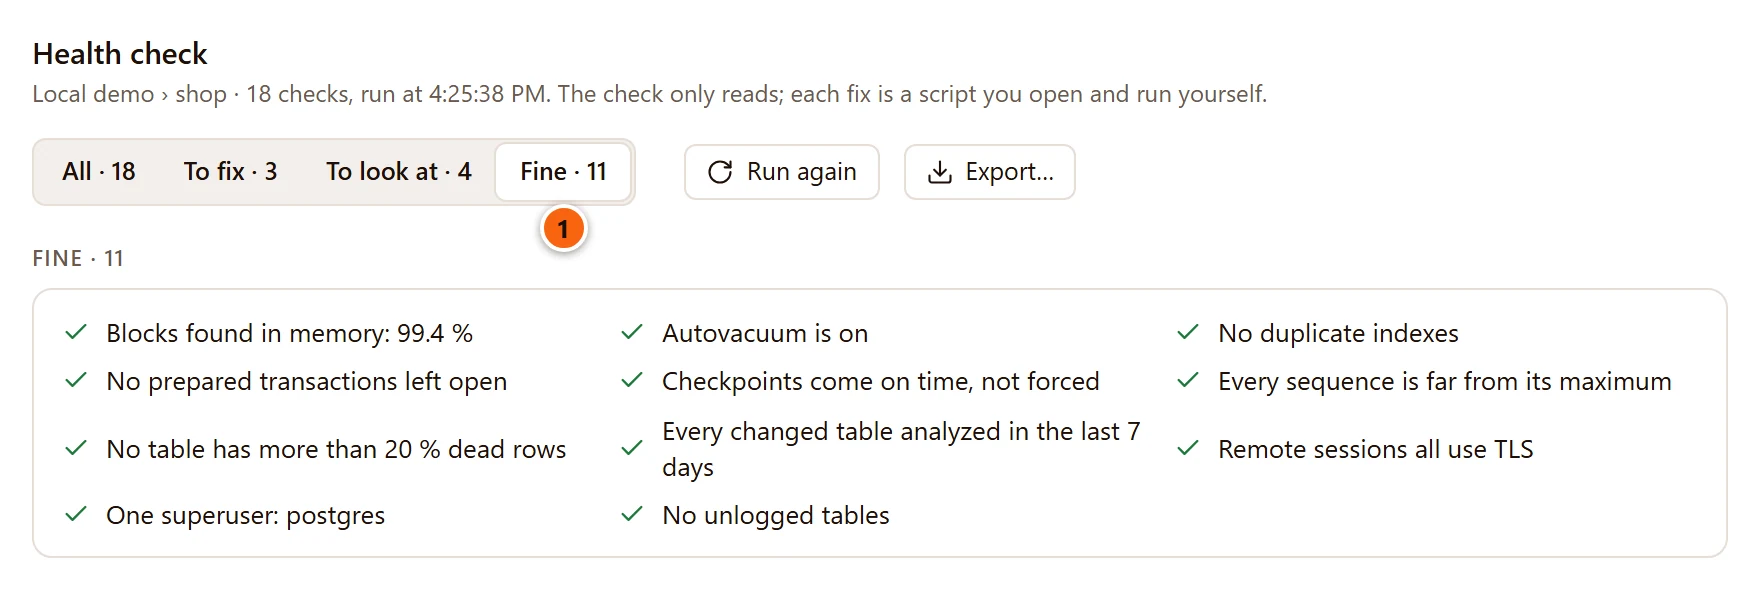
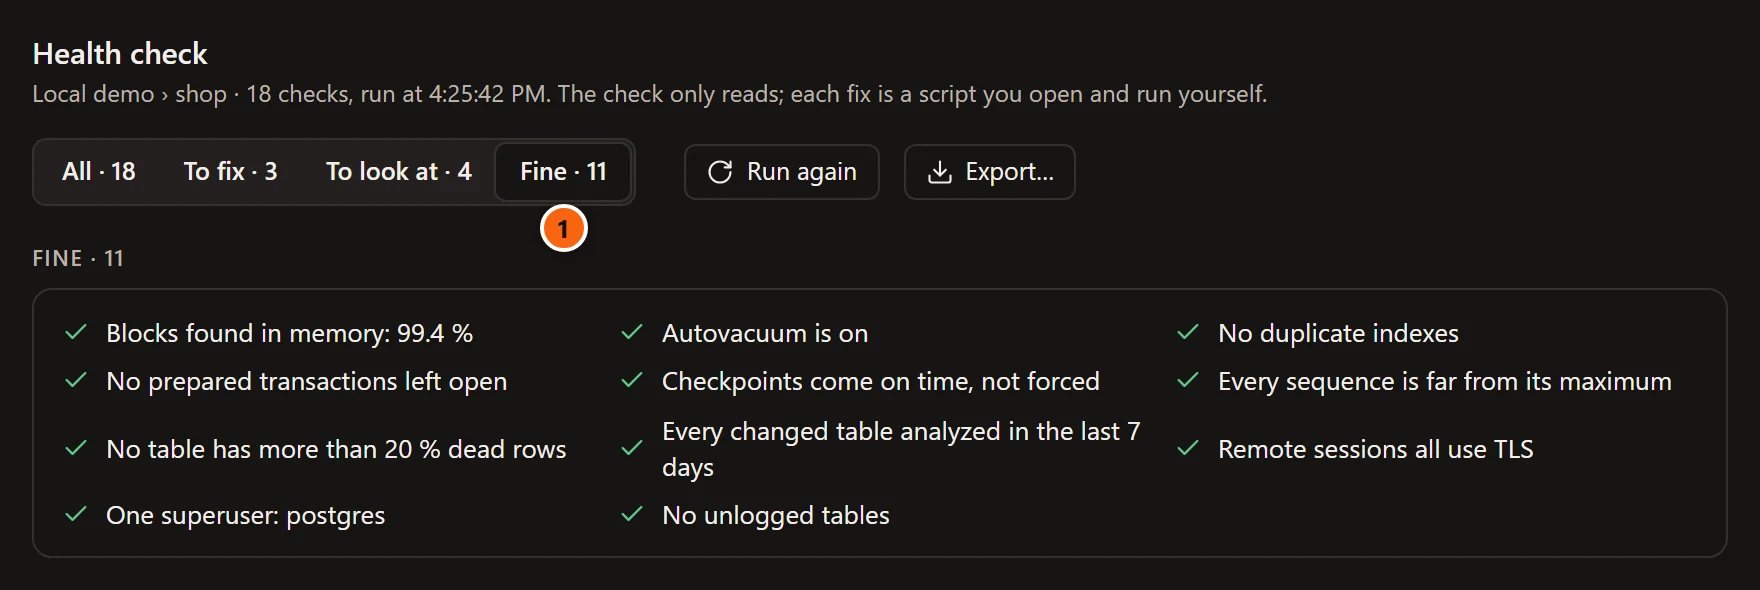
- 1 Fine lists the checks that passed, one line each, such as Autovacuum is on or One superuser: postgres.
Every check
Section titled “Every check”Some checks look at the database checked; others look at the whole server, whichever database you check. Checks on tables and indexes leave out the system schemas.
| Check | What it looks at | Group | Fix script | When fine |
|---|---|---|---|---|
| Replication slots | Slots nothing reads now (server). One that keeps 1 GB of WAL or more is a finding of its own: Replication slot … is inactive and keeps … of WAL. Smaller ones share one finding: 2 replication slots are inactive. | To fix from 1 GB of WAL, else To look at | SELECT pg_drop_replication_slot('name'); |
Every replication slot is in use |
| Invalid indexes | Indexes a failed CREATE INDEX CONCURRENTLY left behind. |
To fix | REINDEX INDEX CONCURRENTLY for each |
No invalid indexes |
| Transaction ID wraparound | Tables whose oldest unfrozen transaction ID is more than 500 million transactions old. One that is 1 billion or more is a finding of its own; the others share one. | To fix from 1 billion, else To look at | VACUUM (FREEZE, VERBOSE) for each |
Every table is far from transaction ID wraparound |
| Unused indexes | Indexes never scanned since the database’s statistics were reset (or since the server started), with their size. Primary keys, unique indexes, indexes a constraint uses and invalid ones are left out. Standby servers count their own scans. | To look at | DROP INDEX CONCURRENTLY for each |
Every index has been used |
| Foreign keys without an index | Foreign keys whose columns do not lead any index on the referencing table. | To look at | CREATE INDEX CONCURRENTLY ON table (columns); for each |
Every foreign key has an index |
| Tables without a primary key | Tables and partitioned tables (not their partitions) with no primary key. pgjumbo cannot edit their rows, and logical replication cannot update or delete them. | To look at | None | Every table has a primary key |
| Sessions idle in a transaction | Sessions idle in a transaction for more than five minutes (server). They hold their locks and stop vacuum from cleaning up. The finding offers Open in Activity. | To look at | SELECT pg_terminate_backend(pid); for each |
No session is idle in a transaction |
| Blocks found in memory | The share of the database’s blocks found in shared buffers. A finding below 90 %. | To look at | None | Blocks found in memory: and the share, such as 99.4 %, or Blocks found in memory: not counted yet while the statistics have counted no block |
| Autovacuum | Whether autovacuum and track_counts are on (server). |
To fix | ALTER SYSTEM SET autovacuum = on; (or track_counts) and SELECT pg_reload_conf(); |
Autovacuum is on |
| Duplicate indexes | Indexes on the same table with the same columns, expressions, operator classes and condition. The one no constraint uses is the copy to drop. | To look at | DROP INDEX CONCURRENTLY for each copy |
No duplicate indexes |
| Prepared transactions | Prepared transactions open for more than five minutes (server). They hold locks even across a restart. | To fix | ROLLBACK PREPARED 'name';, with the database each must run in |
No prepared transactions left open |
| Forced checkpoints | Whether at least half of the checkpoints were asked for early, once there have been ten (server). The finding names max_wal_size. |
To look at | None; change max_wal_size in Configuration |
Checkpoints come on time, not forced |
| Sequences near their maximum | Sequences that have used more than 75 % of their range, one finding each. | To fix from 90 %, else To look at | None; switch the sequence and its column to bigint (see Sequences) |
Every sequence is far from its maximum |
| Dead rows | Tables with at least 1,000 dead rows that are more than 20 % of their rows. | To look at | VACUUM (ANALYZE) for each |
No table has more than 20 % dead rows |
| Stale statistics | Tables with at least 1,000 rows changed since they were last analysed, and not analysed in 7 days. | To look at | ANALYZE for each |
Every changed table analyzed in the last 7 days |
| Remote sessions without TLS | Client sessions from other machines that do not use TLS (server). The finding offers Open in Activity. | To look at | None; hostssl lines in pg_hba.conf can require it (see the Authentication view of the server’s tab) |
Remote sessions all use TLS |
| Superusers | Roles that are superusers and can log in (server). A finding when there is more than one. | To look at | None | One superuser: postgres, or No superuser can log in |
| Unlogged tables | Unlogged tables: emptied after a crash and not copied to standbys. | To look at | None | No unlogged tables |
Fix scripts
Section titled “Fix scripts”A fix script starts with a comment that says what it does, then holds one statement a line, one for each object of the finding. A script stops after 200 statements and ends with a comment saying how many more there would be. Names in it come quoted by the server.
Nothing runs from the health check. Open in Query Tool opens the script in a new Query Tool tab on the database checked. Read it there, change what you need, and run it yourself. The usual rules of a Query Tool apply, among them the confirmation on a Production server. Copy puts it on the clipboard instead.
A few scripts need care beyond that:
REINDEX INDEX CONCURRENTLY,CREATE INDEX CONCURRENTLY,DROP INDEX CONCURRENTLY,VACUUMandALTER SYSTEMcannot run inside a transaction block. Run them with auto-commit on; see Auto-commit.VACUUM (FREEZE)reads the whole table.- Each
ROLLBACK PREPAREDline names the database it must run in, as a comment. Change the tab’s database to that one before you run it. ALTER SYSTEMchanges the whole server and needs a superuser, or from PostgreSQL 15 a role grantedALTER SYSTEMon that setting. The script reloads the configuration after it.pg_terminate_backendends another role’s session only for a superuser or a member ofpg_signal_backend, and only a superuser can end a superuser’s session.
Click Run again once you have run a fix, to see the finding go.
Export the results
Section titled “Export the results”Export… saves the results as a CSV file. Your system’s Save dialog opens on a name such as
Local demo shop health check.csv. The file has the columns Level, Finding, Details, Objects and
Fix: one line for each finding, with its level, title, explanation, objects and script, then one line for each
check that was fine, with only its level and line. The tab then says Saved to and the file’s path.
Ask what to fix first
Section titled “Ask what to fix first”When the Assistant is turned on and the server is connected, the bar has Ask what to fix first. It opens the Assistant pane and asks which findings to fix first, and how. It is greyed out when there are no findings. See Ask the Assistant.