
The Inspector
The Inspector is the pane on the right of the window. It shows the object you select in the Explorer: what it is, the script that creates it, how much it is used and what depends on it. It only reads. The one button in it that changes something on the server is Reset statistics…, and that asks first.
What the Inspector shows
Section titled “What the Inspector shows”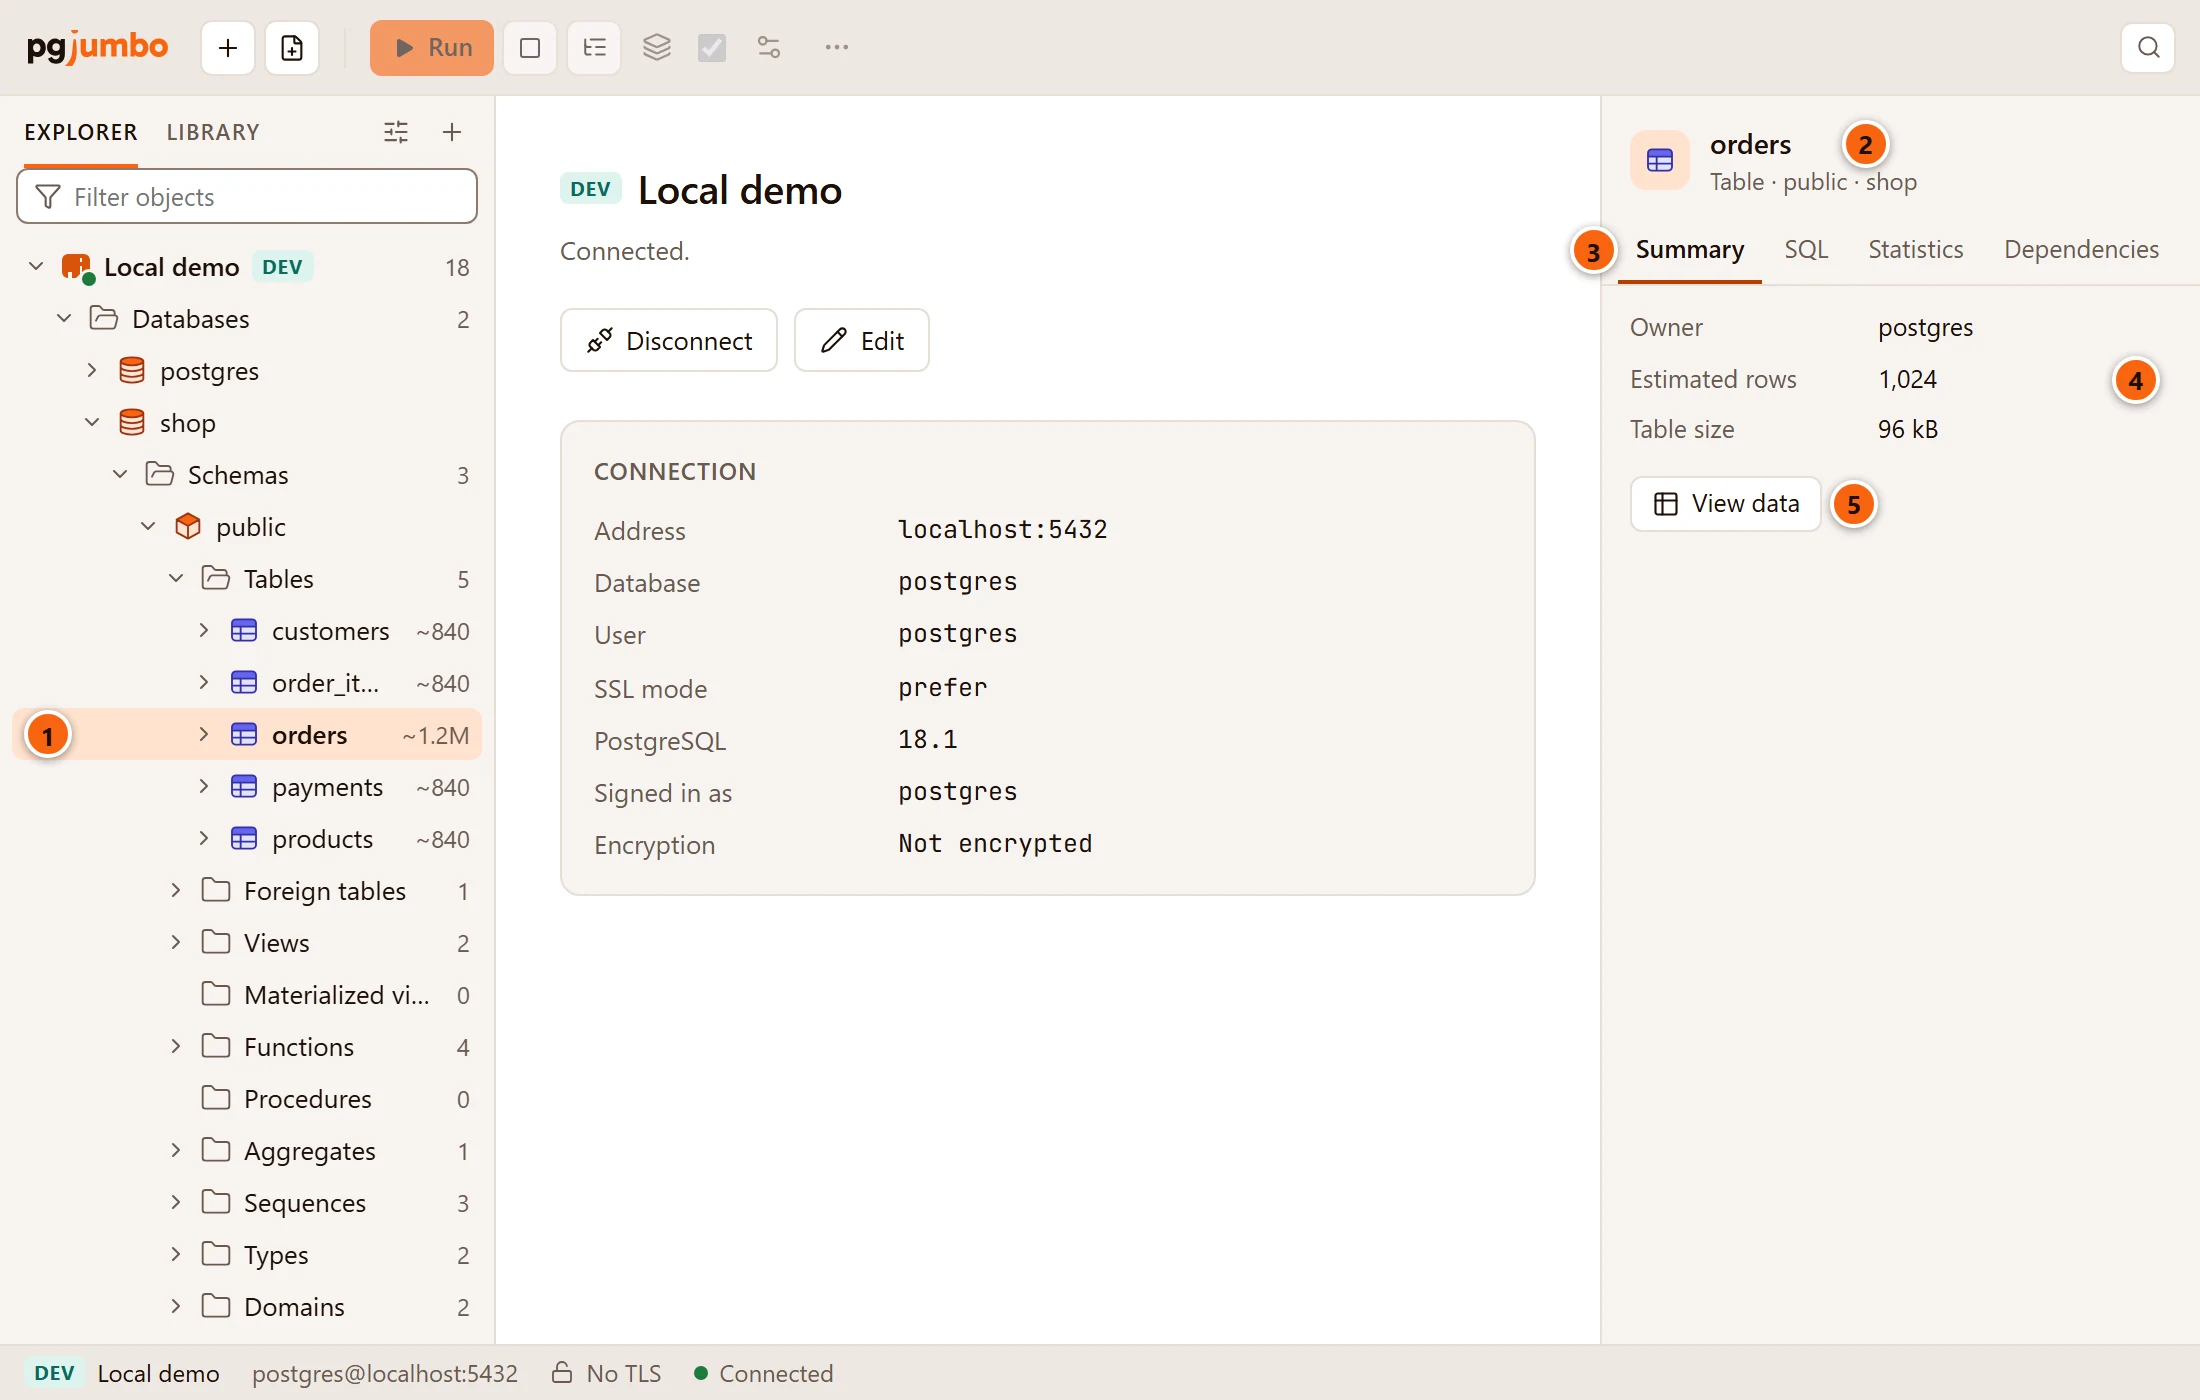
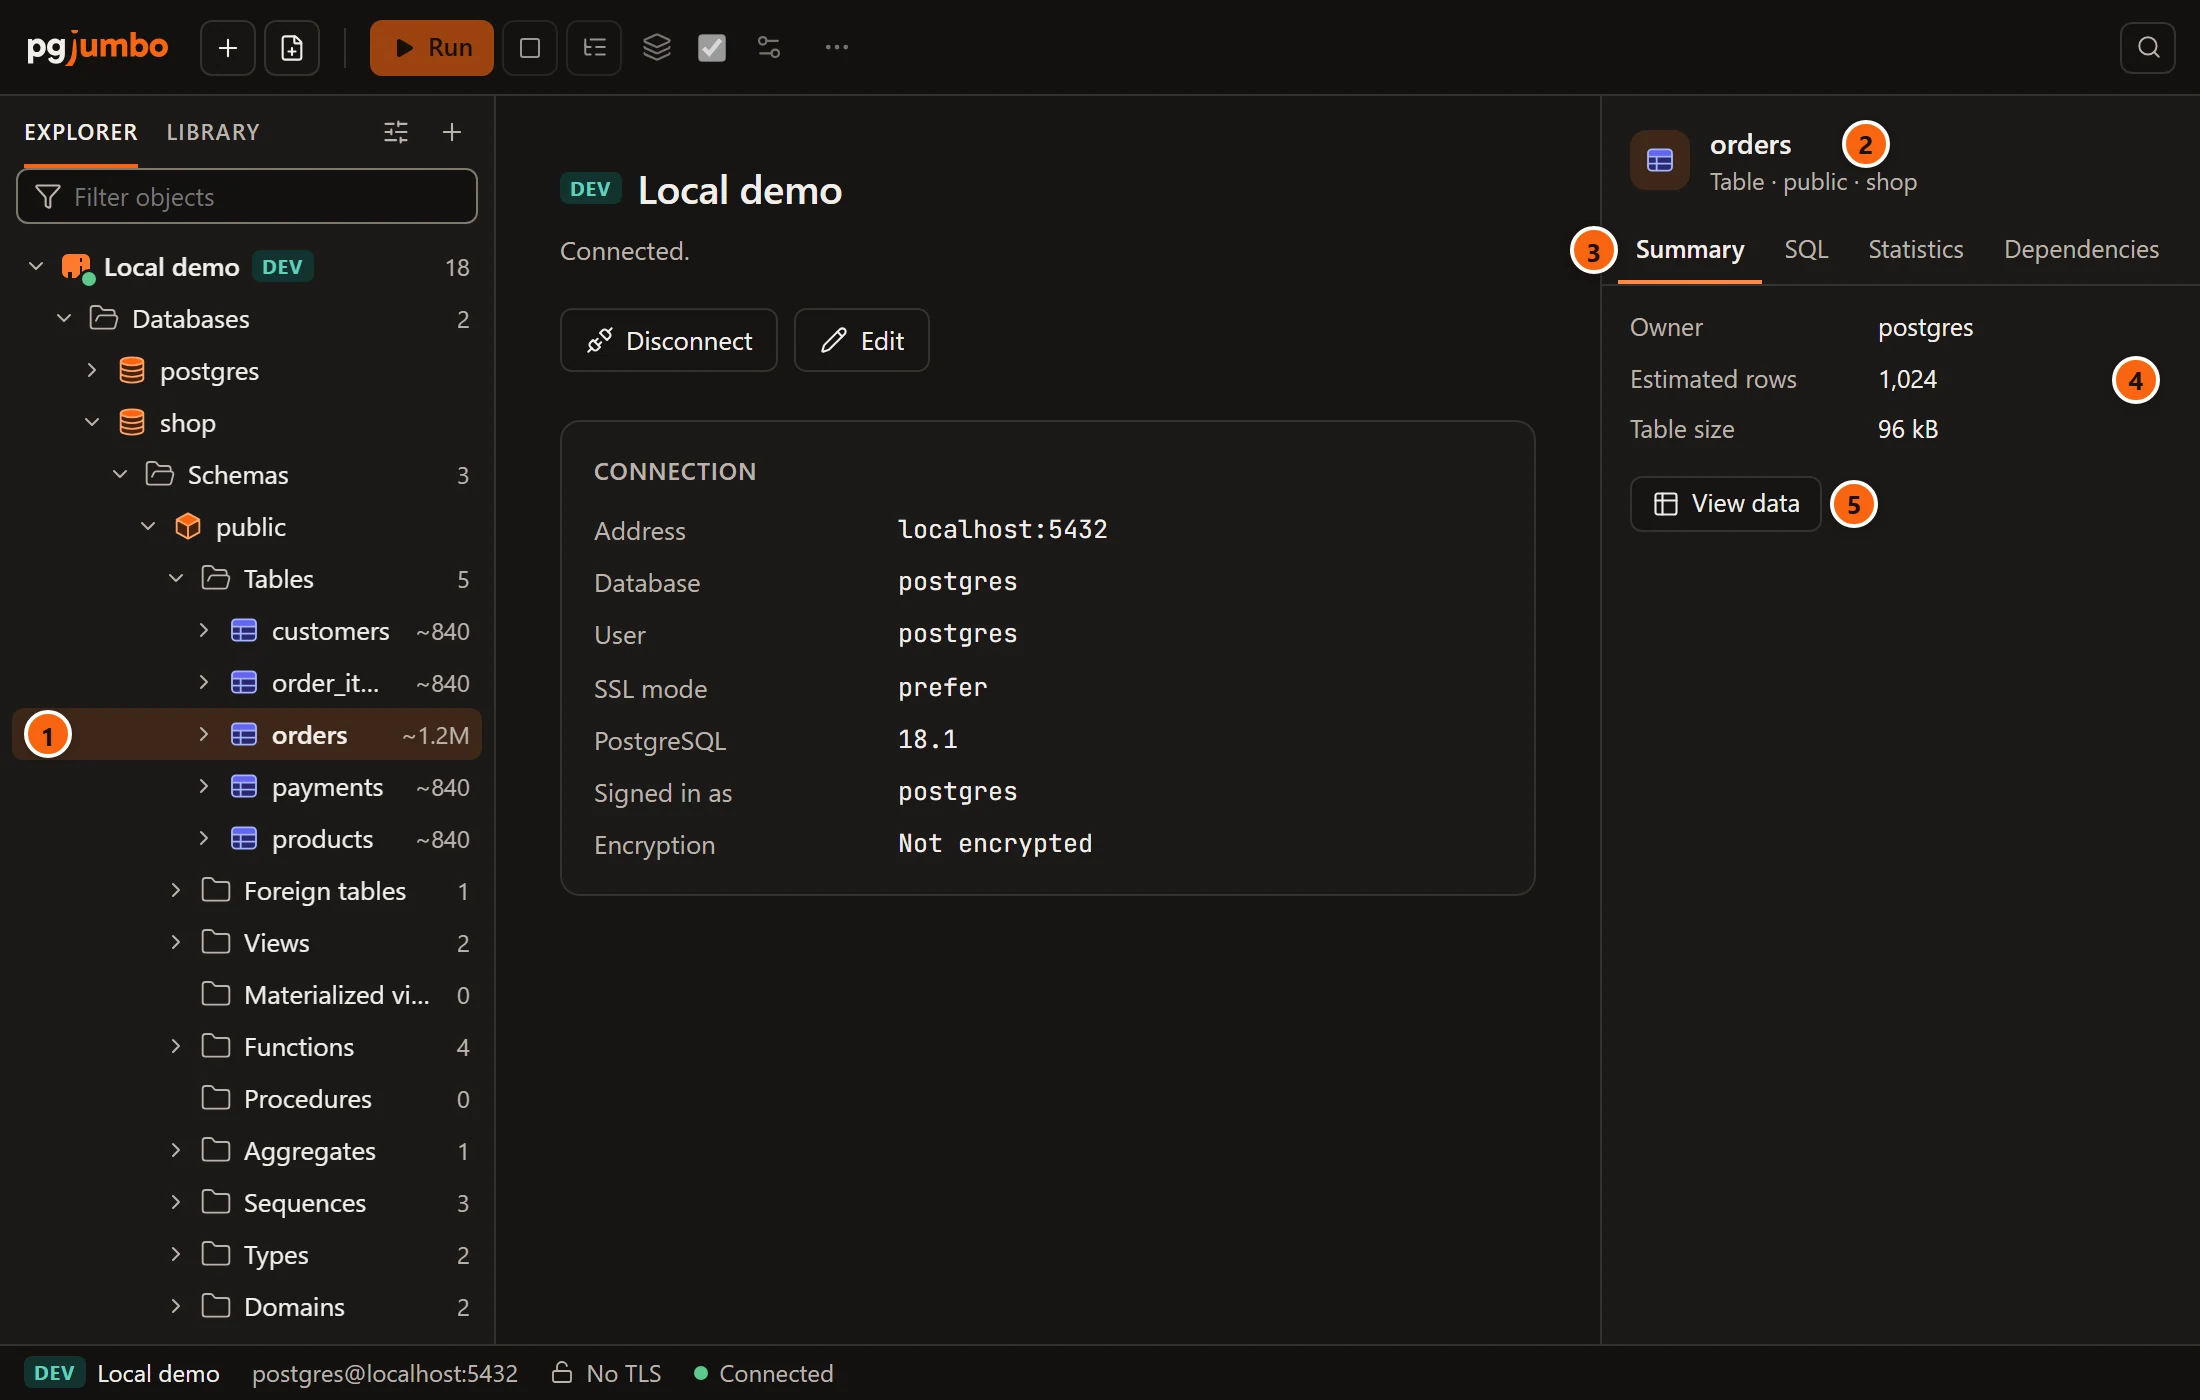
- 1 The Inspector follows what you select in the Explorer. Click a table, a function, an index or any other object, and the pane shows it.
- 2 The header: the object’s icon and name, then its kind and where it lives.
Table · public · shopis the kind, the schema and the database. - 3 The views. Summary and SQL are there for every object; Statistics and Dependencies only for the kinds that have them (see Statistics and Dependencies).
- 4 The object’s properties, read from the server’s catalog.
- 5 View data shows the rows of a table, a partitioned table, a view, a materialized view or a foreign table. A table, a partitioned table, a view or a materialized view opens in its own tab on the Data view; a foreign table opens in a data tab. See View data. If the rows cannot be shown, a message titled The data could not be shown says why.
The view you chose last stays chosen: select another object and the Inspector opens on that view if the object has it, or on Summary if it does not. pgjumbo keeps the choice between runs.
Three other things put an object in the Inspector besides the Explorer’s selection:
- choosing a row in Object Details, with a click or the arrow keys;
- Open beside an object on the Dependencies view;
- choosing a column in a table tab, which shows that column’s summary.
Each lasts until you select something else in the Explorer.
When there is nothing to show
Section titled “When there is nothing to show”| What is selected | What the Inspector says |
|---|---|
| Nothing, a server, a group, or an object on a server that is not connected | Select an object in the Explorer to see its properties and SQL. |
| A folder, such as Tables or Security | The folder’s name, then how many objects it holds: 5 objects. Open the folder in the Explorer to see them. A tool under Management, such as Activity, shows the same line with 0 objects. |
| An object dropped since the tree was read | In red: This object no longer exists. Refresh the tree. |
While the server answers, a view says Loading…. When the server returns an error, the view shows its message in red.
Show and hide the Inspector
Section titled “Show and hide the Inspector”Choose ViewInspector, or press ⌥ ⌘ 0 (Ctrl+Shift+B on Windows and Linux). The menu item is ticked while the pane is shown. Hiding the Inspector gives the centre of the window more room. pgjumbo remembers whether it is shown between runs.
Properties brings the Inspector back too. It is ⌘ I (Alt+Enter on Windows and Linux), the ObjectProperties menu item, and Properties… on the Explorer’s right-click menus; it is greyed out unless the Inspector has an object to show. For an object with a tab of its own, such as a table, a view, a function or a role, Properties opens that tab instead, a table’s on its Settings view (see Object tabs and review). For any other object, such as a column, an index, a constraint or a trigger, it shows the Inspector on Summary with the keyboard there.
To change the pane’s width, drag its left edge. It is 300 pixels wide at first and can be from 240 to 720. With the edge focused, ← widens it and → narrows it, 16 pixels at a time, and Home and End jump to the narrowest and the widest. pgjumbo keeps the width between runs.
Summary
Section titled “Summary”Summary lists the object’s properties. If the object has a comment (COMMENT ON), it comes first, above the list.
A property the object does not have, such as Partition of on a table that is not a partition, is left out. Sizes
are rounded the way pg_size_pretty rounds them (8192 bytes, 96 kB, 416 MB), and true or false reads yes or
no. Estimated rows says not analyzed yet for a table PostgreSQL 14 or later has never analyzed (PostgreSQL 12
and 13 say 0), and a connection limit of -1 reads no limit. Code-like values, such as types, definitions and
OIDs, are in the monospace font.
| Kind | What Summary lists |
|---|---|
| Database | Owner, Encoding, Collation, Character type, Tablespace, Connection limit, Allows connections, Template, Size, OID |
| Schema | Owner, OID |
| Table, partitioned table | Owner, Persistence, Partitioned by, Partition of, Bounds, Tablespace, Estimated rows, Table size, Total size, Row-level security, OID |
| View | Owner, OID |
| Materialized view | Owner, Populated, Tablespace, Estimated rows, Size, Total size, OID |
| Foreign table | Owner, Server, Options, OID |
| Function, procedure | Owner, Language, Arguments, Returns, Volatility, Strict, Security definer, Parallel, Cost, Rows, OID |
| Sequence | Owner, Data type, Start, Increment, Minimum, Maximum, Cache, Cycles, Last value, Owned by, OID |
| Type | Owner, Category, Values (an enum’s labels), Subtype (a range’s), Attributes (a composite type’s), OID |
| Column | Position, Type, Not null, Default, Identity, Generated as, Collation |
| Constraint | Type, Definition, Deferrable, Initially deferred, Validated, OID |
| Index | Method, Unique, Primary key, Constraint, Valid, Size, Definition, OID |
| Trigger | Enabled, Function, Definition, OID |
| Row security policy | Table, Command, Kind, Roles, Using, With check, OID |
| Rule | On, Event, Instead, Enabled, OID |
| Domain | Owner, Based on, Default, Not null, Collation, Checks, OID |
| Collation | Owner, Provider, Locale, LC_COLLATE, LC_CTYPE, ICU rules, Deterministic, Version, OID |
| Aggregate | Owner, Arguments, Returns, Kind, State function, State type, Final function, Combine function, Initial state, Parallel, OID |
| Operator | Owner, Left argument, Right argument, Returns, Function, Commutator, Negator, Restriction estimator, Join estimator, Hash joins, Merge joins, OID |
| Text search configuration | Owner, Parser, Mappings, OID |
| Text search dictionary | Owner, Template, Options, OID |
| Text search parser | Start, Get token, End, Token types, Headline, OID |
| Text search template | Init, Lexize, OID |
| Role | Can log in, Superuser, Can create databases, Can create roles, Inherits privileges, Replication, Bypasses row-level security, Connection limit, Valid until, Member of, Members, Settings, OID |
| Tablespace | Owner, Location, Options, Size, OID |
| Extension | Owner, Schema, Version, Latest version, Relocatable, OID |
| Foreign-data wrapper | Owner, Handler, Validator, Options, Extension, OID |
| Foreign server | Owner, Wrapper, Type, Version, Options, User mappings, Foreign tables, OID |
| Language | Owner, Trusted, Procedural, Handler, Inline handler, Validator, Extension, OID |
| Cast | Source type, Target type, Function, Applies, Method, Extension, OID |
| Event trigger | Owner, Event, Function, Enabled, Command tags, OID |
| Publication | Owner, All tables, Tables, Publishes, Via partition root, OID |
| Subscription | Owner, Enabled, Publications, Replication slot, Synchronous commit, OID |
SQL shows the script that creates the object again, as pgjumbo writes it from the catalog: the CREATE
statement, then the owner, the comments and what belongs to the object. A table’s script starts with the sequences
its columns own, and after the CREATE TABLE and its owner come row-level security, the comments on the table and
its columns, its indexes, its replica identity, its triggers, its policies and its rules. A view’s script is a
CREATE OR REPLACE VIEW with its owner, comments and rules; a materialized view’s adds its indexes. Last come the
GRANT and REVOKE statements for every privilege that differs from PostgreSQL’s defaults. A column’s script is the
ALTER TABLE … ADD COLUMN that adds it, with its comment. When pgjumbo has no script for an object, the view says
pgjumbo cannot script this object.
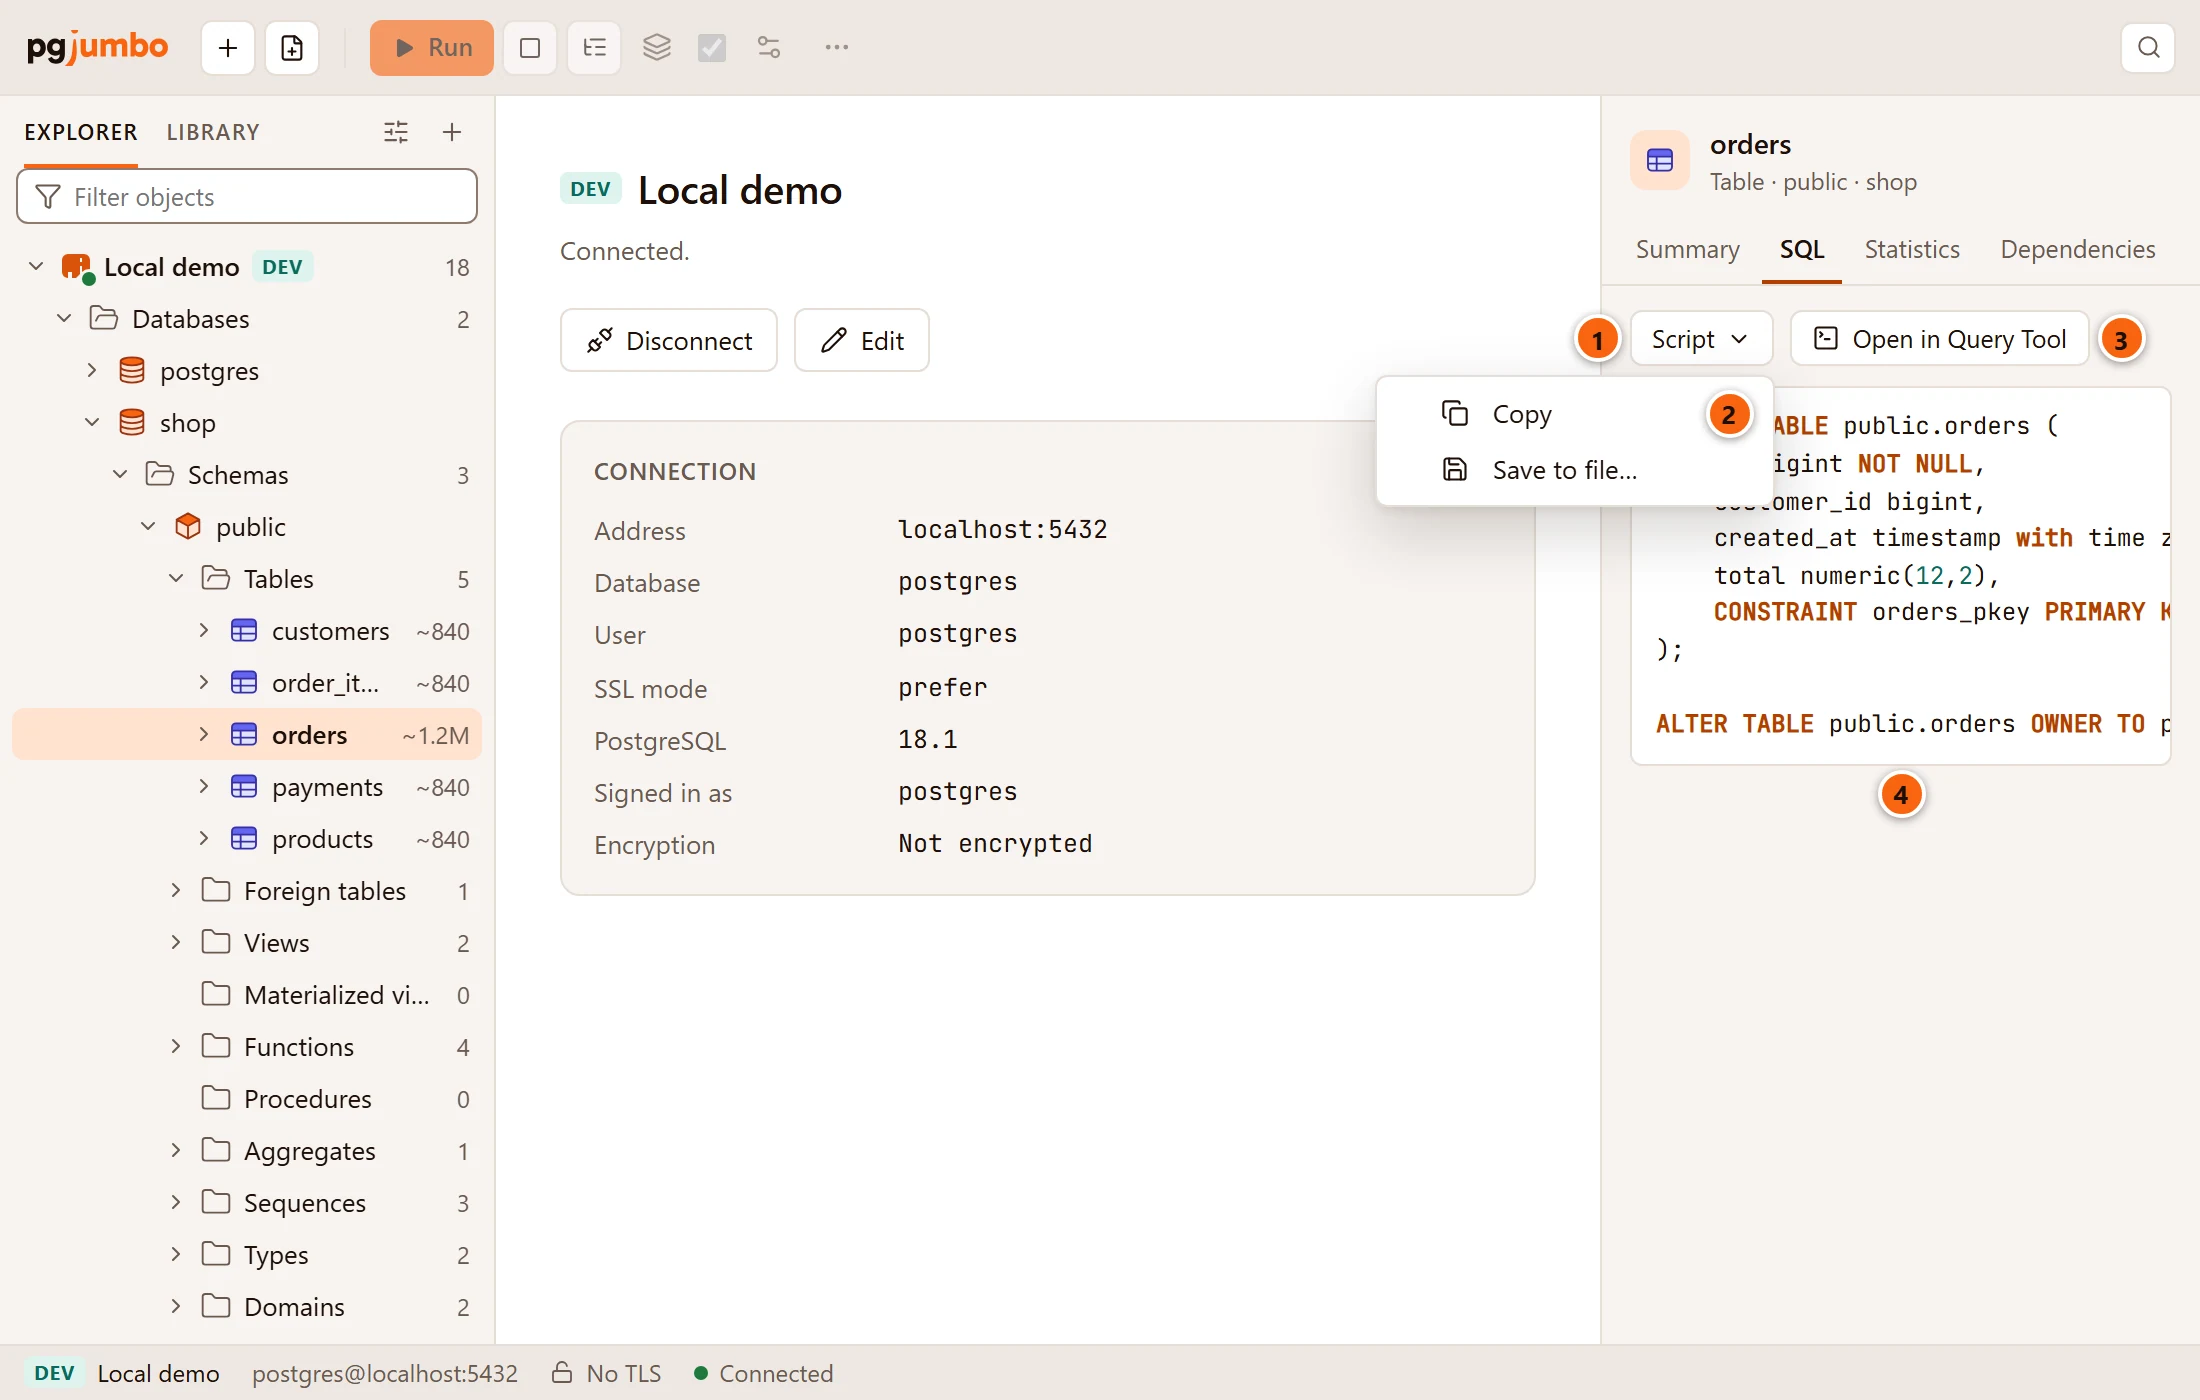
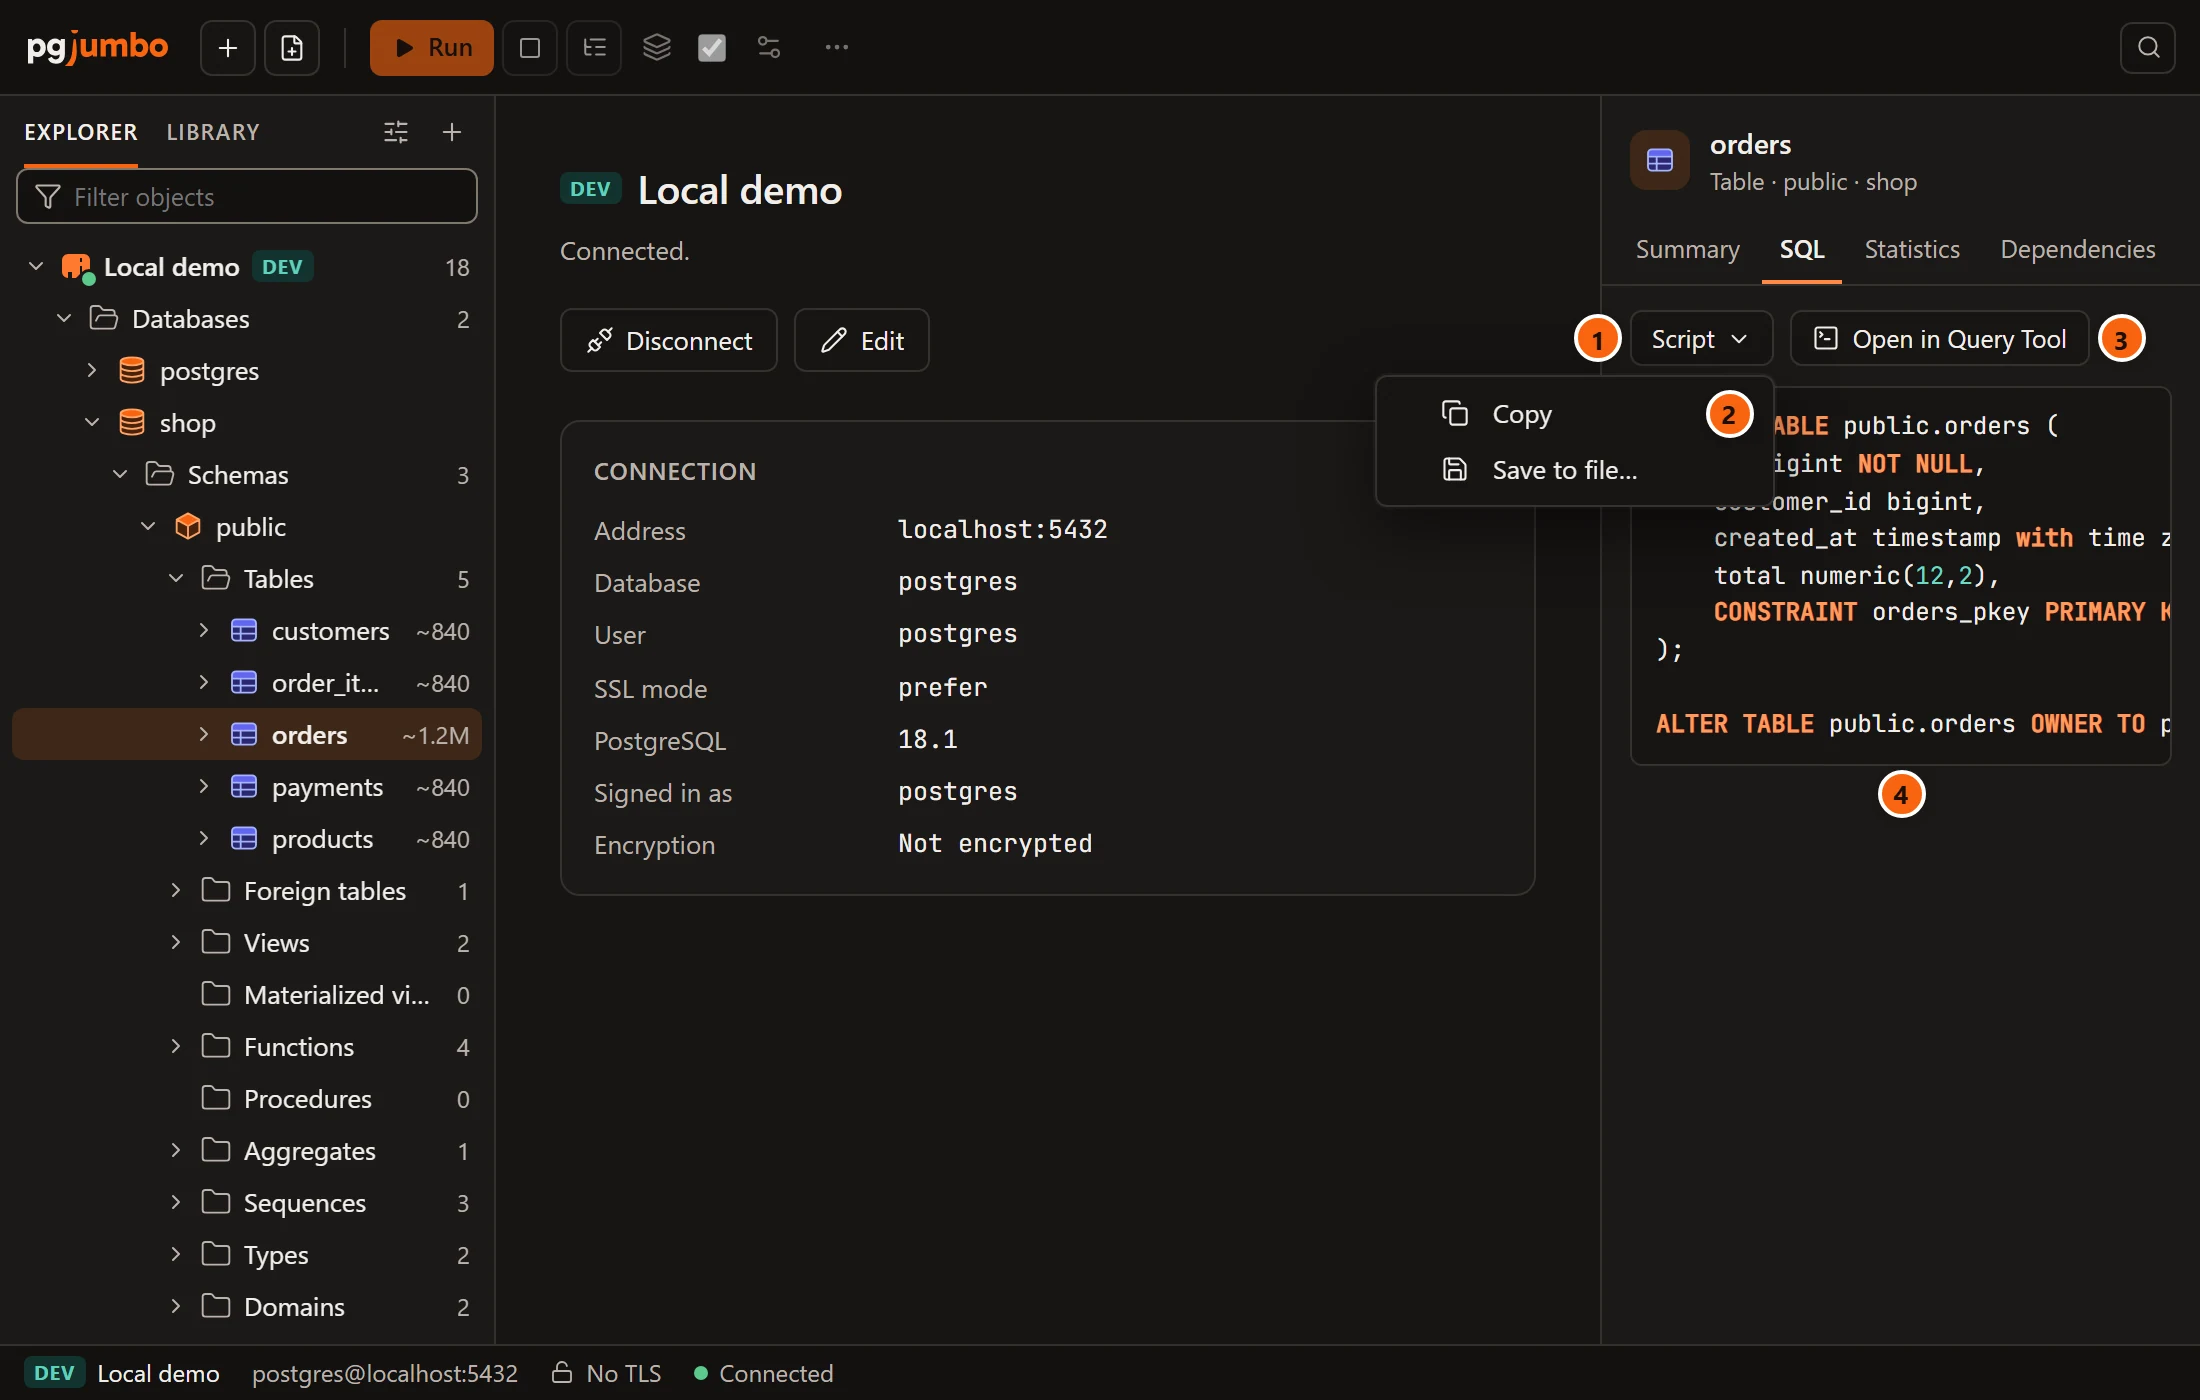
- 1 Script opens a menu for the script.
- 2 Copy puts the script on the clipboard. Save to file… asks where to save it with the system’s Save
dialog, offering
<name>.sql. Beside the button, a short line says how it went for a few seconds: Copied, Saved as and the file’s name, or what went wrong. - 3 Open in Query Tool opens a new Query Tool on the object’s database with the script in it. Nothing runs until you run it. See The Query Tool.
- 4 The script, in SQL colours. Select part of it and copy it with ⌘ C (Ctrl+C on Windows and Linux) if you need only that part.
The other scripts of an object, such as DROP and CREATE or a SELECT of every column, are under Script as on
the Explorer’s right-click menu: see Scripts.
Statistics
Section titled “Statistics”Statistics is there for tables, partitioned tables, materialized views, indexes, functions, procedures and
databases. The counts come from PostgreSQL’s cumulative statistics views (pg_stat_all_tables,
pg_stat_all_indexes, pg_stat_user_functions, pg_stat_database), the sizes from its size functions. A dash (—)
means the server keeps no value.
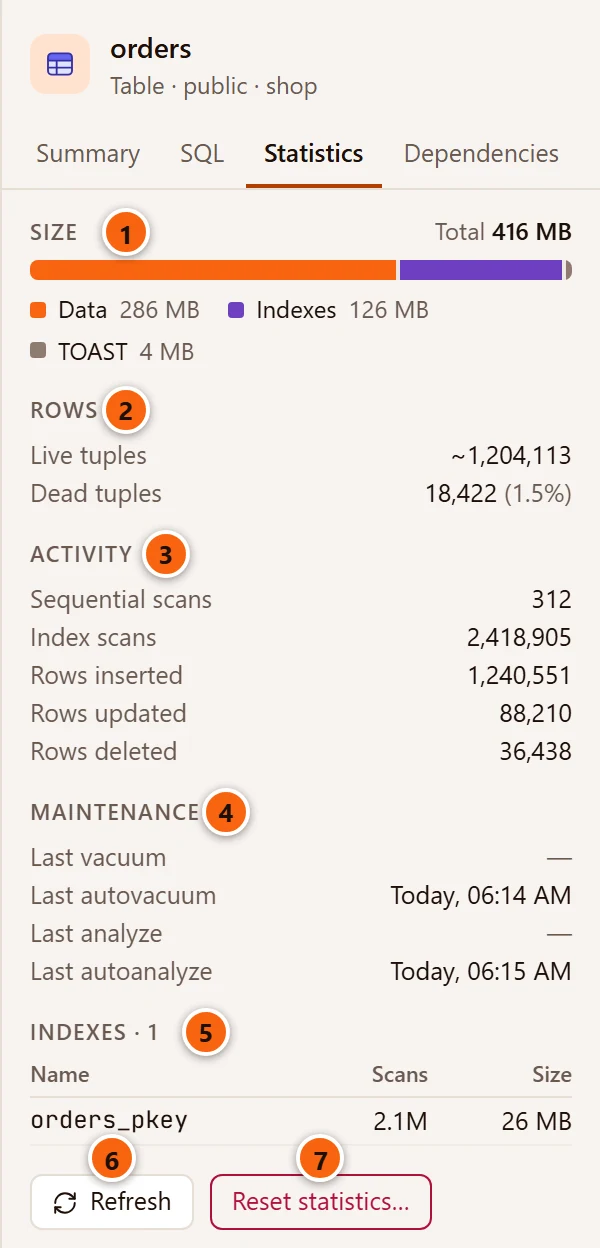
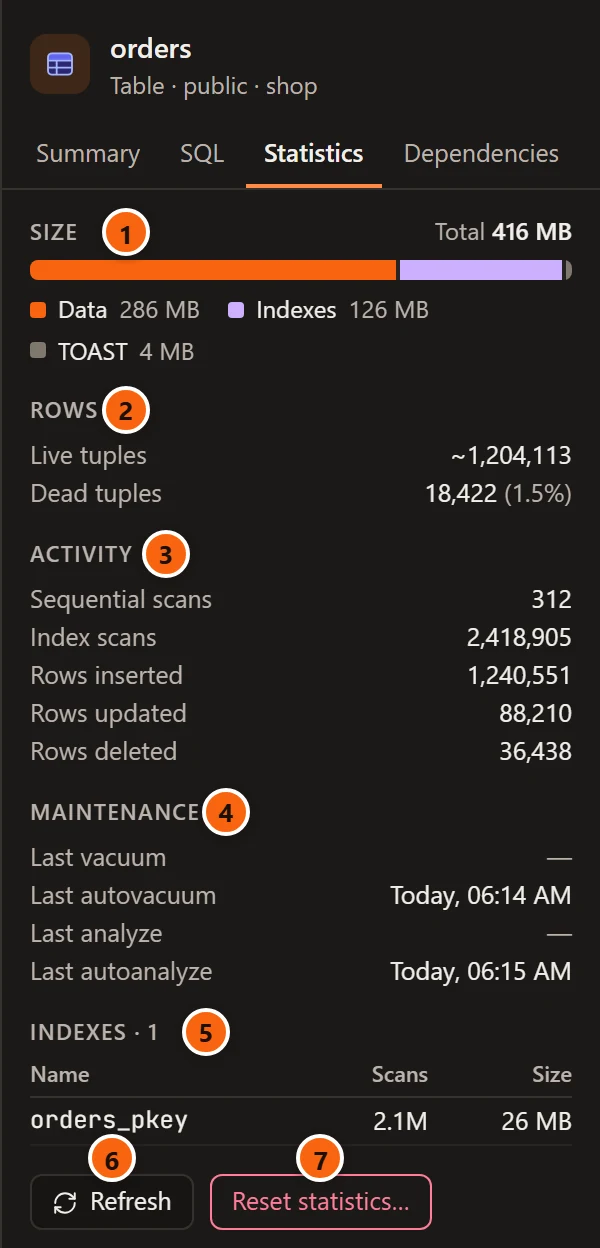
- 1 Size: the total on the right, and a bar split into Data (the table’s main fork with its free space map and visibility map), Indexes and TOAST, each with its size. For a partitioned table the sizes add up its partitions, and a line says how many there are.
- 2 Rows: Live tuples, as PostgreSQL estimates them, and Dead tuples with their share of all tuples.
- 3 Activity: Sequential scans, Index scans, Rows inserted, Rows updated and Rows deleted since the counters were last reset.
- 4 Maintenance: Last vacuum, Last autovacuum, Last analyze and Last autoanalyze, that
is, when the table was last vacuumed and analyzed by hand and by autovacuum. A time from today starts with
Today. - 5 Indexes: each of the table’s indexes, how many times it was scanned and its size. Large counts are
written short, such as
2.1M. - 6 Refresh reads the numbers again. Updated and a time, after the buttons, say when they were read; in a narrow pane they move to a line of their own below.
- 7 Reset statistics… sets the counters back to zero (see below).
PostgreSQL counts scans and rows on each partition, not on the partitioned table, so a partitioned table’s Rows, Activity and Maintenance have nothing of their own to show, and it has no Reset statistics…. Select a partition to see its counts.
An index, a function, a database
Section titled “An index, a function, a database”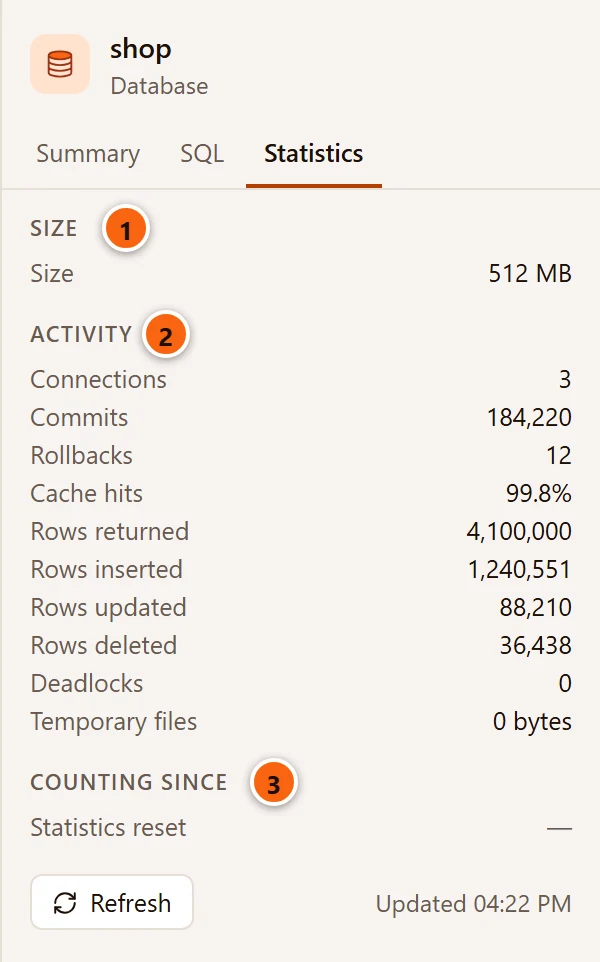
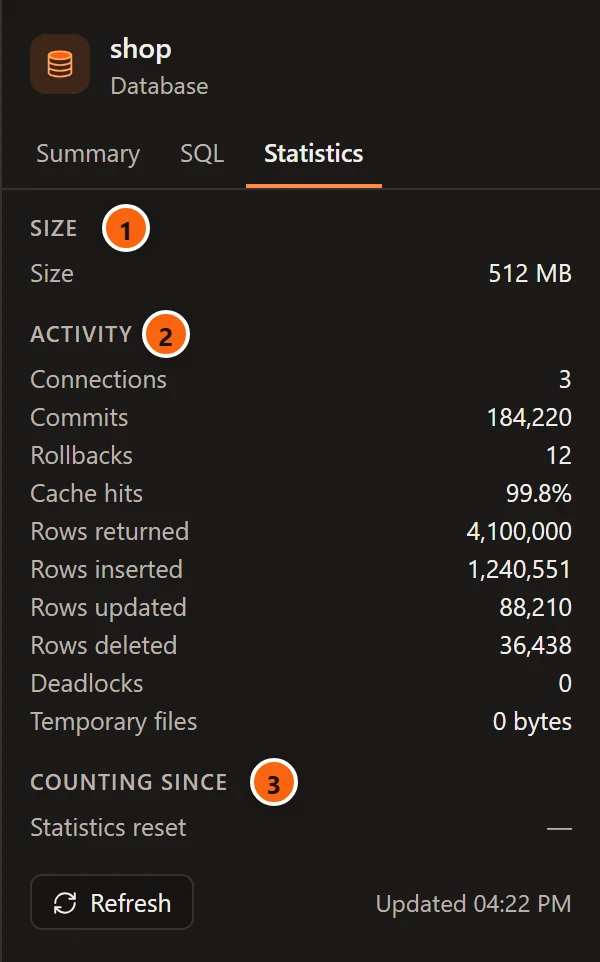
- 1 Size: the database’s size on disk.
- 2 Activity: the database’s counters, described in the table below.
- 3 Counting since: when the database’s statistics were last reset, or a dash when they never were.
A database has Refresh but no Reset statistics….
| Kind | What Statistics shows |
|---|---|
| Index | Size. Use: Scans, Rows read from the index, Rows fetched from the table, Unique. An index that is not valid says so at the top: Not valid: a concurrent build has not finished, or it failed. Queries do not use it. |
| Function, procedure | Calls: Calls, Total time, Time in itself, Average per call, Counted since. A line under them says that total time includes the functions it calls and time in itself does not. |
| Database | Size. Activity: Connections, Commits, Rollbacks, Cache hits (the share of blocks found in shared buffers), Rows returned, Rows inserted, Rows updated, Rows deleted, Deadlocks, Temporary files (their size). Counting since: Statistics reset. |
PostgreSQL counts a function’s calls only when track_functions lets it, so the view says why there may be none:
track_functionsisnone, PostgreSQL’s default: The server counts no calls: track_functions is none. A superuser can set it to pl or all on the server’s Configuration.track_functionsispland the function is written in SQL, C or an internal language: track_functions is pl, which counts functions in a procedural language only, not SQL ones. Set it to all to count them. (The message names the function’s language.)- Nothing counted although the server counts calls: Not called since the counts were reset, and for a SQL function or always inlined: a SQL function the planner inlines is never counted.
To change track_functions, see Server configuration.
Reset statistics
Section titled “Reset statistics”Reset statistics… is offered for a table, a materialized view, an index, a function and a procedure. It asks first.
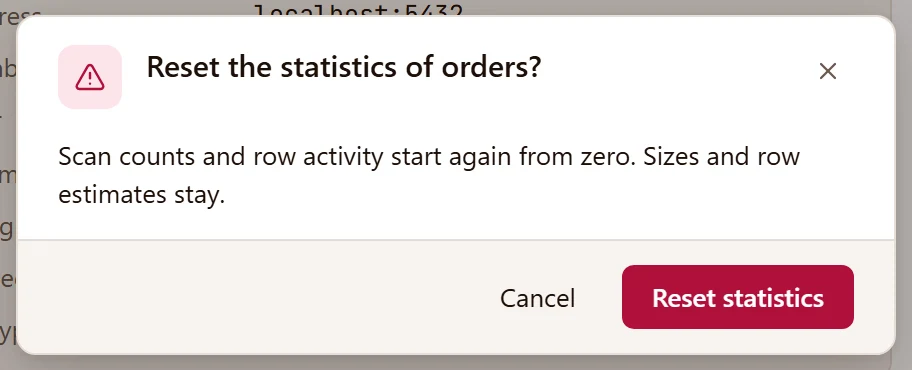
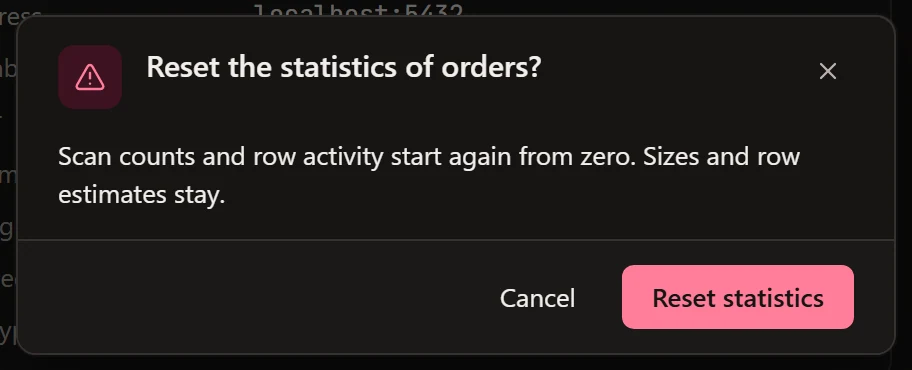
Click Reset statistics to go ahead, or Cancel. For a table, a materialized view or an index, pgjumbo runs
pg_stat_reset_single_table_counters: scan counts and row activity start again from zero, and sizes and row
estimates stay. For a function or a procedure the dialog says Its calls and time start again from zero., and
pgjumbo runs pg_stat_reset_single_function_counters. It runs once, on a connection of its own to the object’s
database, and the view reads the numbers again. By default PostgreSQL lets only superusers call these functions; when
your role may not, the dialog stays open and shows the server’s error.
The Explorer’s TasksReset statistics runs the same reset at once, without asking: see Drop, truncate and other quick actions.
Dependencies
Section titled “Dependencies”Dependencies lists what the object depends on and what uses it, one step each way, as PostgreSQL records it in
pg_depend. Every object that Drop… works on has this view: schemas, tables, views, materialized views, foreign
tables, functions, procedures, sequences, types, domains, constraints, indexes, triggers, policies, rules, casts,
event triggers, extensions, foreign-data wrappers, languages, publications, collations, aggregates, operators and the
text search objects. Databases, roles, tablespaces, columns, subscriptions and foreign servers do not have it.
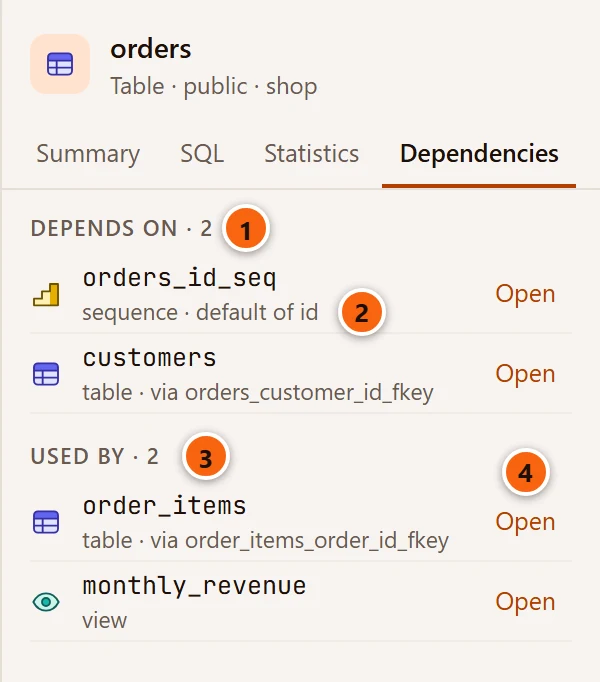
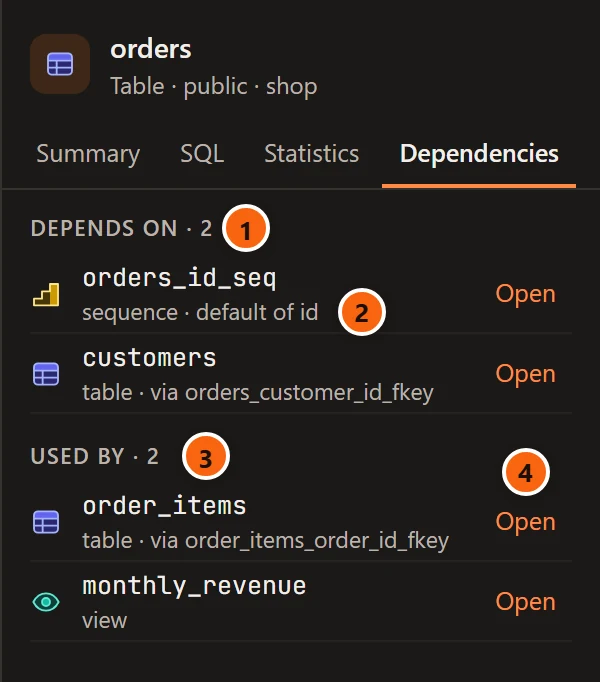
- 1 Depends on, with how many: the objects this one needs.
- 2 Under each name, its kind and how it is reached. The object’s own parts (its constraints, column
defaults, indexes, rules and triggers) count as the object, so a dependency that goes through one of them names
that part:
via orders_customer_id_fkey,default of id. A dependency of one column says which:column status. - 3 Used by: the objects that need this one. Something that is part of another object, such as a view’s
rule or a foreign key on another table, is listed as that object. A sequence that one of the table’s columns owns
says
owned by id. - 4 Open shows that object in the Inspector. It is there for the objects the Explorer can show.
Objects in the object’s own schema are named without the schema. Schemas and PostgreSQL’s built-in objects are left out. With nothing to list, the view says Nothing besides its schema. or Nothing uses it.
Before you drop something, Drop… shows everything CASCADE would take with it: see
Drop, truncate and other quick actions.
A column’s summary in a table tab
Section titled “A column’s summary in a table tab”When you work on a table in its own tab, the Inspector follows the column you choose there.

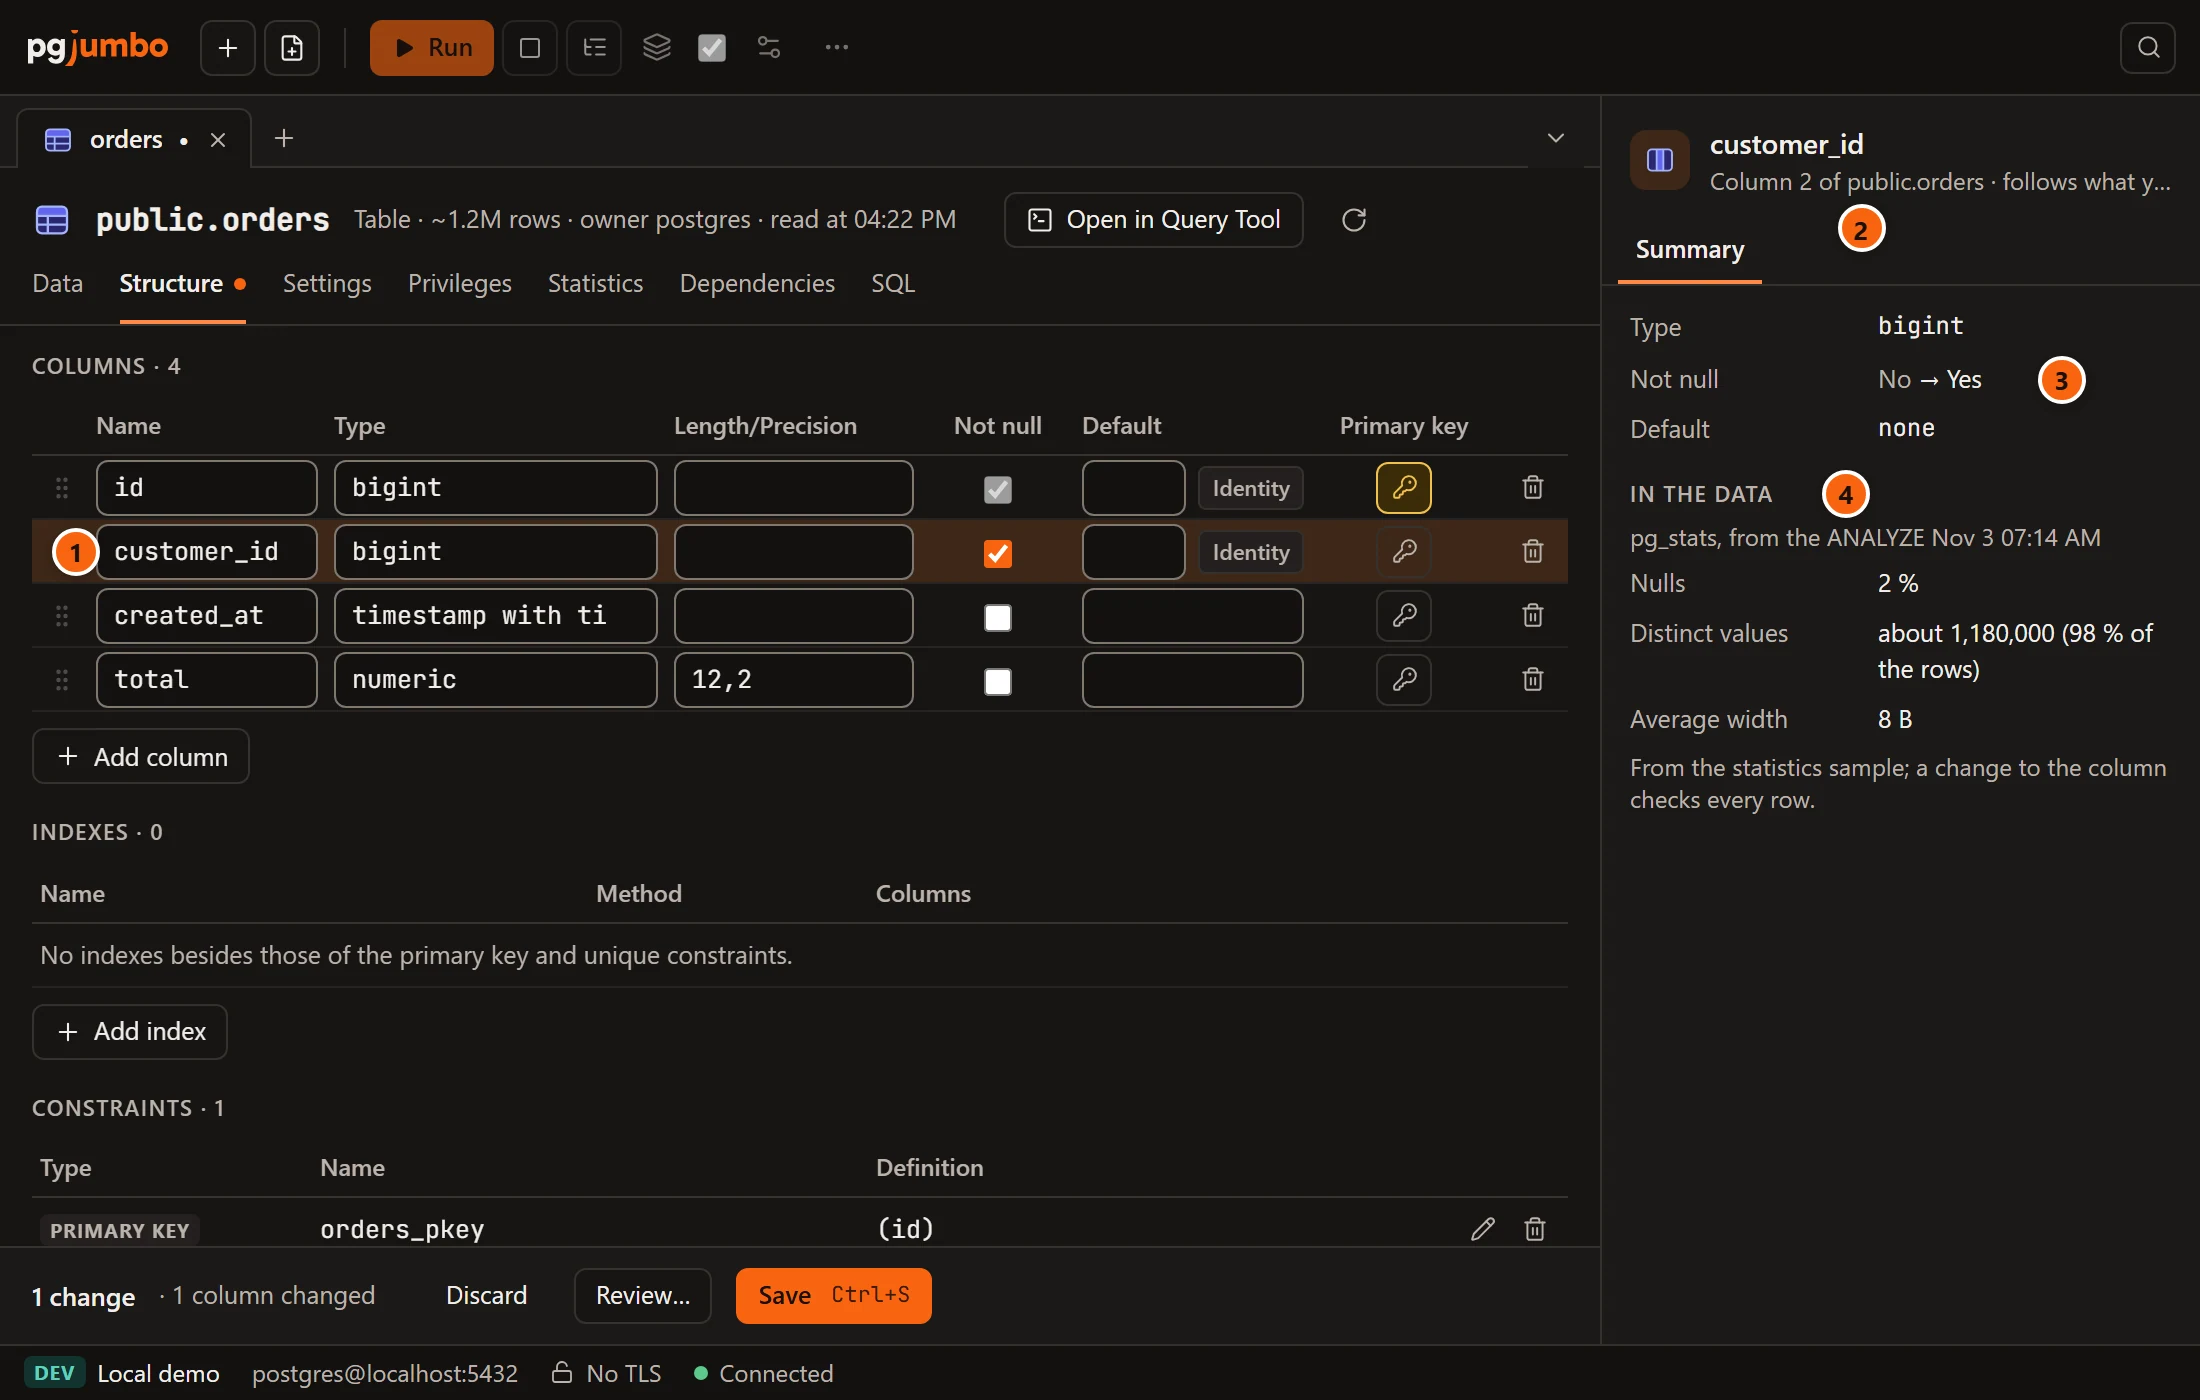
- 1 On the table tab’s Structure view, click a column’s row or one of its fields. (The Explorer is hidden here, to give the tab room.)
- 2 The header names the column, its place among the table’s columns and the table, then says follows what you select in the tab (cut short when the pane is narrow). The pane has one view, Summary.
- 3 Type, Not null, Default (
nonewhen there is none) and, when the column has one or you have staged one, Comment. A change staged in the tab and not saved yet shows as the value now, an arrow and the staged value:No → Yes. - 4 In the data: what
pg_statsknows of the column, from theANALYZEwhose time is given. Nulls is the share of rows that are null. Distinct values is about how many there are, with their share of the rows when PostgreSQL keeps it as a share. Average width is in bytes. Most common values, when PostgreSQL keeps them, lists up to ten with a bar for each one’s share.
These numbers come from PostgreSQL’s statistics sample, not from every row. The last line says so: From the statistics sample; a change to the column checks every row. A change you save, such as setting Not null, is checked by the server against every row, whatever the sample says. When there are no numbers, the view says why:
| Message | Why |
|---|---|
| A new column: it has no data until the table is saved. | You added the column in the tab and have not saved yet. |
| No statistics: the table has not been analyzed since it had rows. Autovacuum, or ANALYZE from Tasks › Maintenance…, gathers them. | pg_stats has no row for the column. See Maintenance and jobs. |
| Reading pg_stats… | pgjumbo is still asking the server. |
| The server’s error, in red | Reading pg_stats failed. |
The column’s summary shows while that table tab is in front. Bring another tab to the front and the Inspector goes back to what it showed before; bring the table tab back and the column’s summary returns. Select something in the Explorer and the column is let go. Everything else in the table tab is on Tables.