
Activity
Activity is a view of the server’s tab: a live picture of the server, refreshed every few seconds. It is a column of panes (sessions, what they wait on, who blocks whom, the statements that cost the most right now, I/O, locks) that you open as you need them. A pane’s list is read only while the pane is open.
Open Activity
Section titled “Open Activity”Connect the server, then do one of these:
- Right-click the server in the Explorer and choose Dashboard.
- Choose ToolsServer Activity in the menu bar.
- Double-click Activity in the server’s Management folder.
- Click Activity in the server’s tab, if it is open already.
The other ways in are listed on The server’s tab.
The Activity view
Section titled “The Activity view”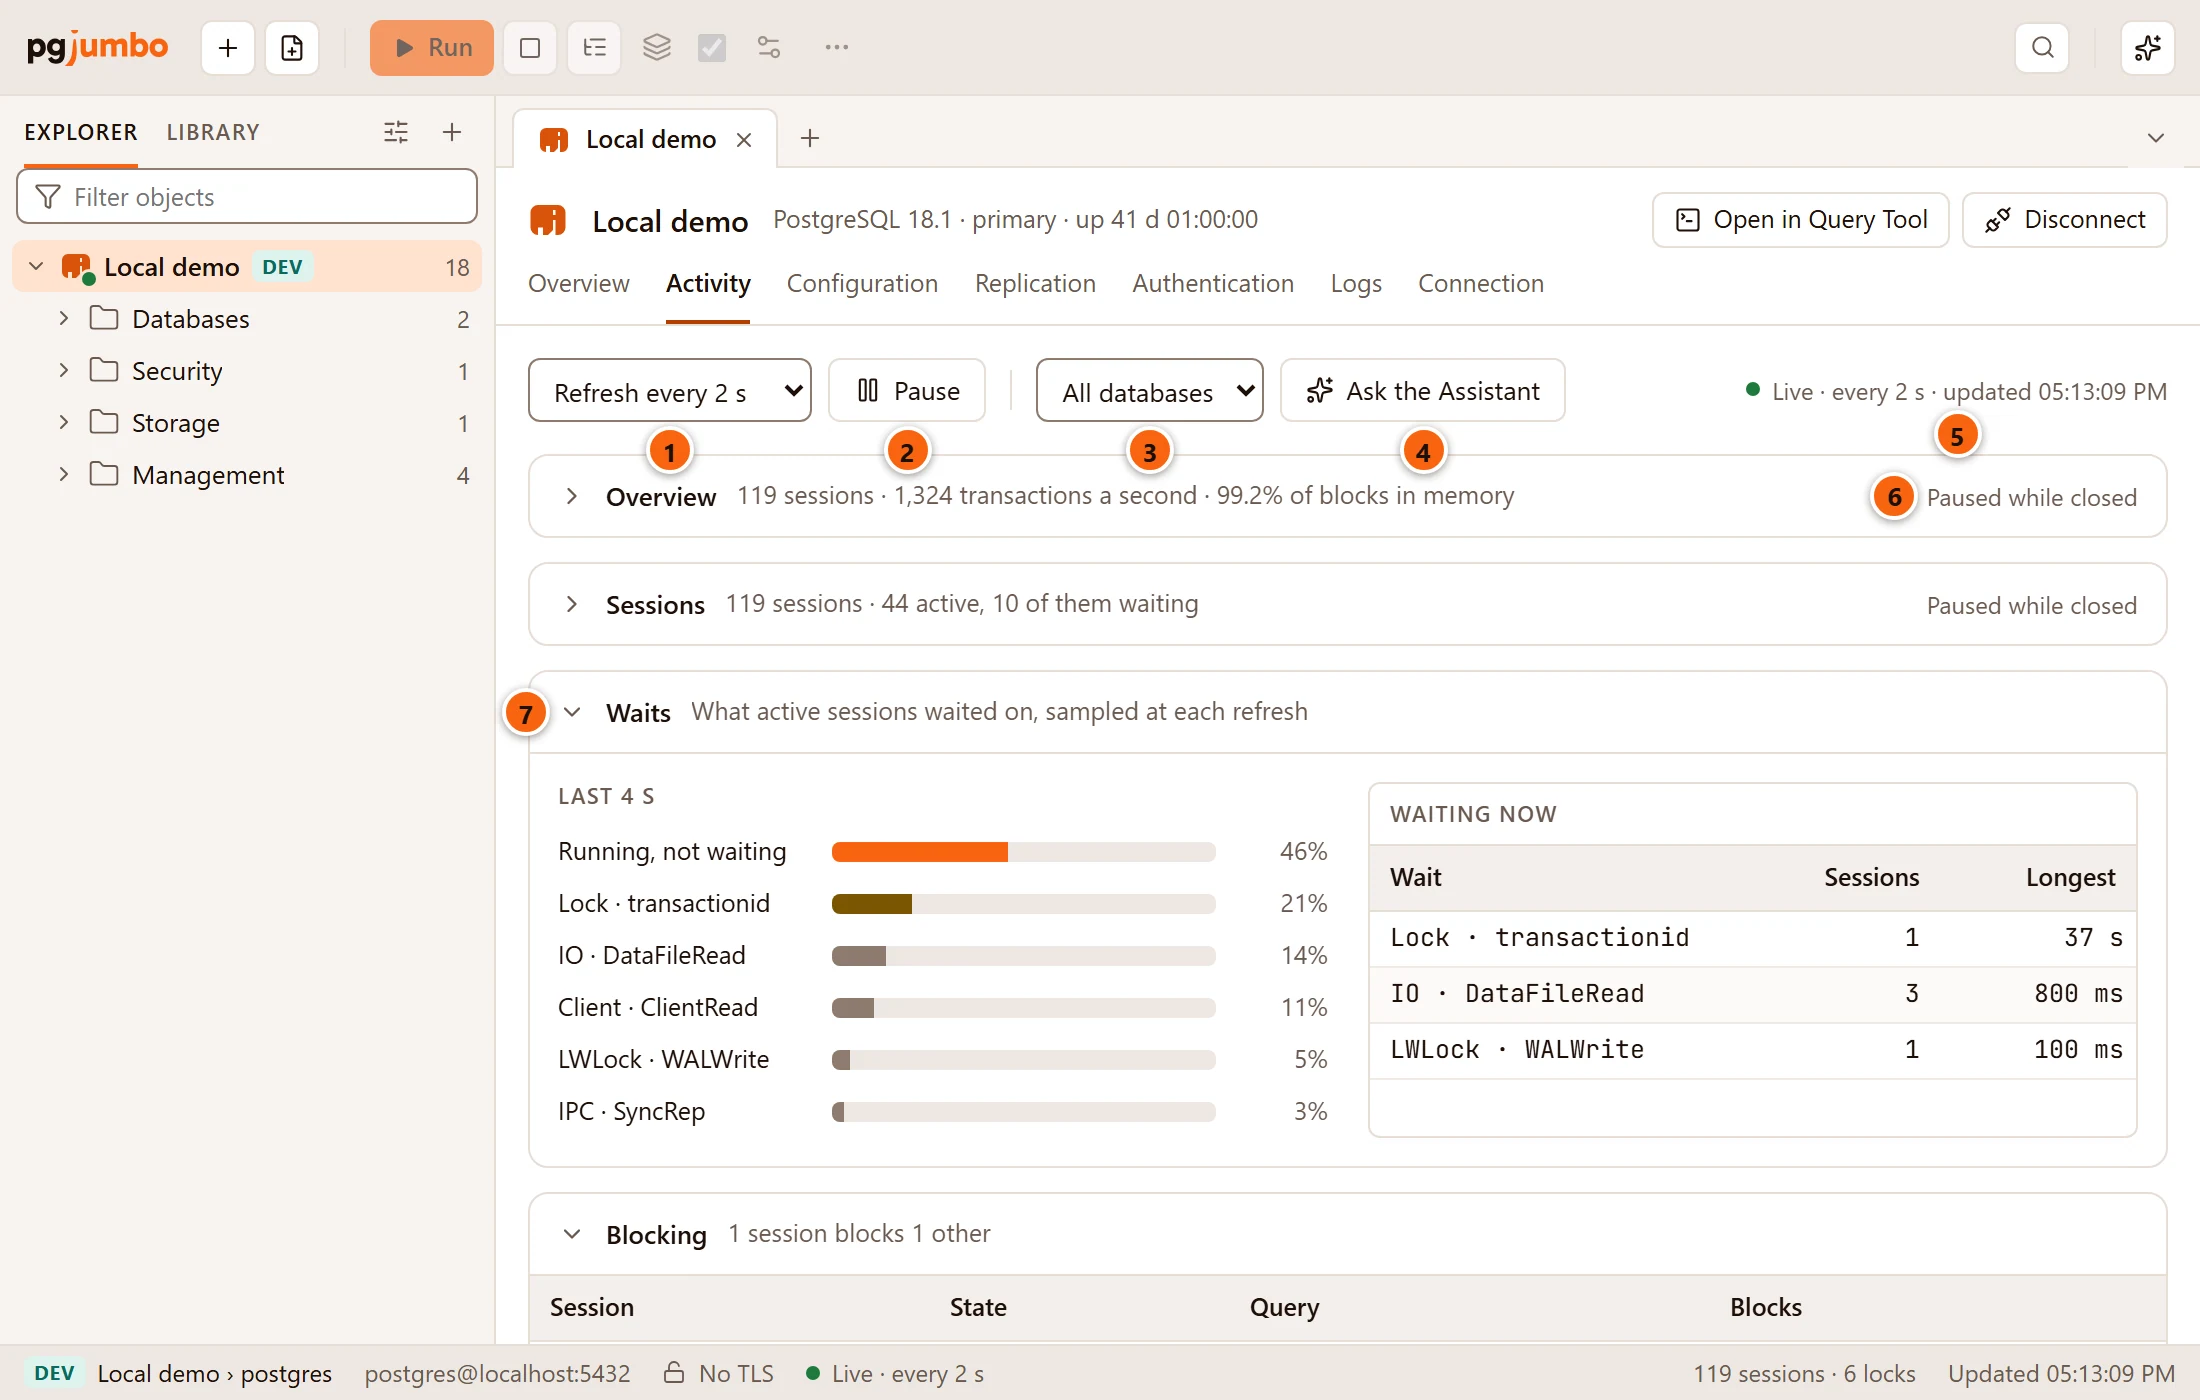
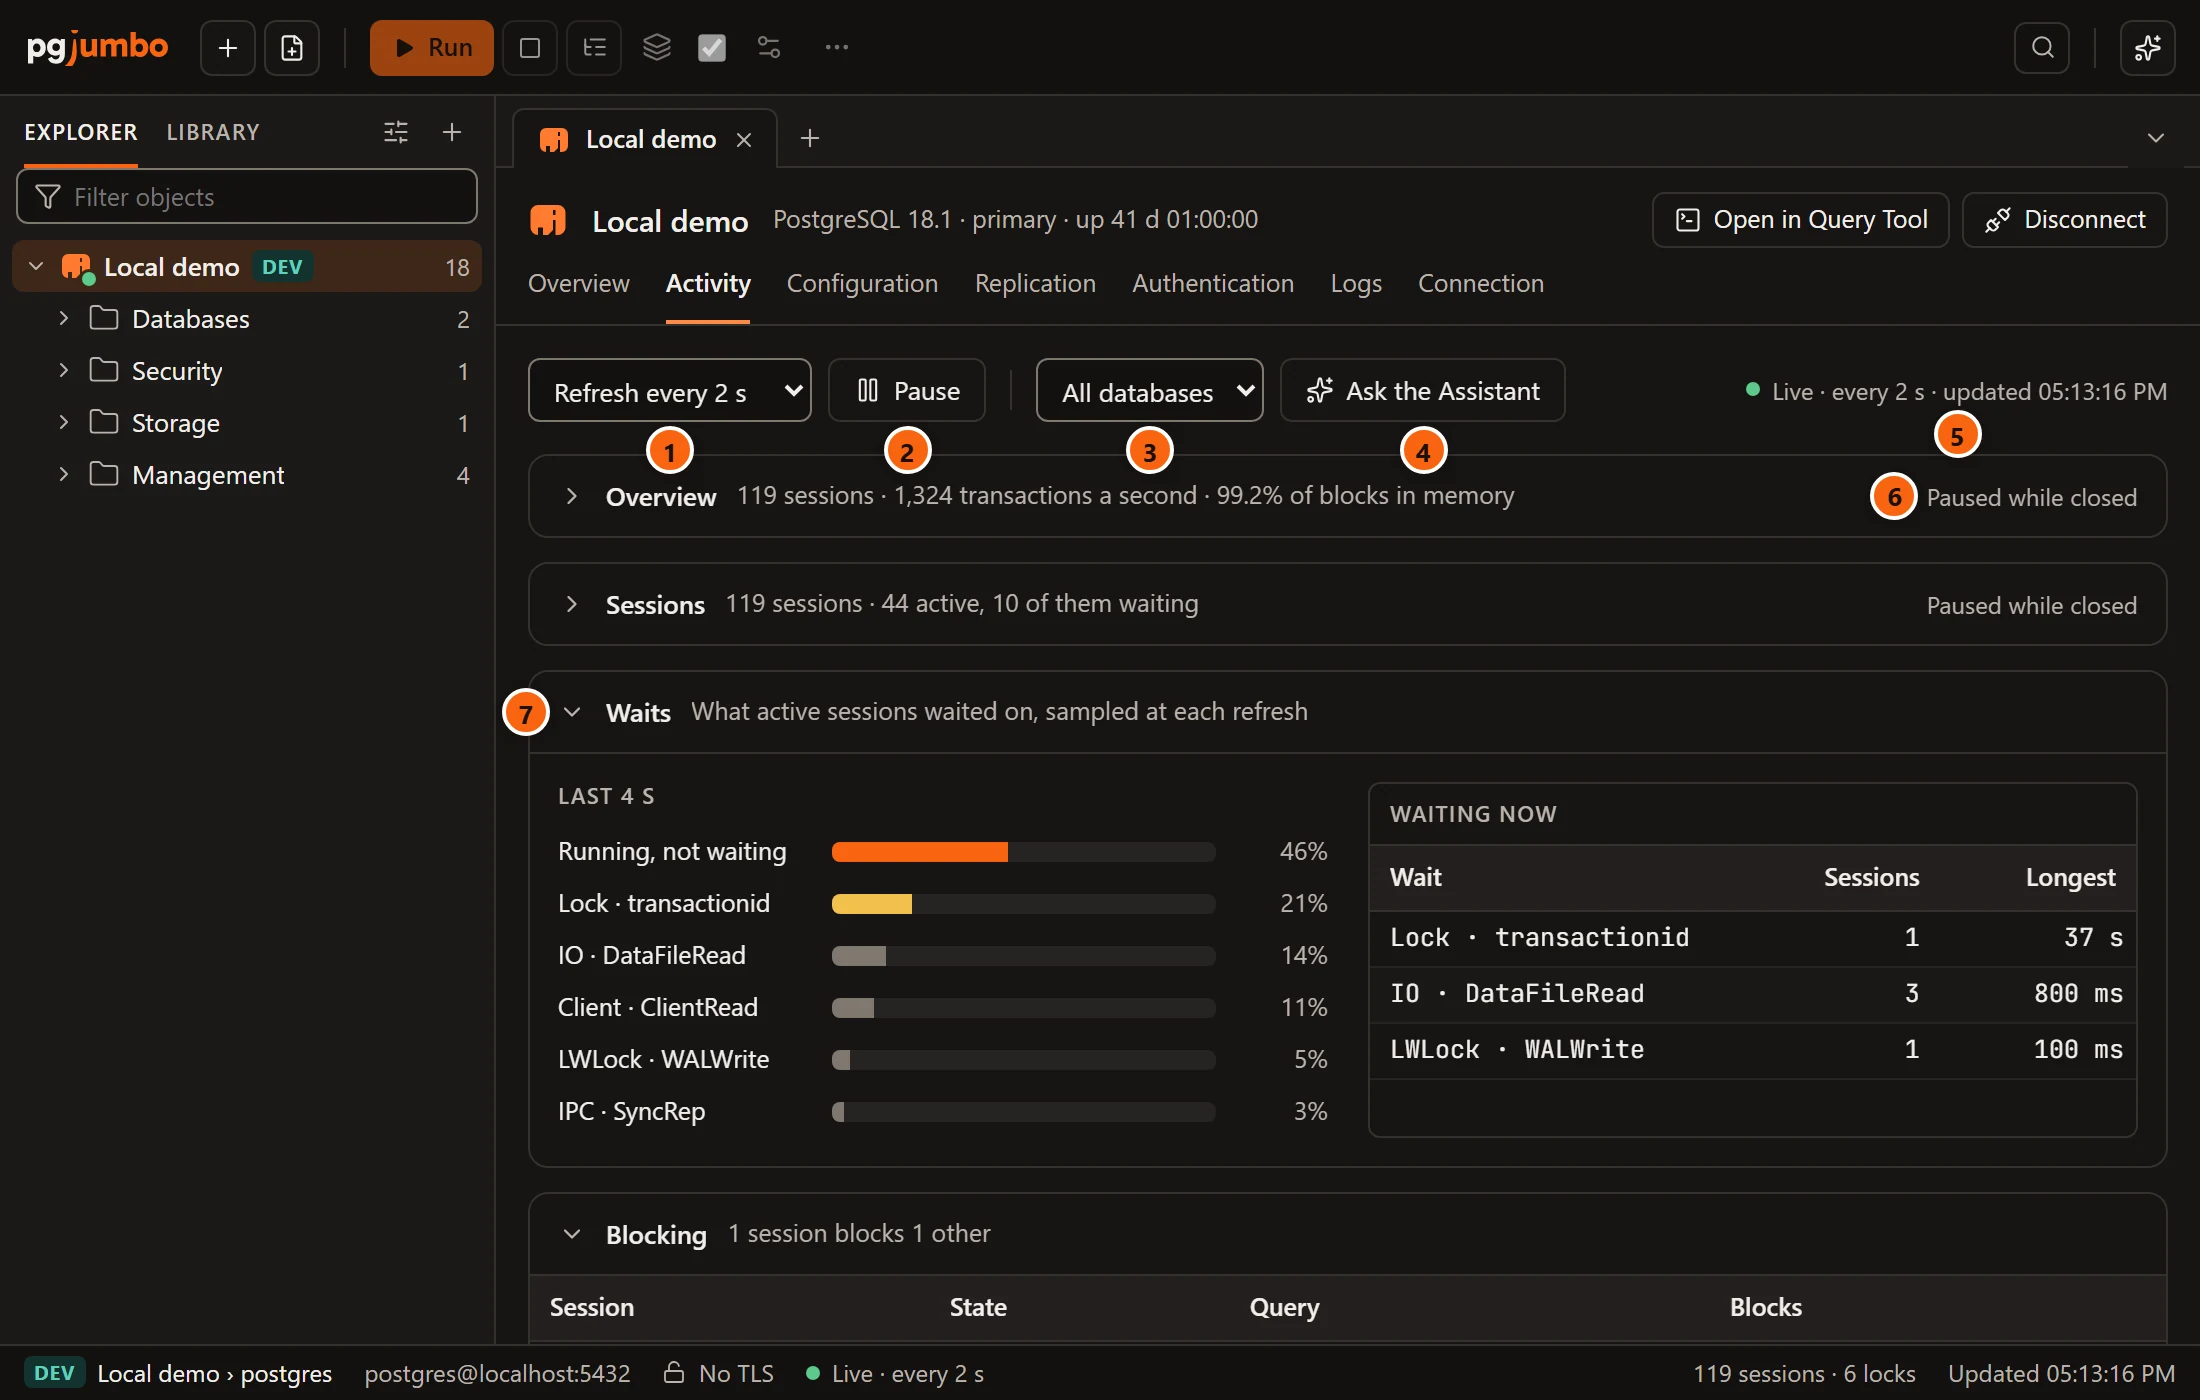
- 1 Refresh every: how often Activity reads the server: 1, 2, 5 or 10 seconds. A new tab starts at 2.
- 2 Pause stops reading; the button then says Resume.
- 3 All databases, or one database from the list. With one chosen, every pane keeps to it except Data file I/O, which covers the whole server. The charts and the samples of Waits and Expensive queries now start again when you change it.
- 4 Ask the Assistant shows while the Assistant is on; see Ask the Assistant.
- 5 Live · every 2 s · updated and the time of the last read, with a green dot; Paused with a grey dot while paused.
- 6 A closed pane says what it holds in one line and Paused while closed: pgjumbo reads nothing for it.
- 7 Click a pane’s title (anywhere on its header row) to open or close it.
Activity reads the server only while its tab is in front, Activity is the view shown, and it is not paused. Each
read waits for the one before to answer. It runs on a connection of its own, named pgjumbo/monitor in
pg_stat_activity, so it never waits behind the Explorer or a Query Tool, nor makes them wait. That connection opens
when you show Activity and closes when you show another view, close the tab or disconnect the server. With one
database chosen it moves into that database, so that locks there show their tables’ names; with All databases it
stays on the maintenance database.
If a read fails, the message shows in red under the toolbar, and the next read tries again.
While the server’s tab is in front on Activity, the status bar shows the server and the database Activity keeps to, the live state (Live · every 2 s or Paused), and after the first read how many sessions and locks the last read found and when it ran (The pgjumbo window). On the tab’s other views the status bar says nothing about Activity.
Open and close panes
Section titled “Open and close panes”The panes, top to bottom. Waits, Blocking and Expensive queries now are open the first time. Which panes are open is the same for every server, and pgjumbo remembers it when it starts again.
| Pane | Its line while closed | Its line while open |
|---|---|---|
| Overview | Sessions, transactions a second and the share of blocks found in memory. | The same. |
| Sessions | Sessions, how many are active, and how many of those wait. | The same. |
| Waits | How many sessions wait now, or No session waiting now. | What active sessions waited on, sampled at each refresh |
| Blocking | How many locks are waited for, or No lock waited for. | 1 session blocks 1 other, or No session blocks another. |
| Expensive queries now | The statements that took the most time in the last minute | The window read so far, such as pg_stat_statements over the last 60 s; at first pg_stat_statements · measured from the next refresh, or pg_stat_statements cannot be read here. |
| Data file I/O | Reads and writes by kind of process (pg_stat_io, PostgreSQL 16 and later) | pg_stat_io, for the whole server, a second |
| Locks | Locks, and how many wait. | The same. |
| Prepared transactions | How many, or None. | The same. |
The counts in these lines come from one small query that every read makes. A pane’s own list is read only while it is open, and opening a pane reads the server at once. Until that read comes back, the pane says Loading…. Waits, Expensive queries now and Data file I/O compare reads over time; they start again from nothing each time you open them.
Overview
Section titled “Overview”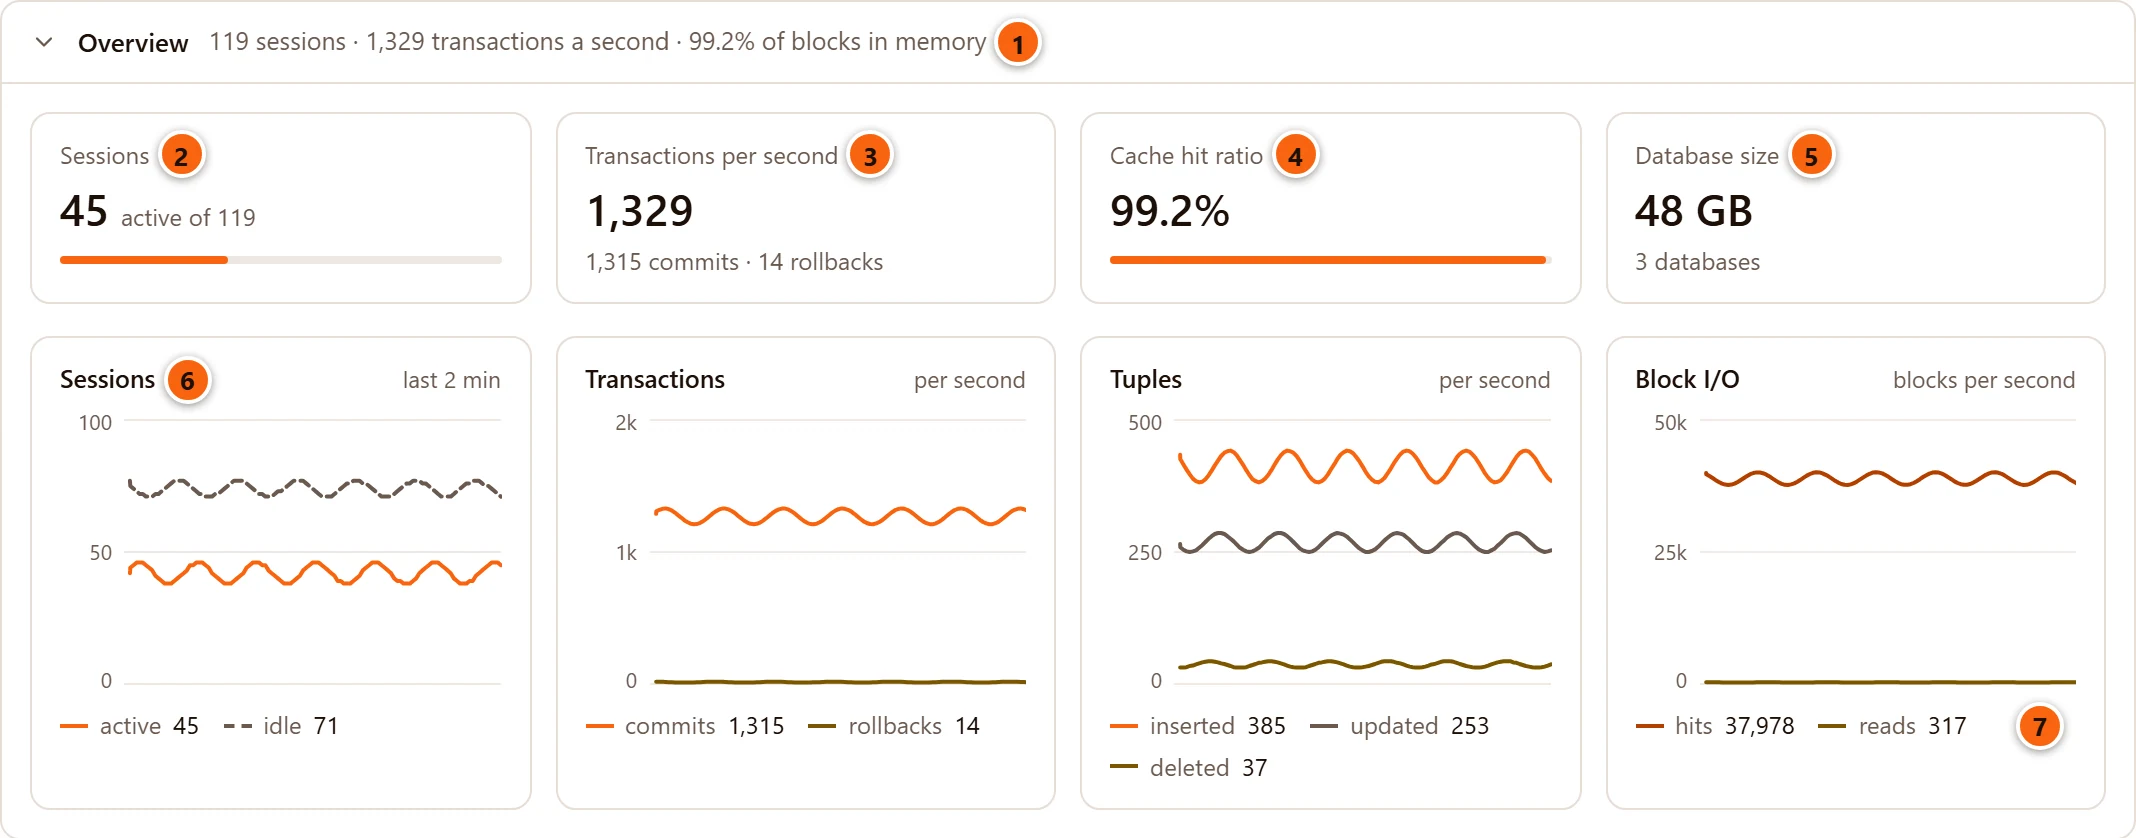

- 1 The pane’s line: sessions, transactions a second, and the share of blocks found in memory.
- 2 Sessions: active client sessions, active of all of them, with a bar for the share.
- 3 Transactions per second: commits plus rollbacks a second, each named under it. The first read has no rate: it says Measured from the next poll.
- 4 Cache hit ratio: the share of blocks read that were found in shared buffers, since the statistics were last reset.
- 5 Database size: all databases, or the one chosen, and how many there are. Sizes are read at most
every 30 seconds, and only while Overview is open, since
pg_database_size()walks the files. - 6 Four charts of the last two minutes: Sessions (active, and idle as a dashed line), Transactions (commits and rollbacks a second), Tuples (inserted, updated and deleted a second) and Block I/O (blocks found in memory and blocks read a second).
- 7 Each legend gives the line’s latest value.
The charts fill from the right as reads come in. A chart’s scale tops out at 1, 2 or 5 times a power of ten. Where
Activity did not read for a while (the tab was in the back, or paused) the rate lines break instead of averaging the
gap. Session counts here count client sessions only, not background processes. Rates come from pg_stat_database’s
counters, compared between two reads; a counter reset counts as no change.
Sessions
Section titled “Sessions”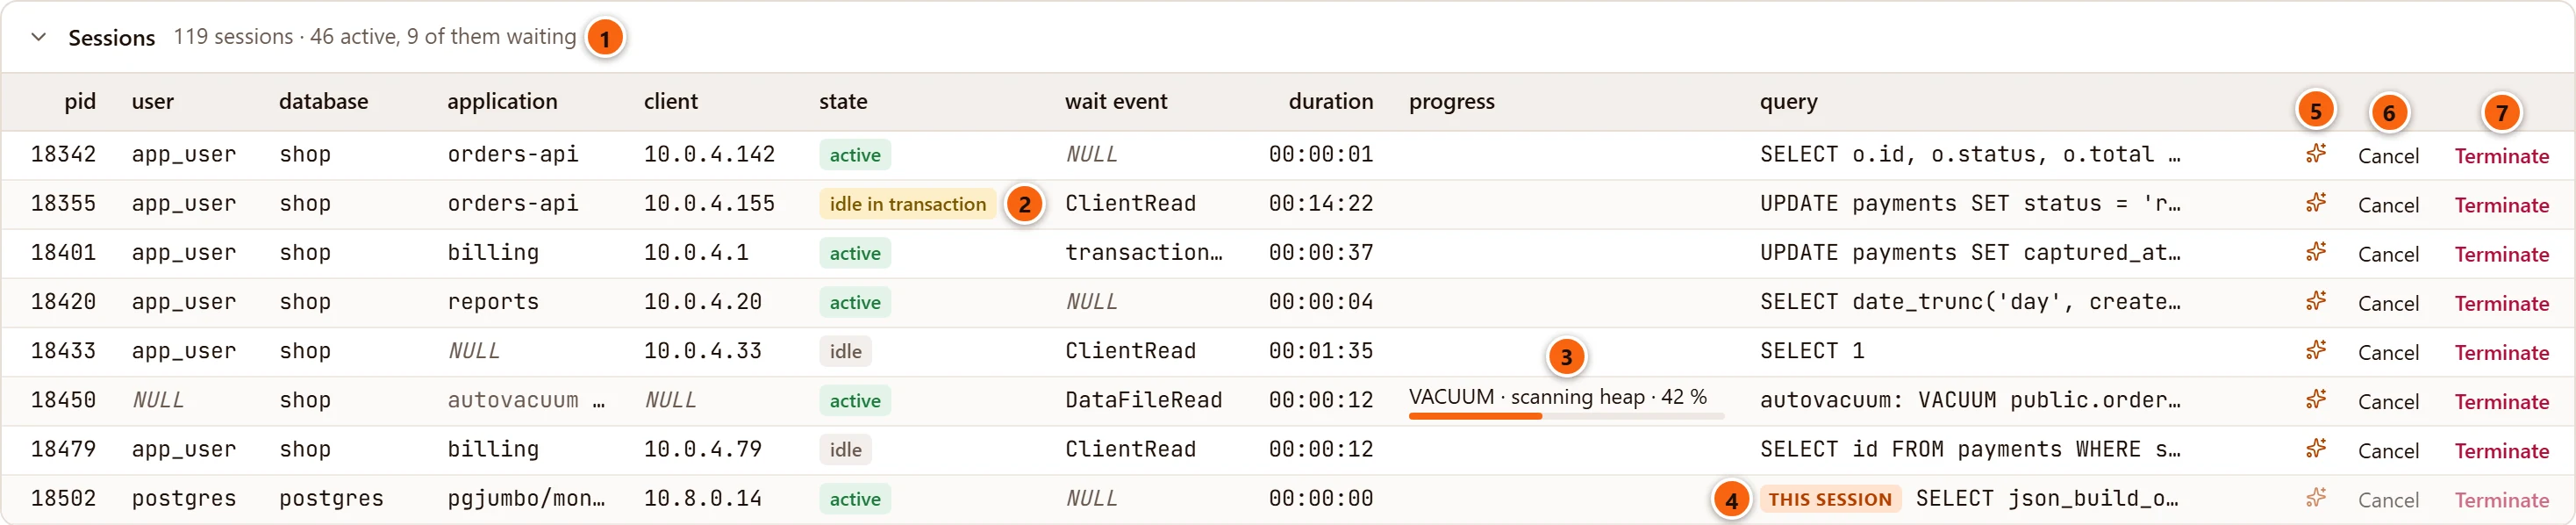
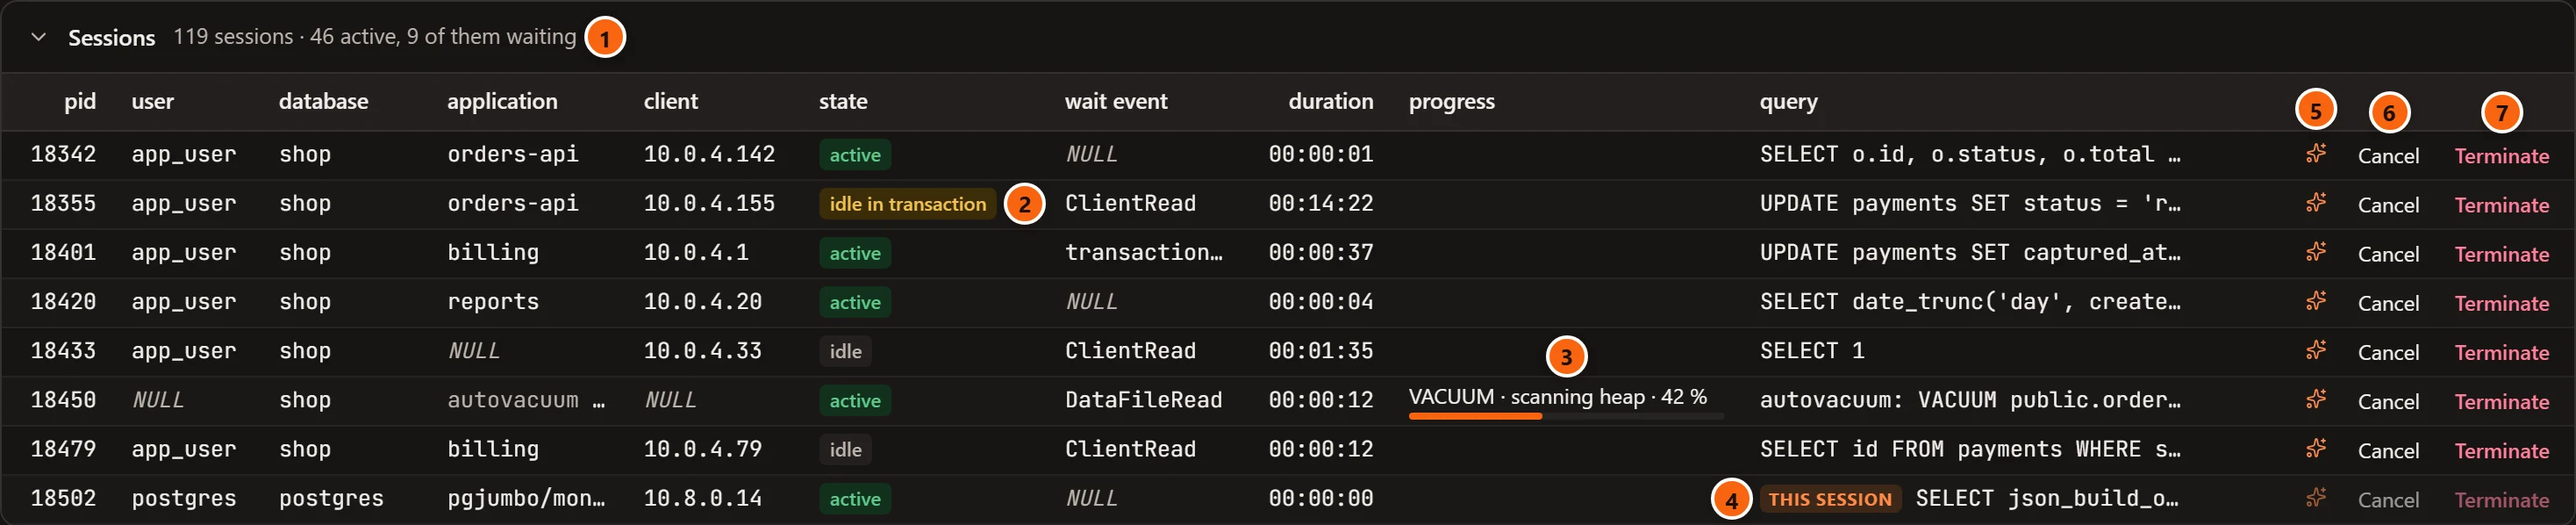
- 1 The pane’s line: sessions, active ones, and how many of those wait.
- 2 state: green for
active, amber foridle in transaction(andidle in transaction (aborted)), grey otherwise. - 3 progress: how far a long command is, from the
pg_stat_progress_*views. - 4 this session: Activity’s own connection. Its buttons are greyed out.
- 5 The sparkles button asks the Assistant why the session is still running. It shows while the Assistant is on.
- 6 Cancel stops the session’s query (below).
- 7 Terminate ends the session.
The list holds client sessions and the background processes working in a database, such as autovacuum and parallel workers, in order of pid:
| Column | What it says |
|---|---|
| pid | The server process. A Query Tool shows its own pid in the status bar, so you can find it here (Transactions and sessions). |
| user | The role. NULL for most background processes. |
| database | The database it is connected to. |
| application | application_name. A background process without one shows its kind in grey, such as autovacuum worker. pgjumbo’s own connections are named pgjumbo/…; the psql of a psql tab shows as pgjumbo/psql. |
| client | The client’s host name or address, local for a Unix socket, NULL for a background process. |
| state | active, idle, idle in transaction, idle in transaction (aborted), fastpath function call or disabled. |
| wait event | What it waits on now, such as ClientRead or transactionid. Point at it for the type as well, such as Lock: transactionid. |
| duration | How long it has been in its current state, as 00:14:22, or 2 d 03:04:05 past a day. |
| progress | The command, its phase and how far it is: VACUUM · scanning heap · 42 % over a bar when the total is known, else a count of blocks, tuples or bytes. Point at it for the whole text. |
| query | The current or last query, on one line; point at it for all of it. Cut at 2,000 characters, with passwords masked as in the query history. |
Which commands report progress depends on the server: CREATE INDEX and REINDEX, VACUUM, CLUSTER and VACUUM FULL from PostgreSQL 12; ANALYZE and base backups from PostgreSQL 13; COPY from PostgreSQL 14.
At most 1,000 sessions are listed. When there are more, the pane says so under the list, as in Showing the first 1,000 of 1,214 sessions. The pane’s line and the cards count every client session. With nothing to list, the pane says No sessions.
Cancel a query or end a session
Section titled “Cancel a query or end a session”Cancel and Terminate are on each row of Sessions and Blocking. pgjumbo asks first, and names the session and its query.
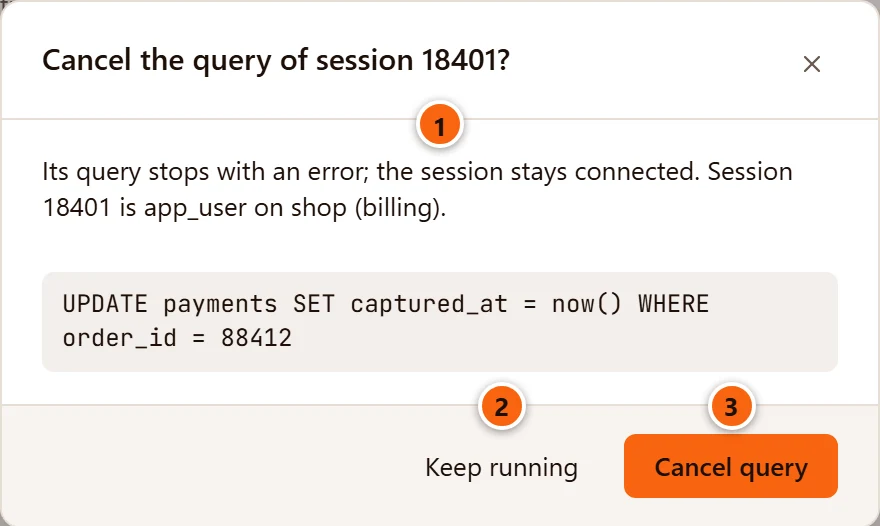
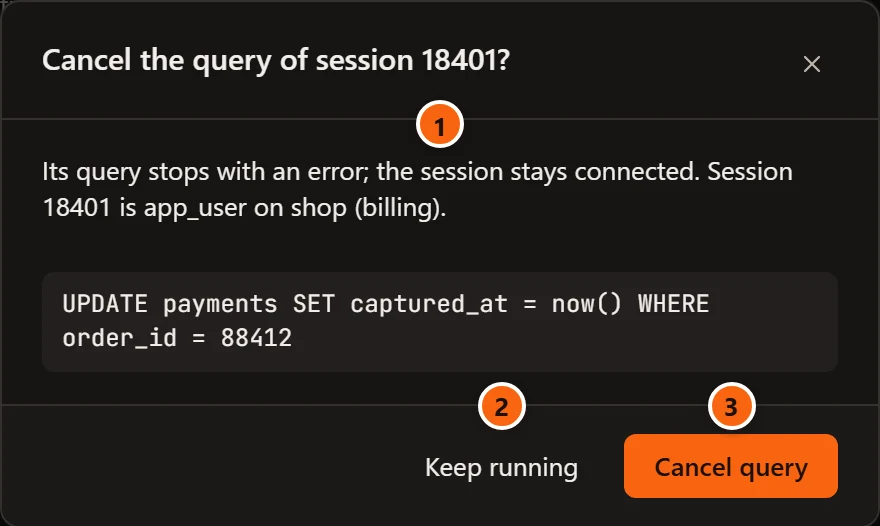
- 1 What happens, and whose session it is: role, database and application.
- 2 Keep running closes the dialog and changes nothing.
- 3 Cancel query sends the cancel.
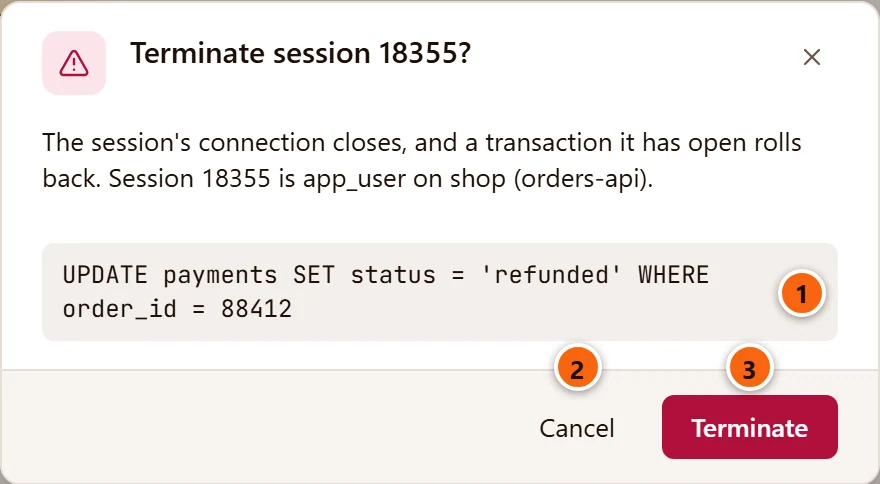
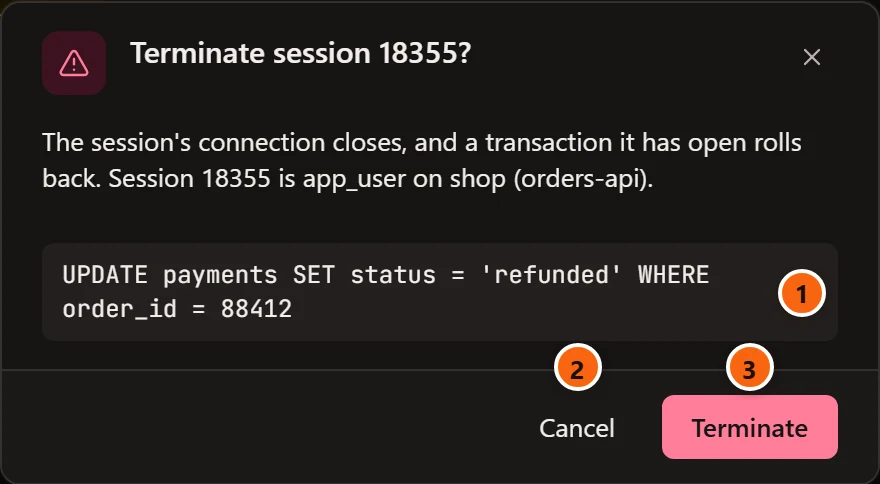
- 1 The session’s query, so you can tell it is the right one.
- 2 Cancel closes the dialog and changes nothing.
- 3 Terminate ends the session.
| Cancel query | Terminate | |
|---|---|---|
| Runs | pg_cancel_backend(pid) |
pg_terminate_backend(pid) |
| The query | Stops with an error. | Stops. |
| The session | Stays connected. In a transaction, the transaction is then aborted and waits for its client to roll back. | Its connection closes, and a transaction it has open rolls back. |
| Afterwards, above the panes | The query of session N was cancelled. | Session N was terminated. |
pgjumbo sends the signal once, on Activity’s connection, and never repeats it; then it reads the server at once so the
lists show the outcome. When the session had ended already, the line says Session N had already ended. PostgreSQL
decides whether you may: a superuser, the session’s own role, or a member of pg_signal_backend (which cannot signal a
superuser’s sessions). A refusal shows in the dialog. Neither button works on Activity’s own session.
The Read-only sessions option of a server does not stop Cancel and Terminate: they are signals, not writes. A role’s own sessions can also be cancelled from its tab (Roles).
Blocking
Section titled “Blocking”Blocking shows who holds up whom, worked out from the sessions waiting for a lock (pg_blocking_pids()) and the
sessions they wait for.


- 1 How many sessions block how many others, or No session blocks another.
- 2 Session: each chain starts at the session that holds the others up, with the sessions waiting behind it indented under it (└). Each shows its pid, then its application (or its kind, or its role) and client. A session outside the database Activity keeps to shows in another database; a prepared transaction holding a lock shows as prepared transaction.
- 3 State: waiting in amber for a session that waits, else its state; then how long. A blocker that is idle in transaction is the usual culprit: it holds its locks until its client commits or rolls back.
- 4 Blocks: how many sessions wait behind this one, directly or further down the chain.
- 5 Cancel and Terminate, as in Sessions. They do not show for a prepared transaction, a session in another database or Activity’s own session.
Query shows each session’s query. A session waiting for several others sits under the first of them. The chains that hold up the most sessions come first. A deadlock the server has not broken yet shows as a chain starting at its lowest pid. The pane says No session waits for another when nothing waits.
After a cancel or a terminate, the outcome shows above the panes and the lists are read again:
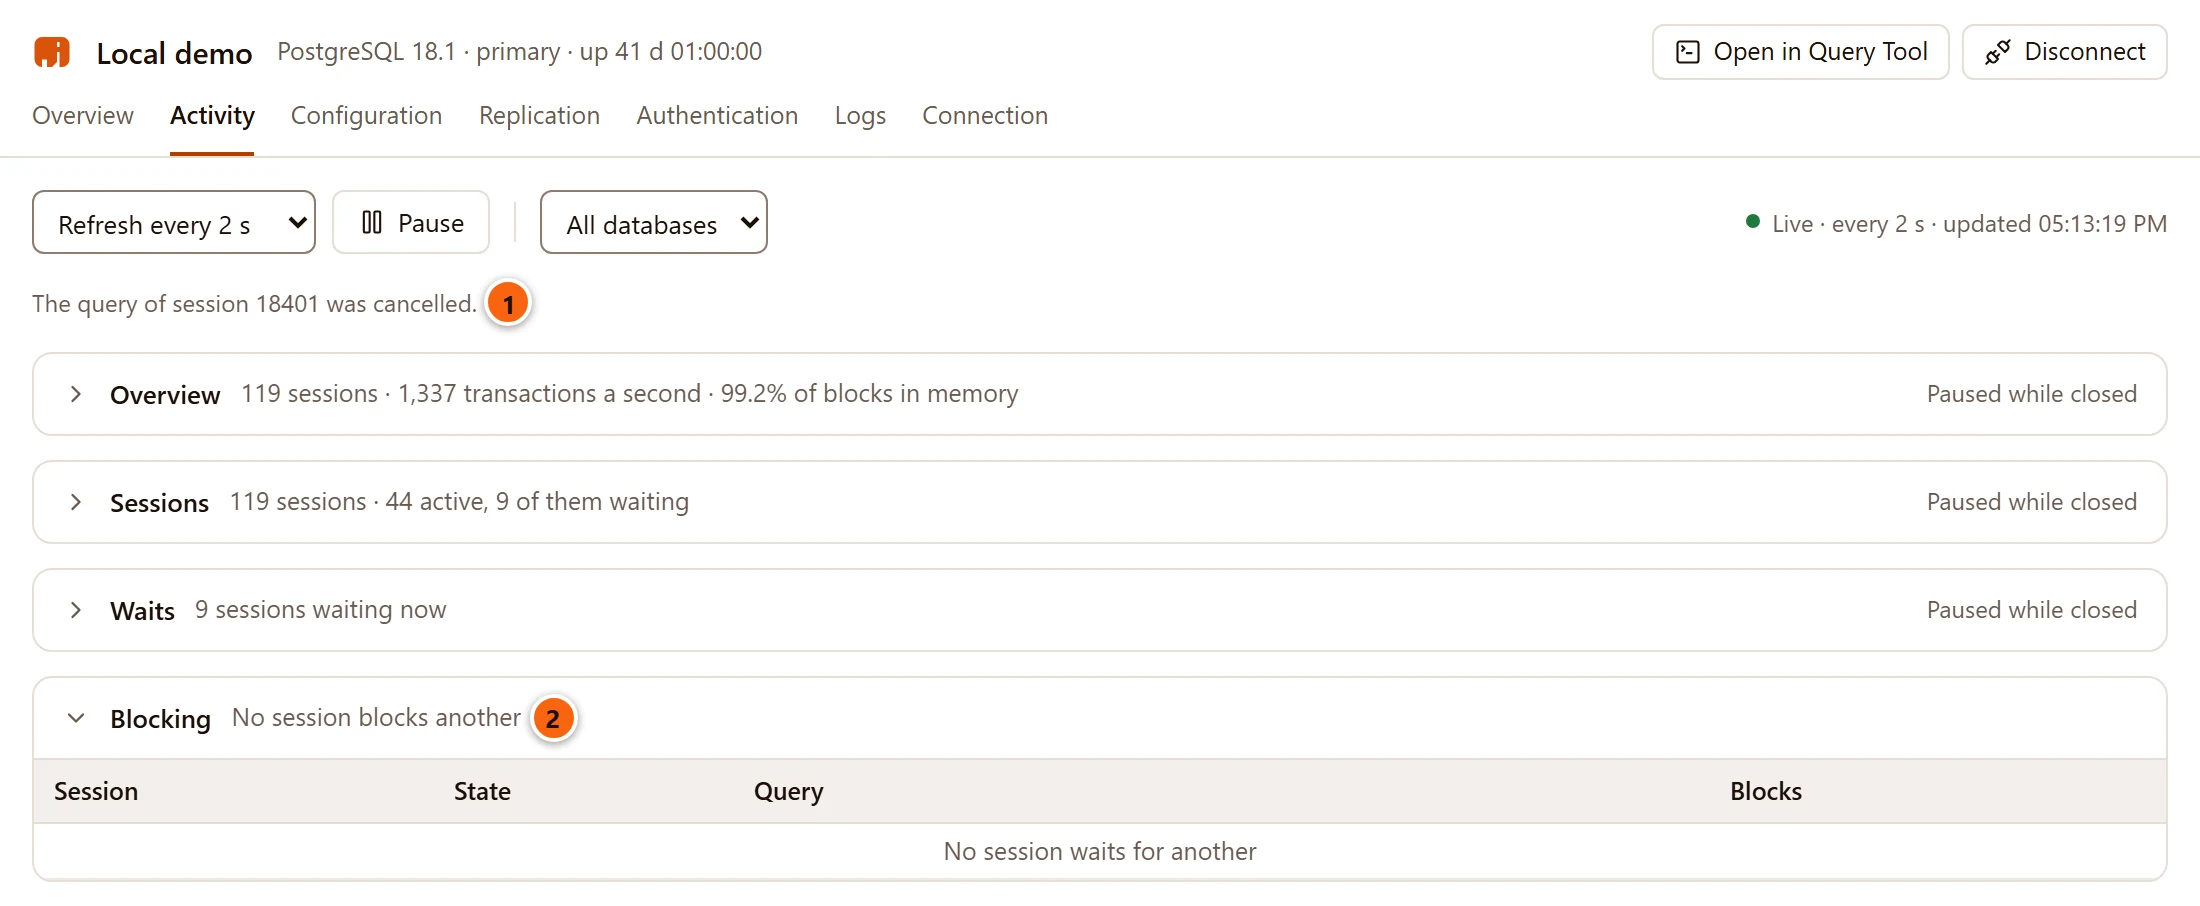

- 1 What the last Cancel or Terminate did.
- 2 The chain is gone: 18401 stopped waiting.
Waits shows what the active sessions wait on, as pg_stat_activity’s wait events, sampled at each read.
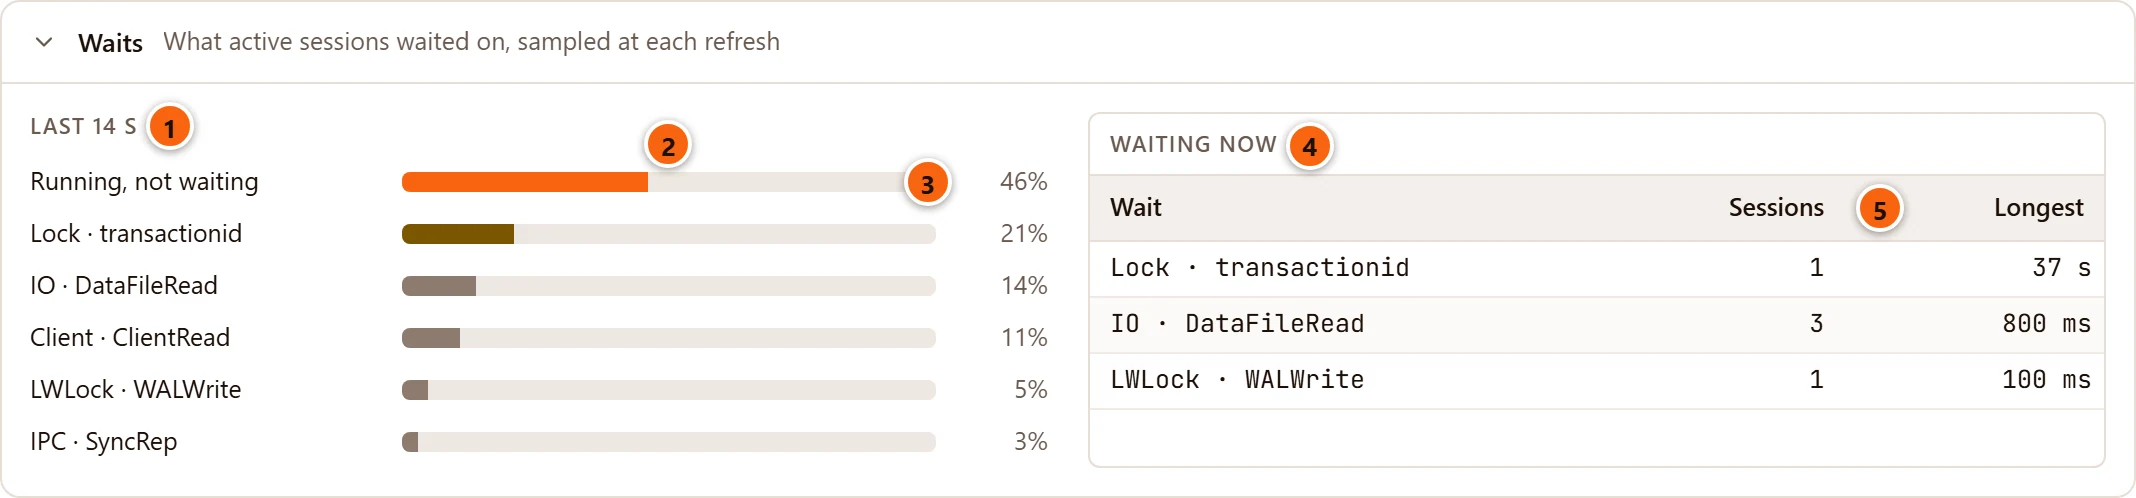
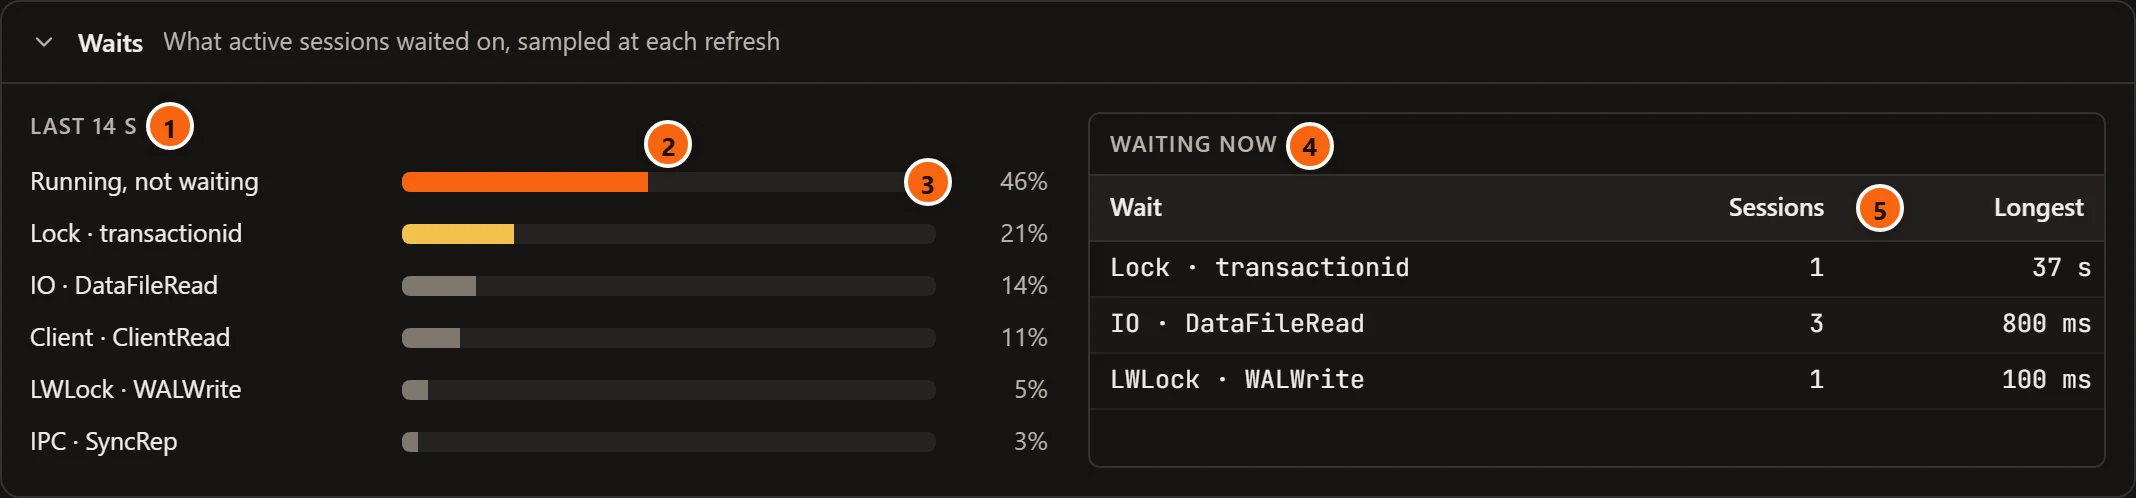
- 1 The span the samples cover: Now after one read, then Last so many seconds, up to Last 2 minutes.
- 2 Each wait, as type and event (
Lock · transactionid), with a bar for its share of the active sessions across the samples. Running, not waiting counts the active sessions that waited on nothing. Lock waits have their own colour. - 3 The share, largest first.
- 4 Waiting now: the waits of the last read.
- 5 Sessions waiting on each, and Longest: the longest any of them has been running its statement.
Activity’s own session is left out. The samples are as frequent as Refresh every; they start again when the pane closes or another database is chosen. No session was active. and No session is waiting show when there is nothing to count. For the same picture over a longer time, see the Wait events report (Reports).
Expensive queries now
Section titled “Expensive queries now”Expensive queries now lists the statements that took the most time in the last minute, from pg_stat_statements:
pgjumbo compares its counters now with those of a minute ago.


- 1 The window read so far, up to the last 60 seconds. The first read has nothing to compare with: the pane says Measured from the next refresh.
- 2 Calls in the window. Time next to it is the total execution time of those calls (planning not counted).
- 3 Mean: time per call.
- 4 Open in Query Tool opens a new Query Tool on that database with the statement in it. Nothing runs. The button is greyed out when the statement’s text could not be read (the row then says Its text could not be read.).
At most ten statements are listed, with Query (normalised, with $1 for constants, and passwords masked) and
Database. With a database chosen, only its statements count. No statement ran in this window shows when nothing
ran. For the whole history since the last reset, use the Top queries report (Reports).
pgjumbo reads pg_stat_statements in the database Activity keeps to, or in the maintenance database with All
databases. When it cannot, the pane says why, and offers Open the script in a Query Tool where a script helps:
| Message | The script offered |
|---|---|
| pg_stat_statements is not installed on this server: it comes with PostgreSQL’s contrib modules. | None: install the contrib package on the server. |
| pg_stat_statements must be loaded when the server starts: add it to shared_preload_libraries in Configuration and restart the server, then create it in database. | ALTER SYSTEM SET shared_preload_libraries = 'pg_stat_statements';, a reminder to restart, and CREATE EXTENSION pg_stat_statements; |
| The server loads pg_stat_statements, but it is not created in database, where pgjumbo reads it. | CREATE EXTENSION pg_stat_statements; |
| pg_stat_statements is created here, but the server does not load it: add it to shared_preload_libraries in Configuration and restart the server. | ALTER SYSTEM SET shared_preload_libraries = 'pg_stat_statements'; |
| Reading pg_stat_statements needs a superuser, or a member of pg_read_all_stats. | None. |
The script opens in a Query Tool for you to read and run; nothing runs from Activity. The ALTER SYSTEM line replaces
whatever shared_preload_libraries holds now, so add the libraries already loaded to it before you run it, or change
the setting in Configuration, where you see its current value.
Data file I/O
Section titled “Data file I/O”Data file I/O shows reads and writes of data files a second, by kind of server process, from pg_stat_io. It
covers the whole server, whatever database is chosen.


- 1 The rates are a second, between the last two reads. The first read says Measured from the next refresh.
- 2 Kind of process:
client backend,checkpointer,autovacuum worker,background writerand the others. Only those that did some I/O are listed, the most bytes first. - 3 In memory: the share of reads found in shared buffers.
NULLfor a process that read nothing. - 4 Fsyncs a second: how often the process forced data to disk itself.
Read, Written and Extended are bytes a second; Hits a second counts buffer hits. No process read or
wrote data files shows when nothing moved. pg_stat_io exists from PostgreSQL 16: on an older server the pane says
Data file I/O comes from pg_stat_io, which PostgreSQL 16 and later have. and reads nothing.
Locks and prepared transactions
Section titled “Locks and prepared transactions”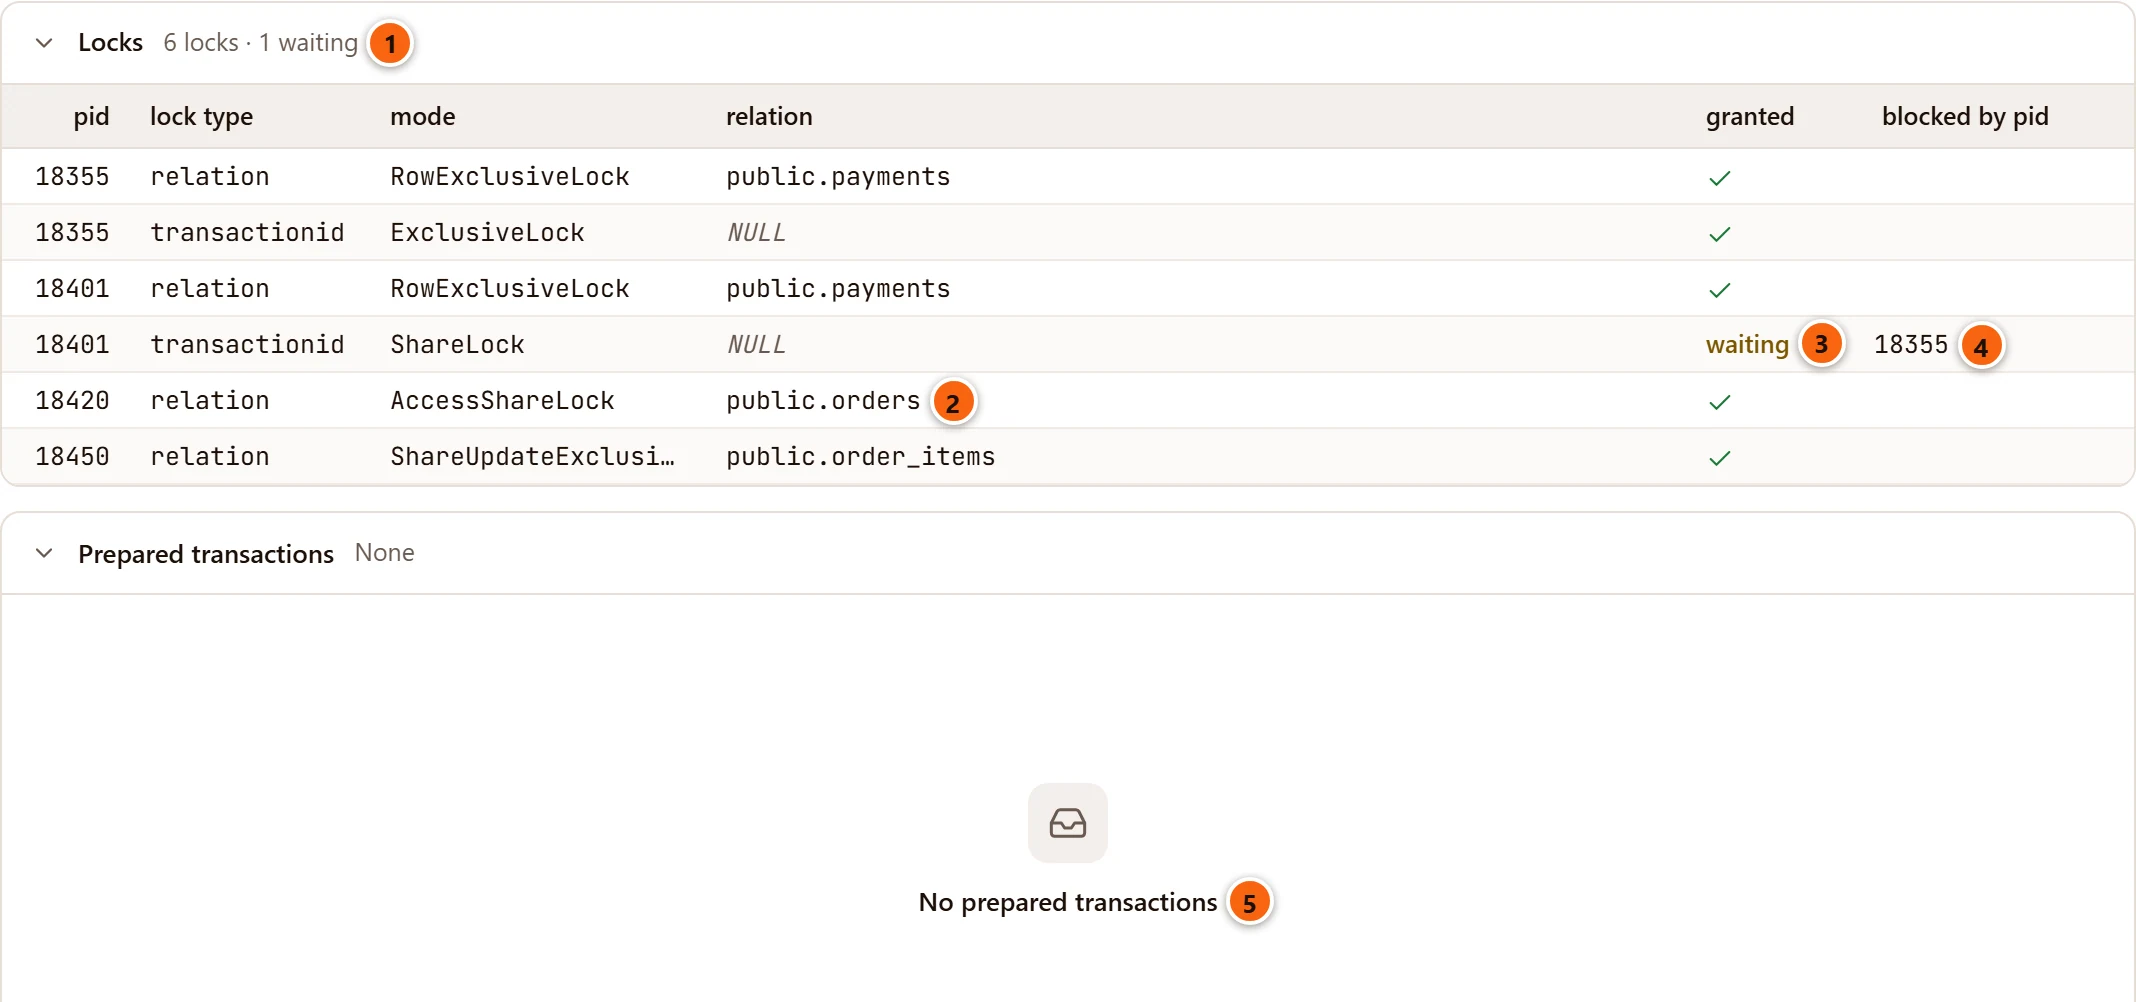
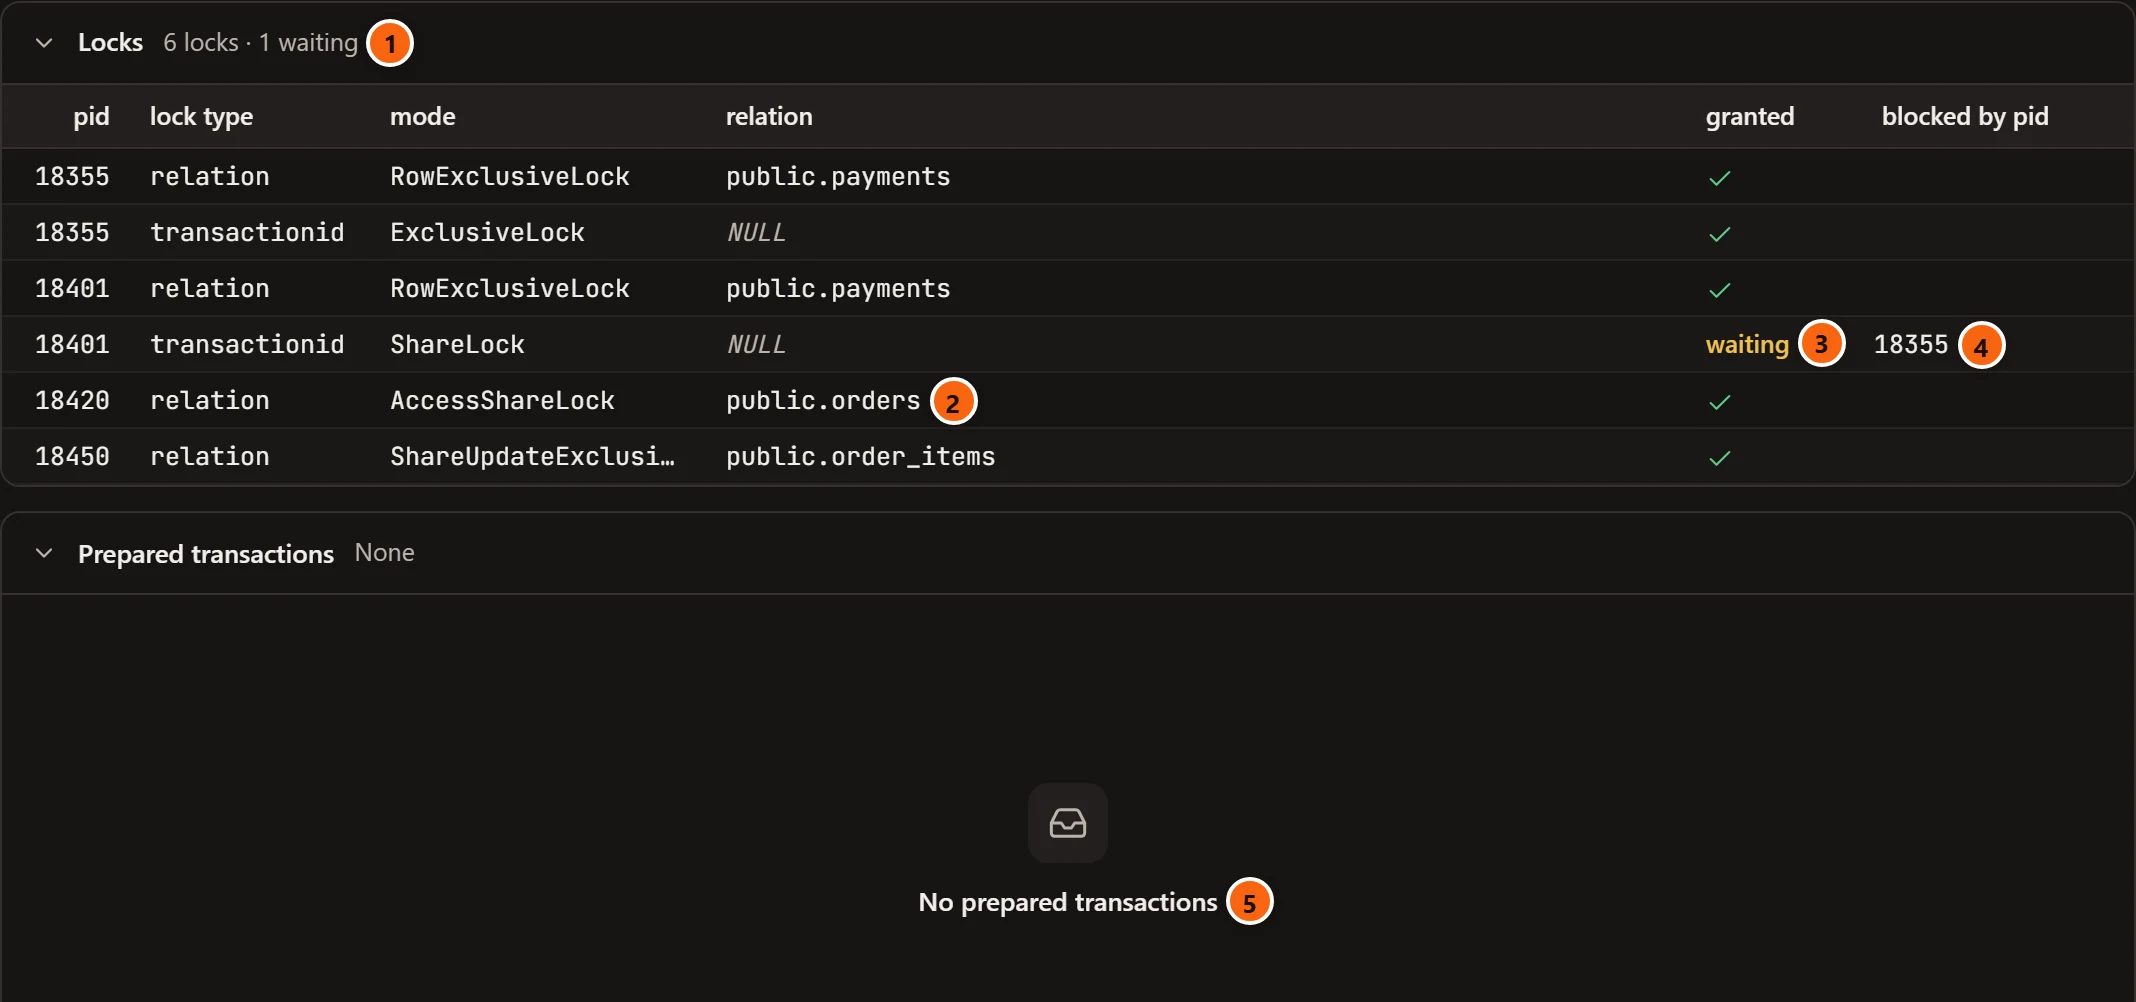
- 1 How many locks there are, and how many wait.
- 2 relation: the locked table or index, named when it is in the database Activity is on. A relation in
another database shows as
oidand its number, with the database’s name. - 3 granted: a tick, or waiting in amber.
- 4 blocked by pid: the sessions a waiting lock waits for. A prepared transaction shows as prepared transaction.
- 5 Prepared transactions: transactions prepared with
PREPARE TRANSACTIONand not committed or rolled back yet. They hold their locks until someone does.
Locks also has pid, lock type (relation, transactionid, tuple, advisory…) and mode
(AccessShareLock to AccessExclusiveLock). The list holds the locks of the sessions Activity shows, in order of pid,
and leaves out Activity’s own. At most 1,000 locks are listed, with Showing the first 1,000 of N locks. under the
list when there are more; No locks when there are none.
Prepared transactions lists each one’s transaction, gid, owner, database and when it was
prepared. pgjumbo has no button to finish one: run COMMIT PREPARED or ROLLBACK PREPARED with its gid in a
Query Tool.
Ask the Assistant
Section titled “Ask the Assistant”While the Assistant is on (Set up the Assistant), Activity has two ways to ask it:
| Button | What it asks |
|---|---|
| Ask the Assistant in the toolbar | “What is slowing this server down right now? Look at the sessions, their waits and locks, and say what to do first.” |
| The sparkles button on a row of Sessions (its tooltip: Ask the Assistant why it is still running) | “Why is session 18355 still running, and what can I do about it?”, with that row’s pid. It is greyed out on Activity’s own session. |
Each opens the Assistant pane and sends the question with the tab as its context. The Assistant reads what your access settings allow, and proposes; it never cancels or terminates anything. See Ask the Assistant.