
Reports
Reports answer questions about the longer run: which queries cost the most time, what sessions wait on, how far each database is from transaction ID wraparound, which tables take the most space. Each one reads PostgreSQL’s statistics views and changes nothing on the server. The one exception is Reset statistics… on Top queries, which asks first.
A server’s reports open in a tab of their own, one per server, named after the server: Reports · Local demo. Five reports are about the whole server. Three are about one database, and the database’s health check sits beside them.
Open the reports
Section titled “Open the reports”The server must be connected. None of these commands has a key of its own.
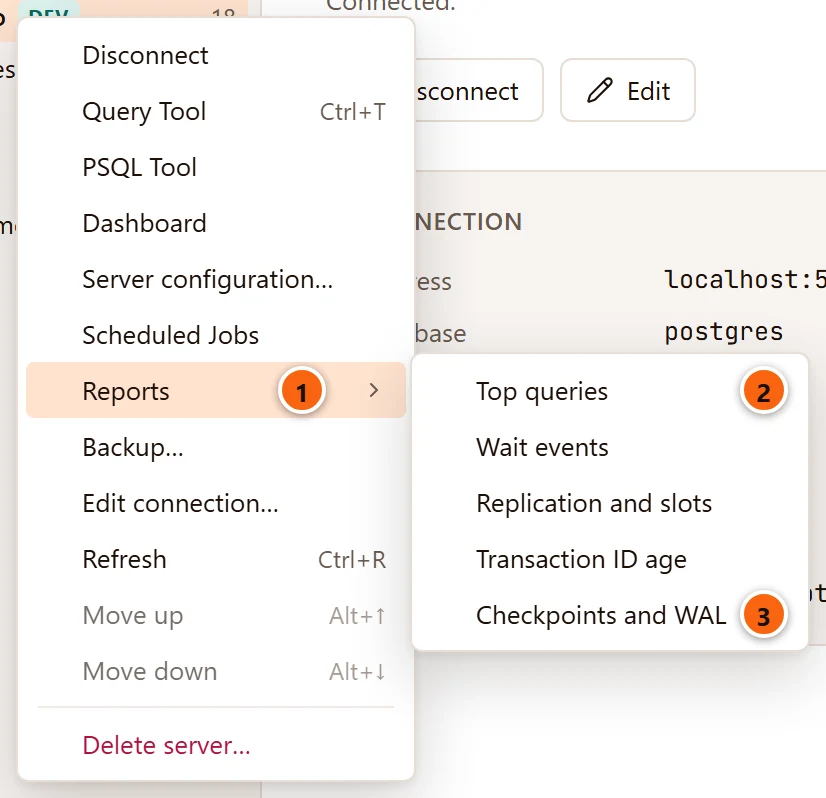
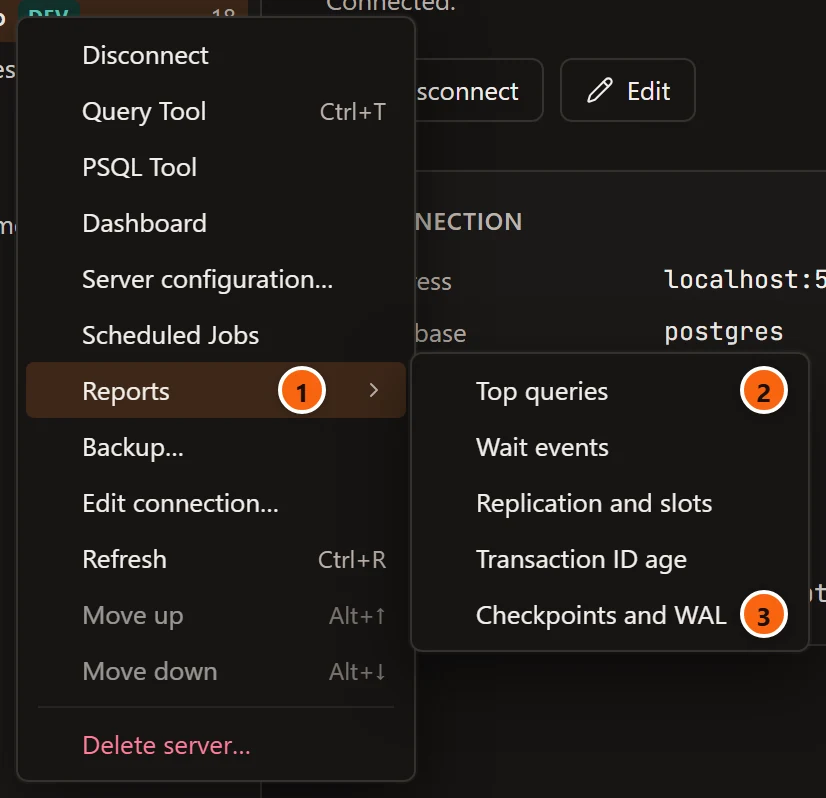
- 1 Right-click a connected server and point to Reports.
- 2 The submenu lists the server’s five reports, from Top queries…
- 3 …to Checkpoints and WAL. Choosing one opens the tab on it.
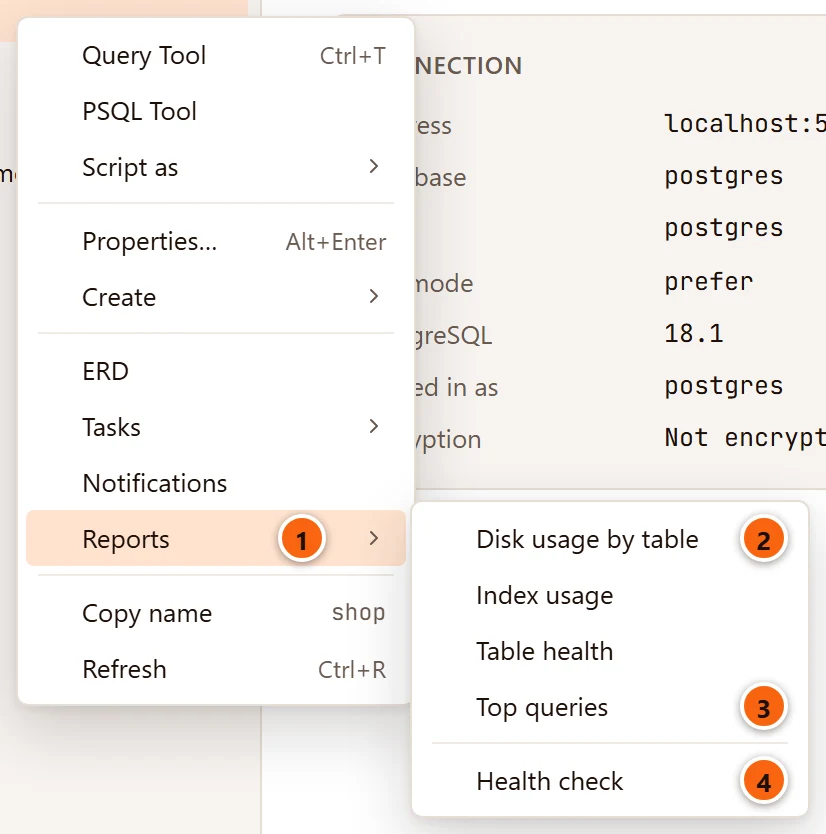
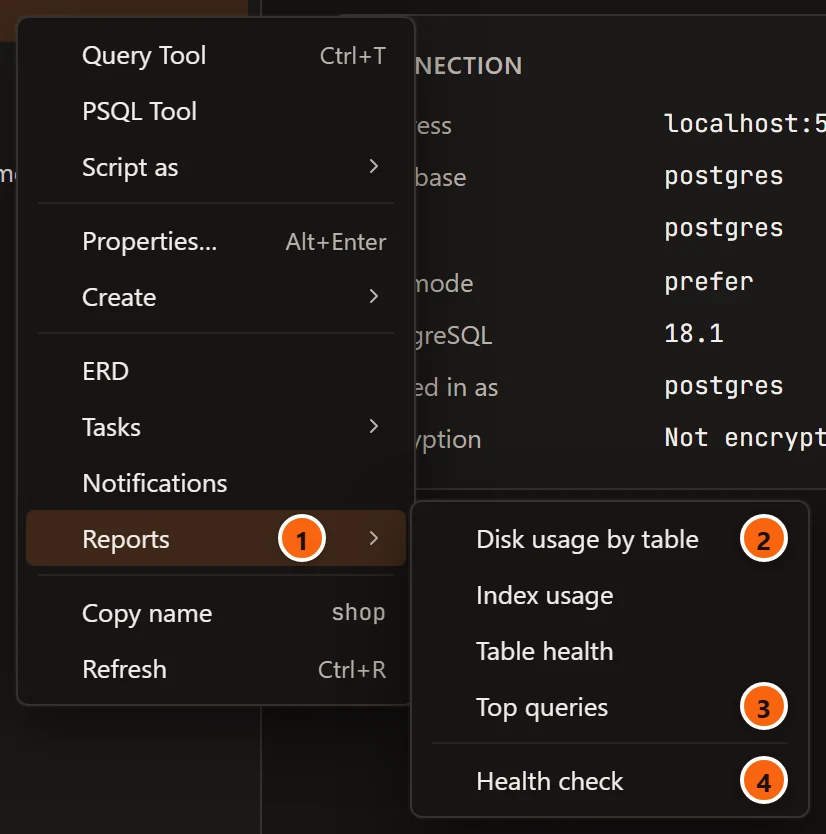
- 1 Right-click a database and point to Reports.
- 2 Disk usage by table, Index usage and Table health read this database.
- 3 Top queries opens with its Database filter set to this database.
- 4 Health check runs the health check on this database.
Template databases, which the Explorer lists when it shows system objects, have no Reports menu.
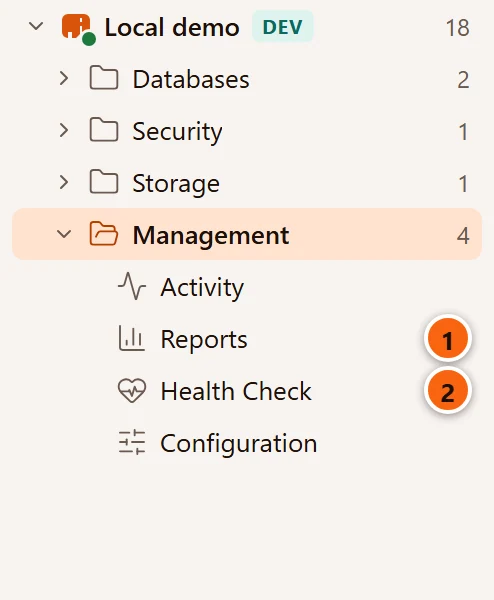
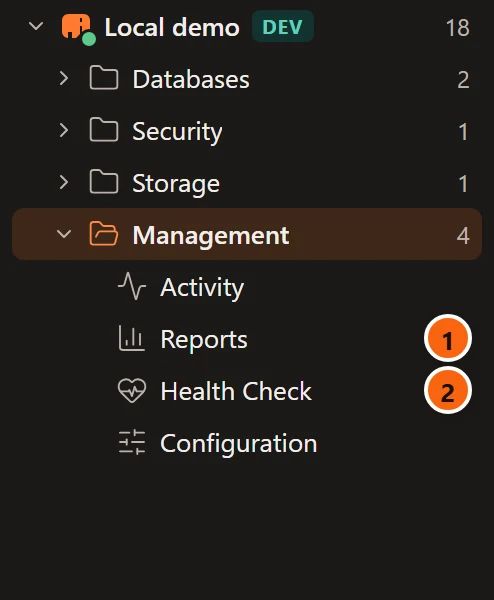
- 1 Under a connected server, Management ▸ Reports opens the tab on Top queries. Double-click the row, press ↩︎ (Enter on Windows and Linux) on it, or right-click it and choose Open.
- 2 Health Check runs the health check on the server’s maintenance database (the database its connection names). When the server’s reports tab is open already, it checks the database the tab’s picker names instead.
Every way to open a report:
| Where | What it opens |
|---|---|
| Right-click a server, Reports, then a report | That server report. |
| Right-click a database, Reports, then a report | One of the database’s reports, Top queries kept to that database, or its health check. |
| Right-click a table or a partitioned table, Reports, then a report | Disk usage by table, Index usage or Table health of the database the table is in. |
| Management ▸ Reports in the Explorer | Top queries. |
| ToolsReports, then a server report | That report, for the server of the row selected in the Explorer (the server itself or anything under it). When that server is not connected, or nothing is selected, it uses the server of the Query Tool, object or server tab in front. The items are greyed out when neither is connected. |
| ToolsReports, then a database report | That report, for the database selected in the Explorer, or for the database of the selected table. These items are greyed out until a database, a table or a partitioned table of a connected server is selected. |
When the server’s reports tab is open already, pgjumbo brings it to the front and switches it to the report you chose, instead of opening a second tab. The tab keeps its database picker and its Top queries filter, unless the way you opened it names a database.
The reports tab
Section titled “The reports tab”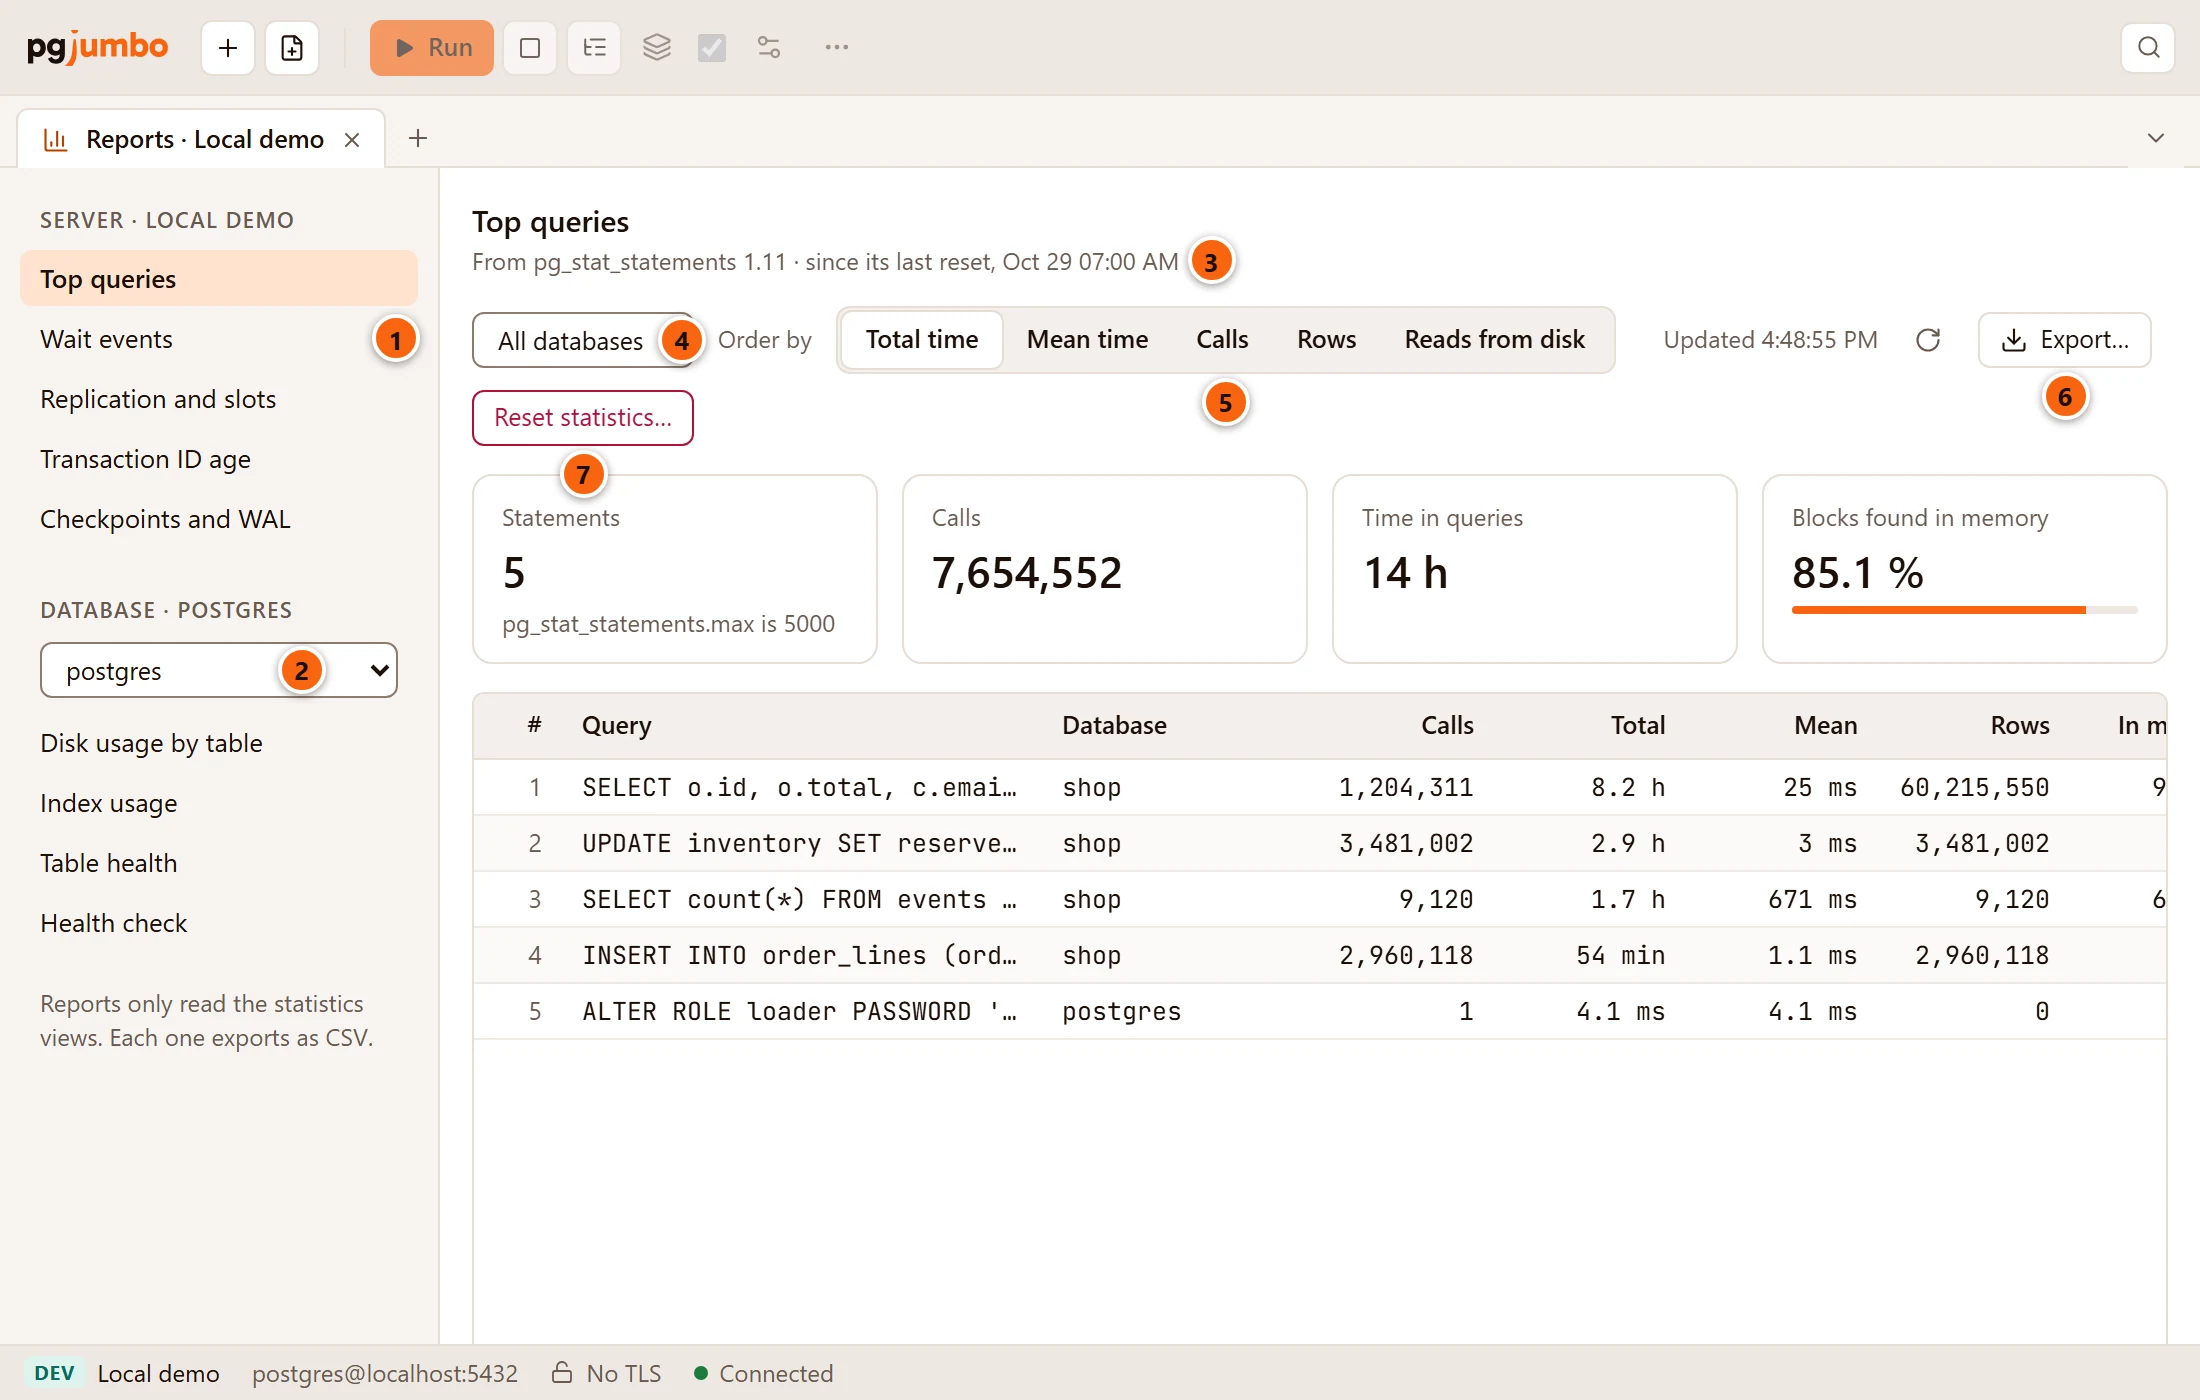
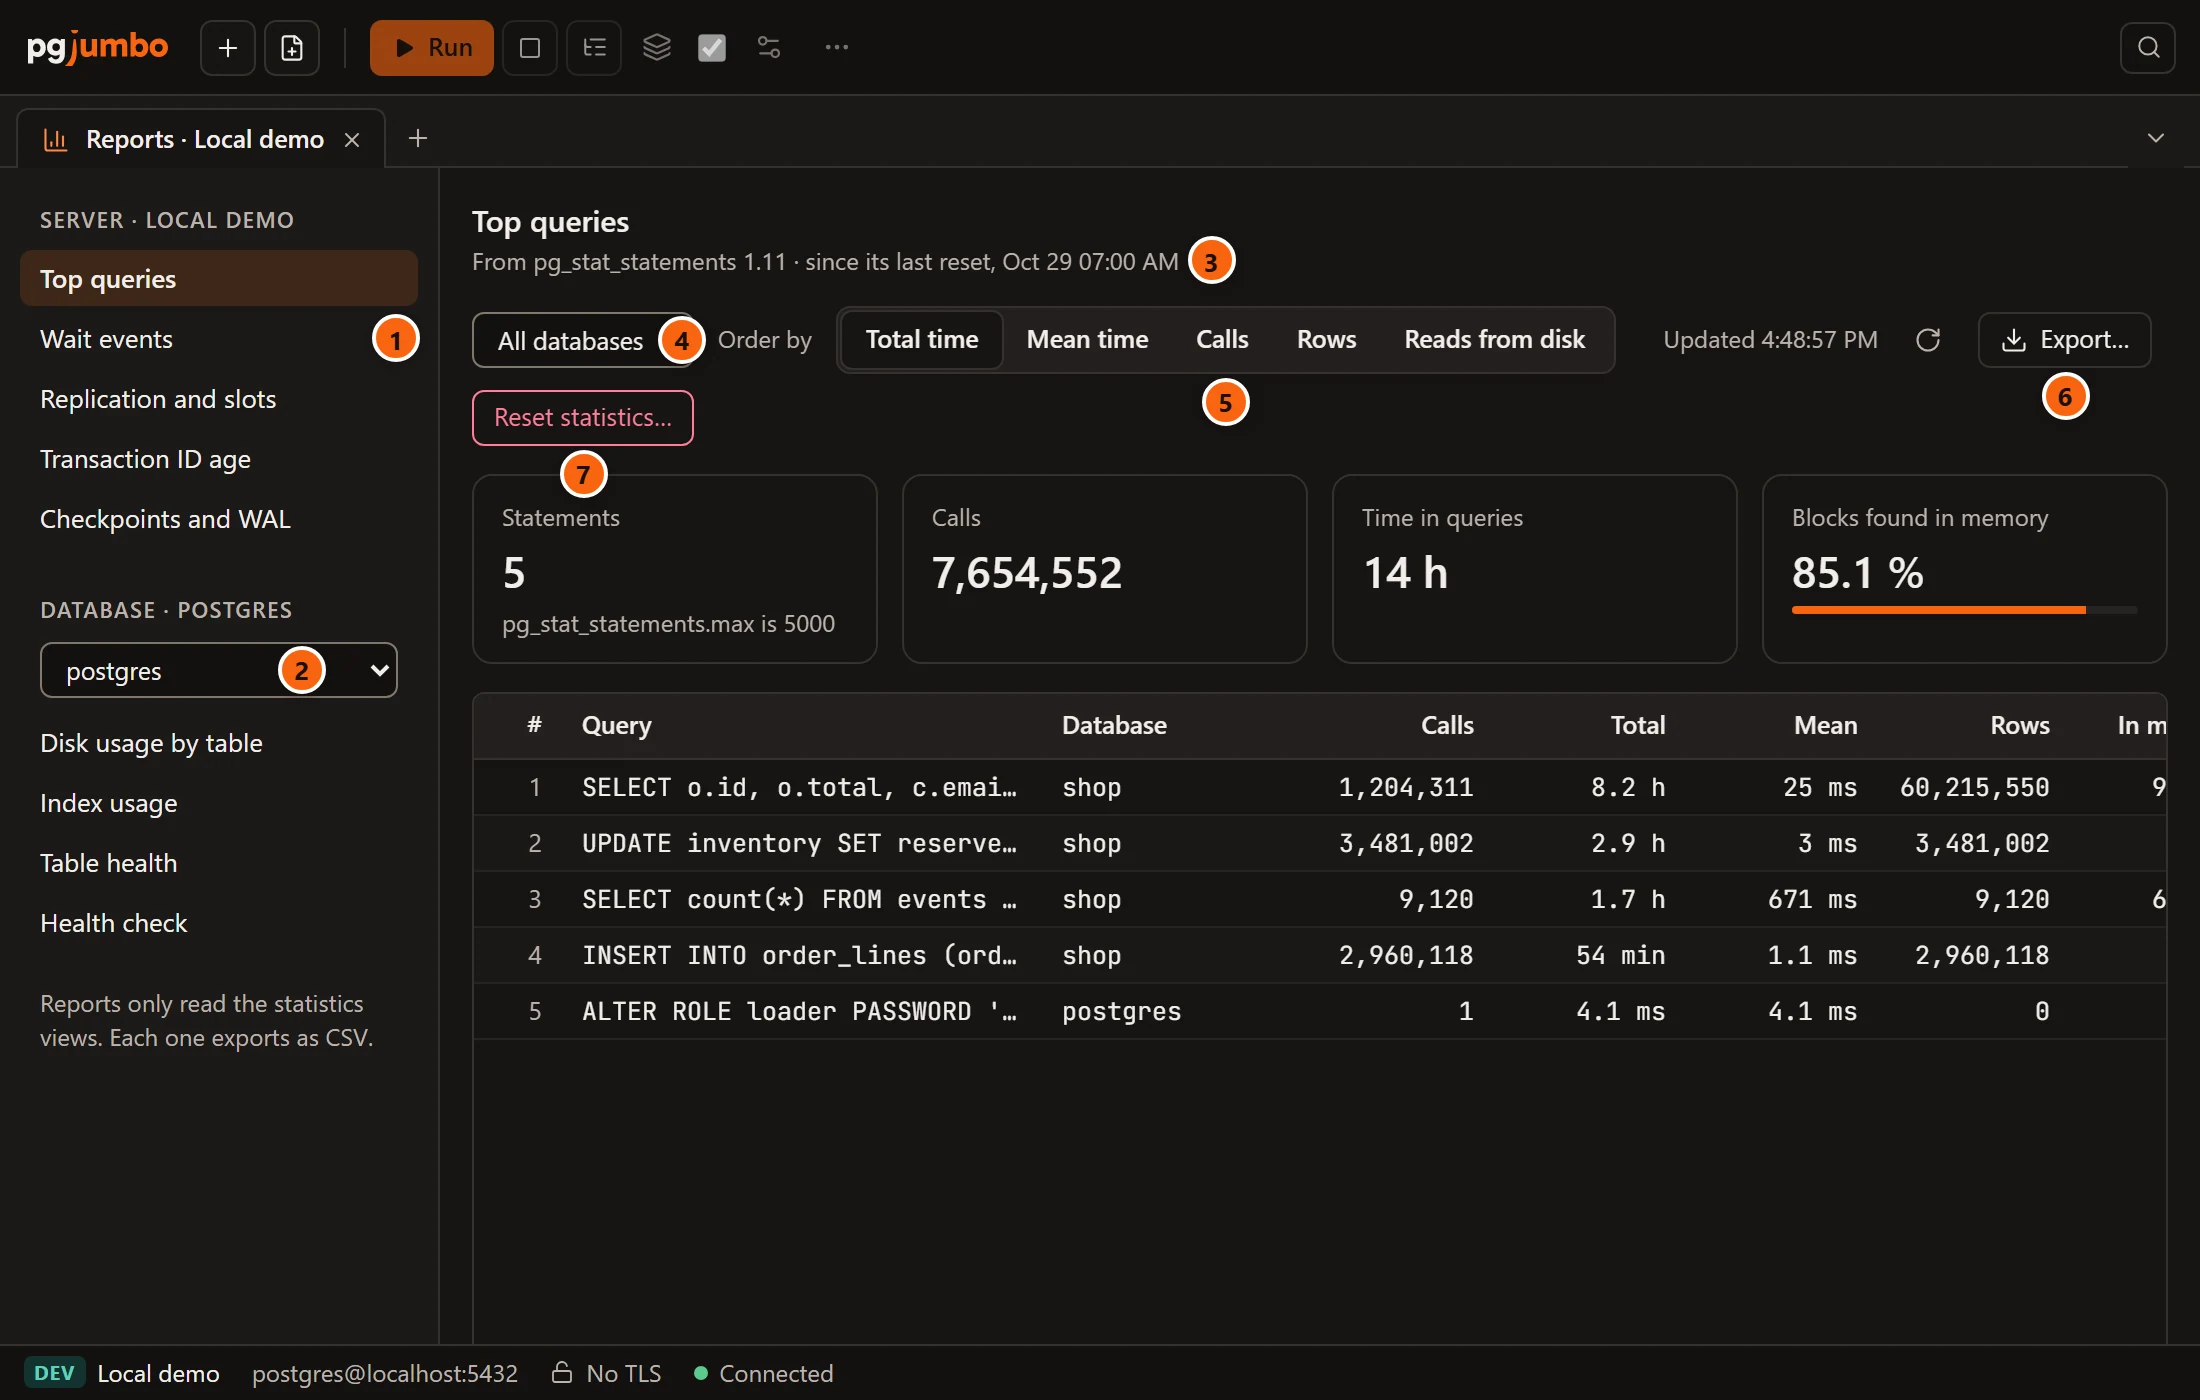
- 1 The server’s reports, under Server · Local demo. Click one to show it.
- 2 The database picker and, under it, the database’s reports and Health check. The picker chooses the database those four read; see Choose the database.
- 3 Where the numbers come from and since when they count: From pg_stat_statements 1.11 · since its last reset, Oct 29 07:00 AM. When a report shows only the first rows of a longer list, the line ends with, for example, the first 200 of 1,250 shown.
- 4 On Top queries only: the statements of All databases, or of the one you choose.
- 5 On Top queries only: Order by Total time, Mean time, Calls, Rows or Reads from disk.
- 6 Export… saves the report as a CSV file; see Export a report. The round arrow left of it, Read again, reads the statistics again; it is greyed out while a read is under way. Updated says when they were last read.
- 7 On Top queries only: Reset statistics… empties pg_stat_statements; see Reset statistics.
Below the bar, each report leads with a few totals in boxes. A total that is a percentage has a thin bar under it. Then comes the report’s table, its rows numbered in the # column. A column that holds a share, such as Share of time, draws it as a bar beside the number. Hover over a value cut short to read it in full; the tooltip shows it as the server gave it, so a size is in bytes and a time in milliseconds.
Click a row to choose it. A box under the table then shows the values the table leaves out to keep its width: the user and the slowest call of a statement, what a wait event means, an index’s definition. A long text reads as a paragraph there. Choosing another report, database, filter or order clears the row chosen.
The table keeps its height, so in a small window you scroll the tab to reach the box under it. The tab reads its report only while it is in front. While it reads, it says Reading the statistics… (Wait events says Looking at the sessions…). An error from the server shows in place of the table. When the server is disconnected, the tab says Local demo is not connected. and shows nothing until you connect again.
The note under the list on the left says Reports only read the statistics views. Each one exports as CSV.
Choose the database
Section titled “Choose the database”Disk usage by table, Index usage, Table health and Health check read one database. The label above the picker names it: Database · postgres. The tab starts on the server’s maintenance database, or on the database you right-clicked or selected (the table’s database, from a table). Choose another database in the picker and the report on show reads it at once. The picker lists the server’s databases; it is greyed out until pgjumbo has read them.
The server’s reports do not change with the picker. They read the maintenance database, and what they report covers every database.
Top queries
Section titled “Top queries”Top queries lists the statements the pg_stat_statements extension has counted, the most expensive first. It shows
at most 100 statements, and the source line says how many there are in all when there are more.
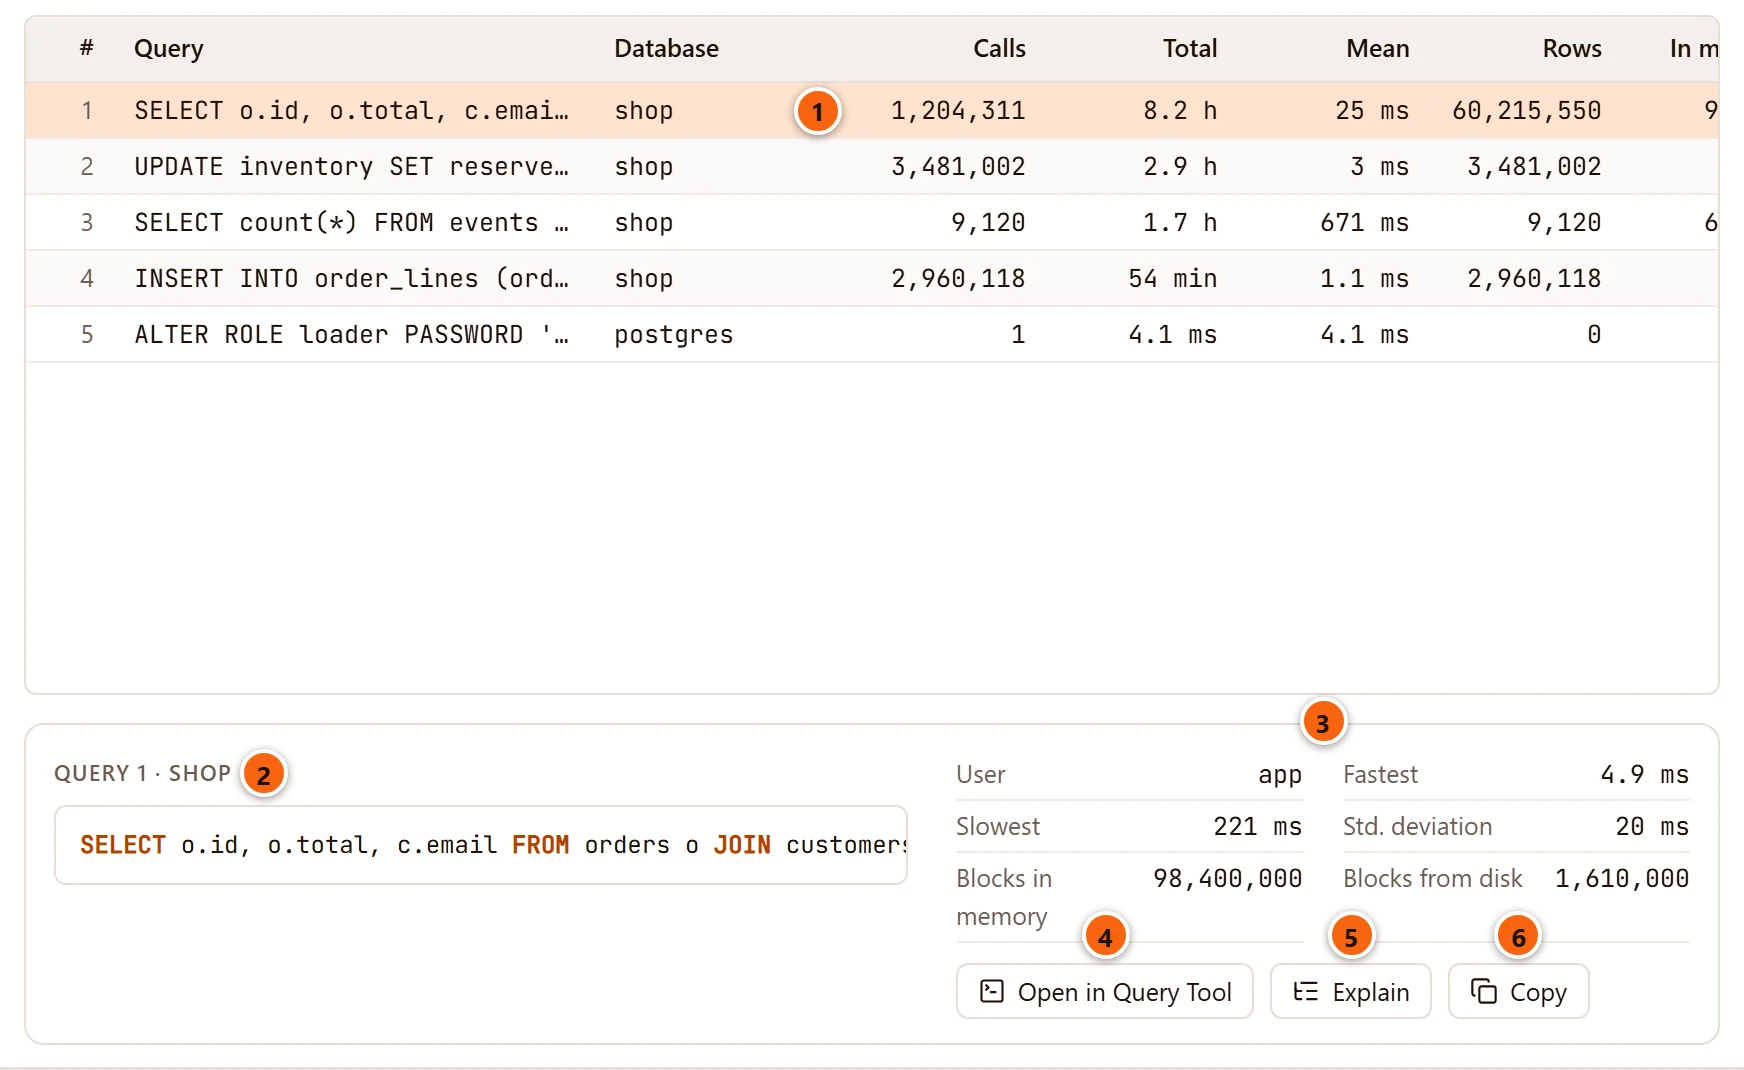
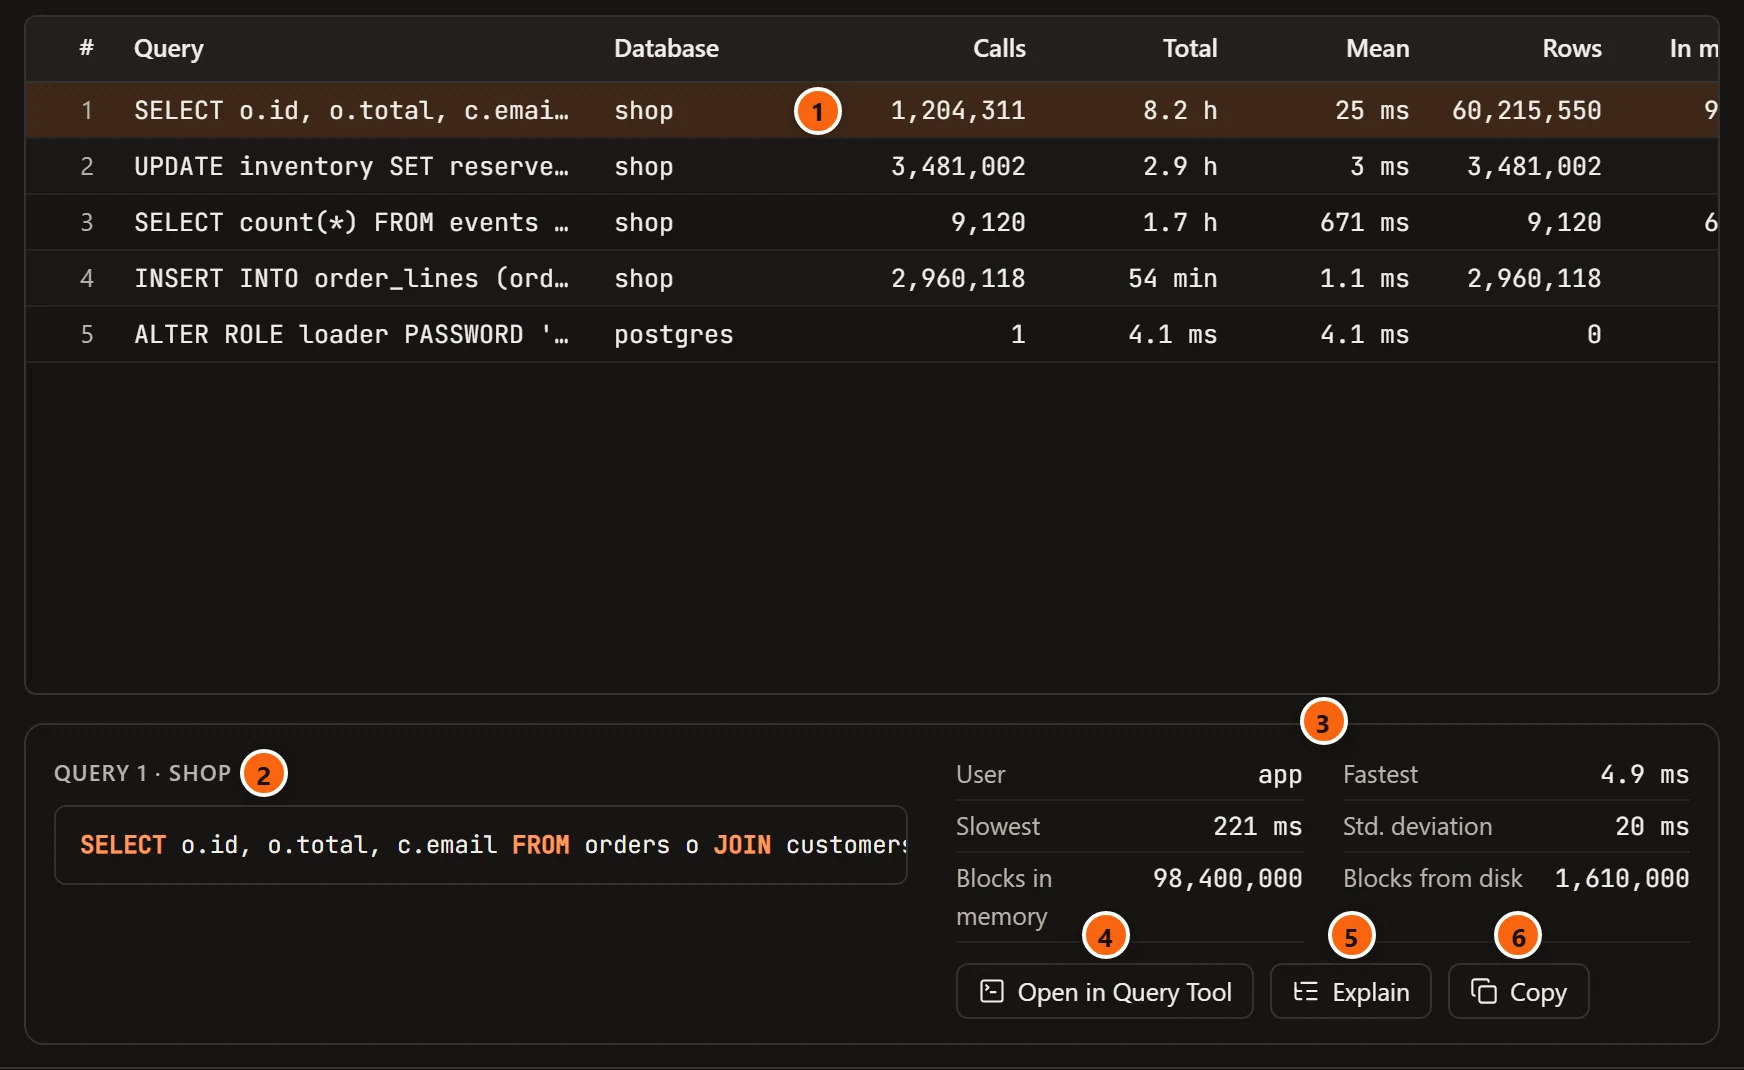
- 1 Click a statement to choose it.
- 2 Query 1 · shop: its number in the list and the database it ran in, with the whole statement below.
- 3 What the table leaves out: User, Fastest, Slowest, Std. deviation, Blocks in memory and Blocks from disk.
- 4 Open in Query Tool opens the statement in a new Query Tool tab on the database it ran in. Nothing runs until you run it.
- 5 Explain opens
EXPLAIN (GENERIC_PLAN)followed by the statement in a new Query Tool tab, ready to run.GENERIC_PLANplans a statement that still has its$1,$2parameters, so the button is there only on PostgreSQL 16 or later. See Explain a query. - 6 Copy copies the whole statement to the clipboard.
pg_stat_statements groups statements by their shape and replaces their constants with $1, $2 and so on, so a
statement here is a pattern rather than one call. pgjumbo masks passwords in it, as the
query history does: ALTER ROLE loader PASSWORD '********'.
The totals at the top:
| Total | What it says |
|---|---|
| Statements | How many statements pg_stat_statements keeps now, and pg_stat_statements.max, the most it keeps. |
| Calls | How many times they ran, in all. |
| Time in queries | The time they took, in all. |
| Blocks found in memory | The share of blocks they found in shared buffers rather than reading them from the disk or the operating system’s cache. |
The table’s columns:
| Column | What it shows |
|---|---|
| Query | The statement. |
| Database | The database it ran in. |
| Calls | How many times it ran. |
| Total | The time all its calls took. |
| Mean | The time one call takes on average. |
| Rows | The rows its calls returned or changed, in all. |
| In memory | The share of its blocks found in shared buffers. |
| Share of time | Its share of the time all statements took, as a bar. |
| User, Fastest, Slowest, Std. deviation, Blocks in memory, Blocks from disk | Shown for the statement chosen: the role that ran it, its fastest and slowest call, how much its calls vary, and the shared blocks it found in memory and read from outside. |
Times are execution times. From PostgreSQL 13, pg_stat_statements counts planning apart, and this report leaves it
out. PostgreSQL 14 and later record when the statistics were last reset, so only there does the source line say
since when the numbers count.
Database above the table keeps the list to one database, or shows All databases. Order by sorts the statements before the 100 are taken: Total time finds what costs the server the most, Mean time the slowest single calls, Calls the busiest, Rows those that return or change the most rows, Reads from disk those that read the most blocks from outside shared buffers.
When Top queries cannot be read
Section titled “When Top queries cannot be read”pg_stat_statements must be loaded when the server starts and created in the database pgjumbo reads it from, which is
the server’s maintenance database. When something is missing, the report says what, in place of the table. In these
messages postgres stands for your maintenance database:
| What the report says | What to do |
|---|---|
| pg_stat_statements is not installed on this server: it comes with PostgreSQL’s contrib modules. | Install your system’s PostgreSQL contrib package on the server. |
| pg_stat_statements must be loaded when the server starts: add it to shared_preload_libraries in Configuration and restart the server, then create it in postgres. | Add it to shared_preload_libraries, restart, then run CREATE EXTENSION pg_stat_statements;. |
| The server loads pg_stat_statements, but it is not created in postgres, where pgjumbo reads it. | Run CREATE EXTENSION pg_stat_statements; in that database. |
| pg_stat_statements is created here, but the server does not load it: add it to shared_preload_libraries in Configuration and restart the server. | Add it to shared_preload_libraries and restart. |
| Reading pg_stat_statements needs a superuser, or a member of pg_read_all_stats. | Connect as such a role, or have one grant you pg_read_all_stats. |
Where a statement helps, the report shows it under What would turn it on, with Open in Query Tool, which opens
it in a new Query Tool tab on the maintenance database. Nothing runs until you run it, and the restart is yours to do.
You can also change shared_preload_libraries in the Configuration view. On Amazon RDS
and Aurora the setting lives in the parameter group; see Amazon RDS and Aurora.
Reset statistics… is greyed out while the report cannot be read.
Reset statistics
Section titled “Reset statistics”Reset statistics… empties pg_stat_statements, so that Top queries counts from now on. Use it after you add an
index or change a setting, to see what the server does from then on.
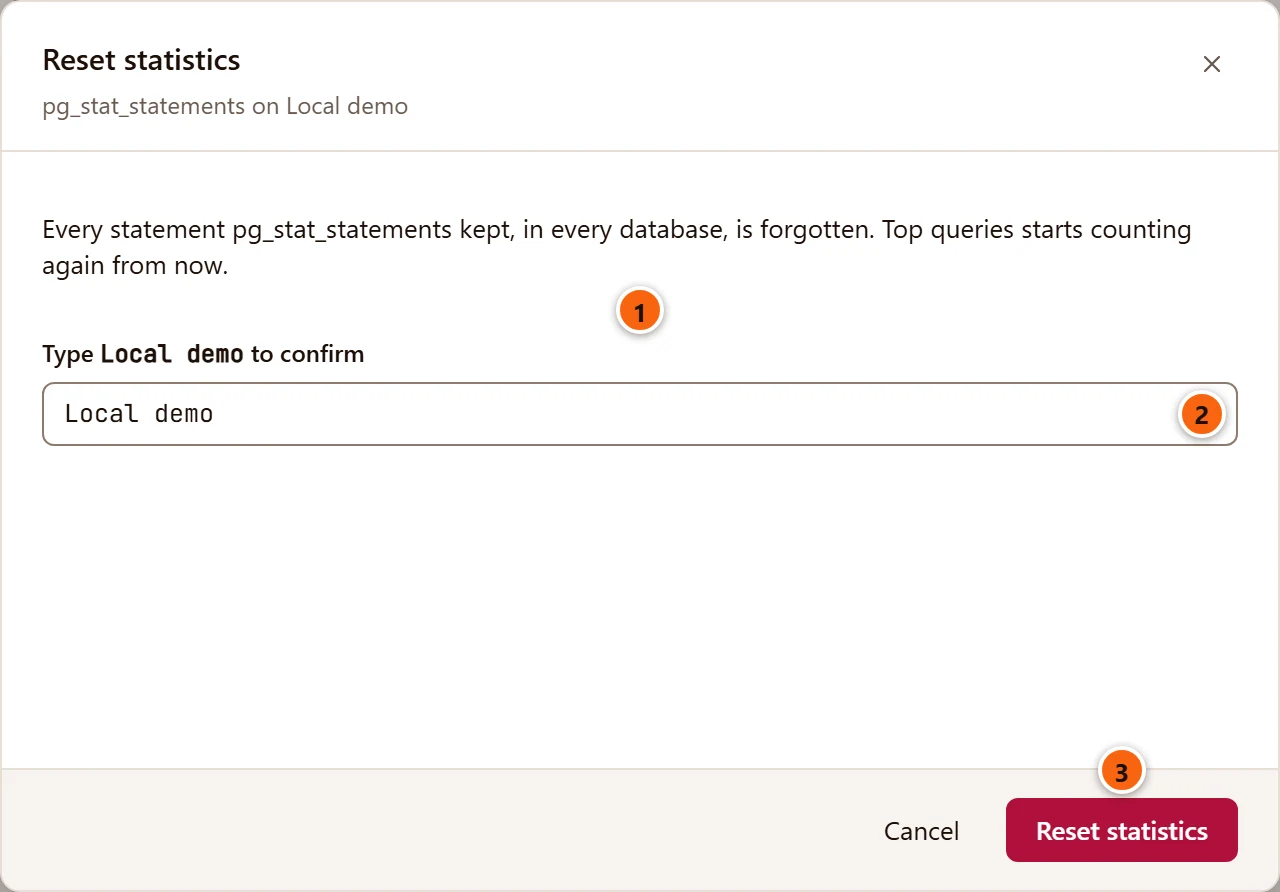
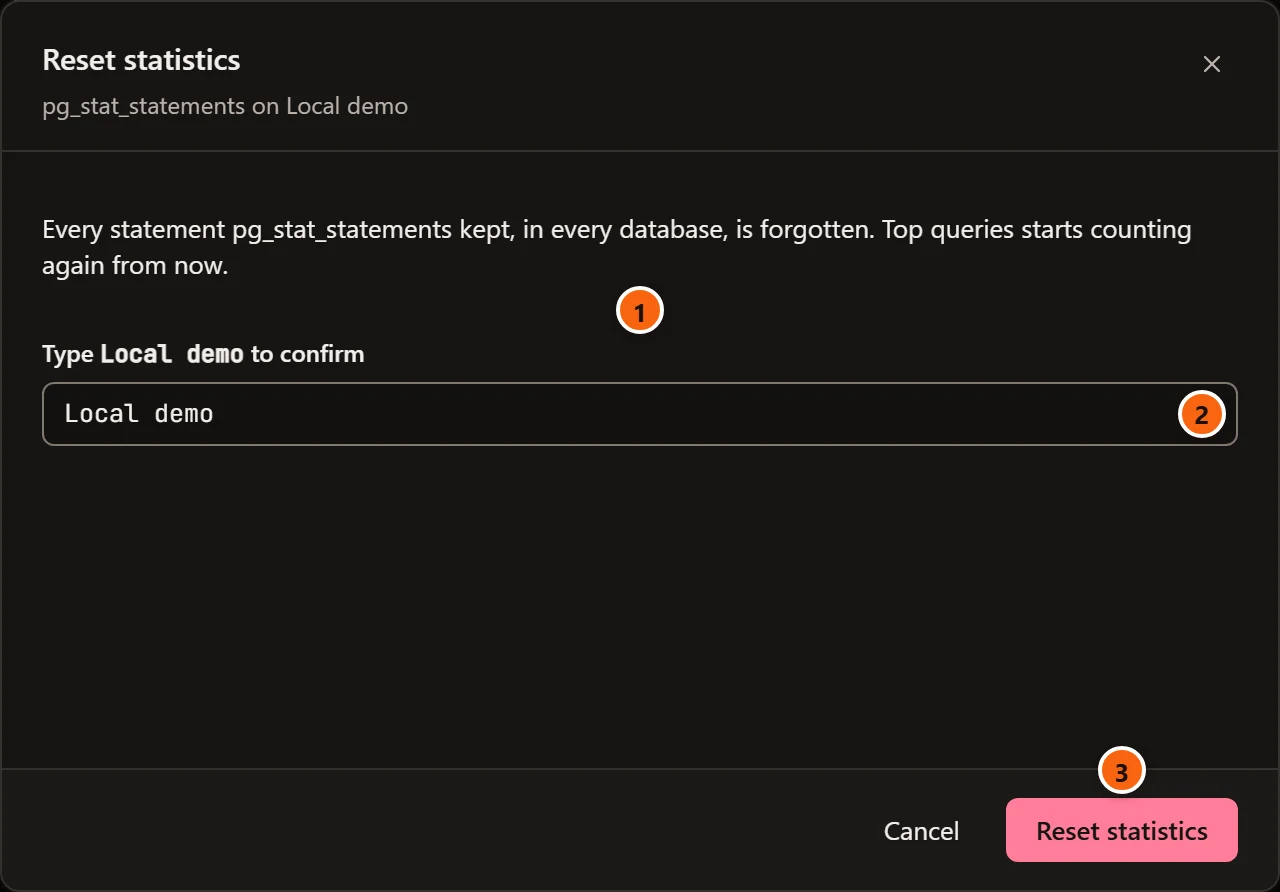
- 1 What it does: Every statement pg_stat_statements kept, in every database, is forgotten. Top queries starts counting again from now.
- 2 On a Production server, and on a Staging server when Settings has Staging servers ask before destructive statements too ticked, you type the server’s name first.
- 3 Reset statistics runs
pg_stat_statements_reset()once, on a connection of its own to the maintenance database. It says Resetting… meanwhile; then the dialog closes and Top queries reads the statistics again. Cancel, × and Esc close the dialog without resetting.
PostgreSQL lets a superuser run it, or a role granted EXECUTE on the function; any other role gets PostgreSQL’s
error in the dialog. On a server whose connection has Read-only sessions on, pgjumbo refuses with
pgjumbo opens this server read-only: turn Read-only off in the server’s connection first.
See Connection settings.
Wait events
Section titled “Wait events”Wait events shows what the server’s sessions spend their time waiting on, right now. pgjumbo looks at
pg_stat_activity 15 times, 100 milliseconds apart, and counts what it saw, so the report takes about a second and a
half. It leaves out idle sessions, its own session, and background processes that are only waiting for work.
Read again looks again.
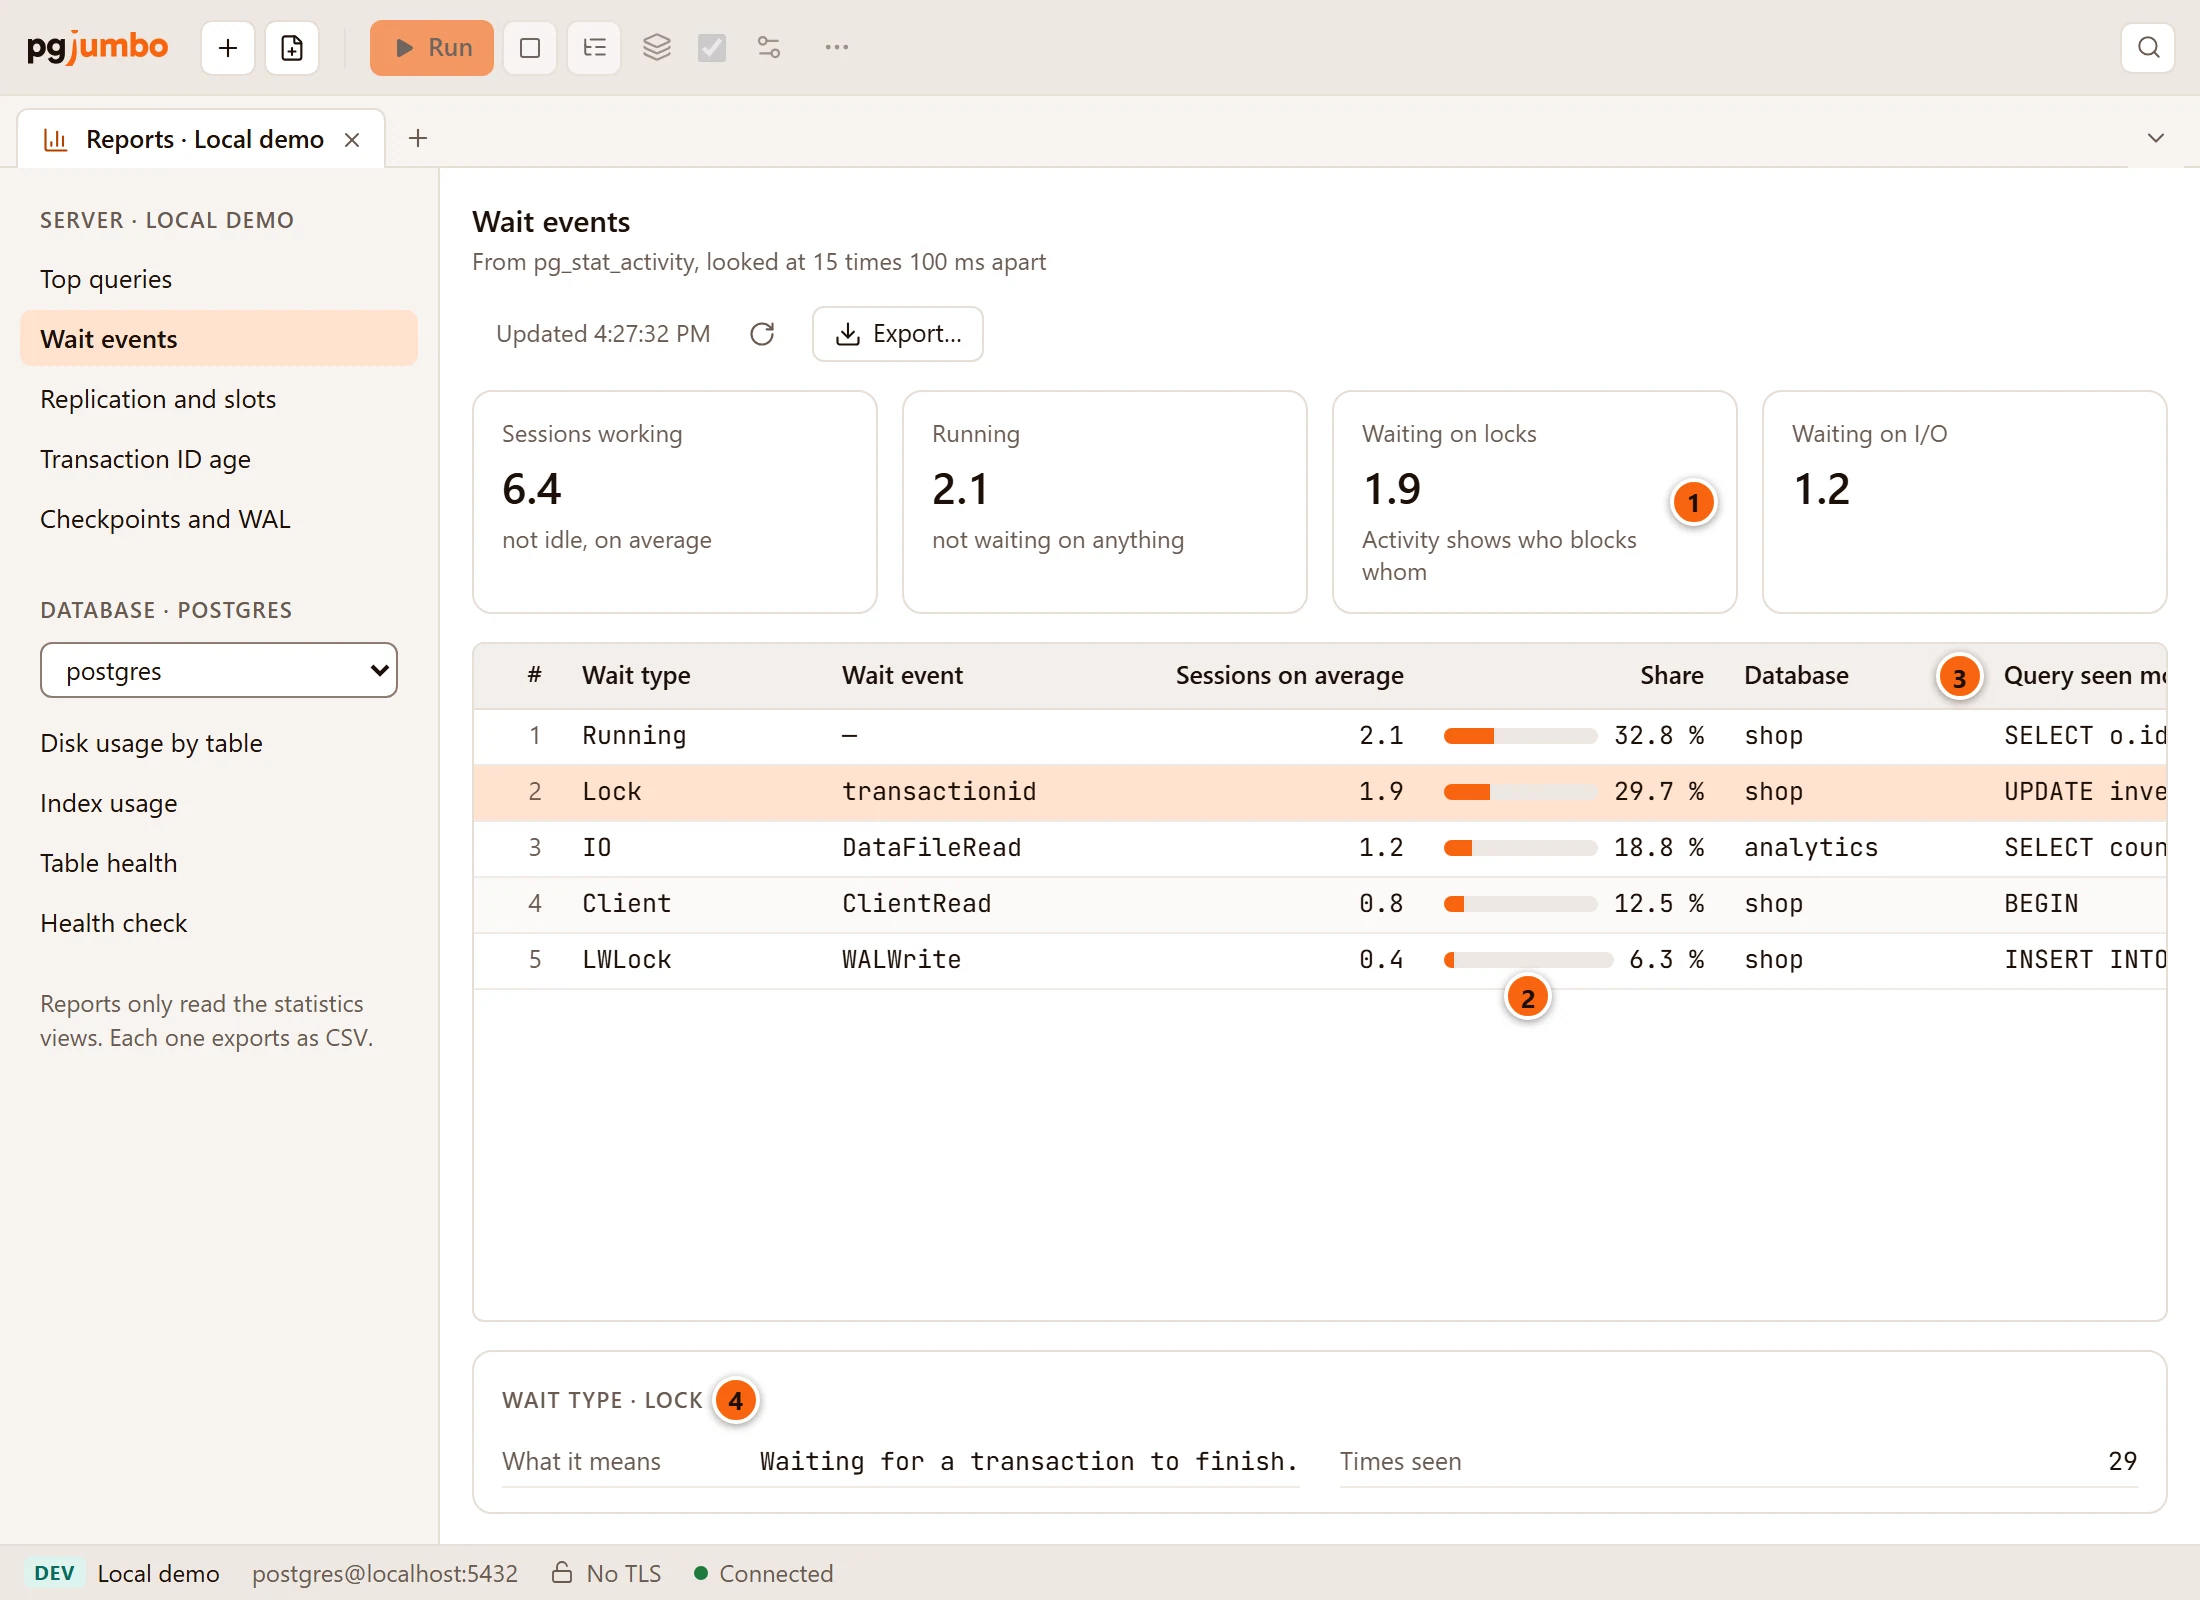
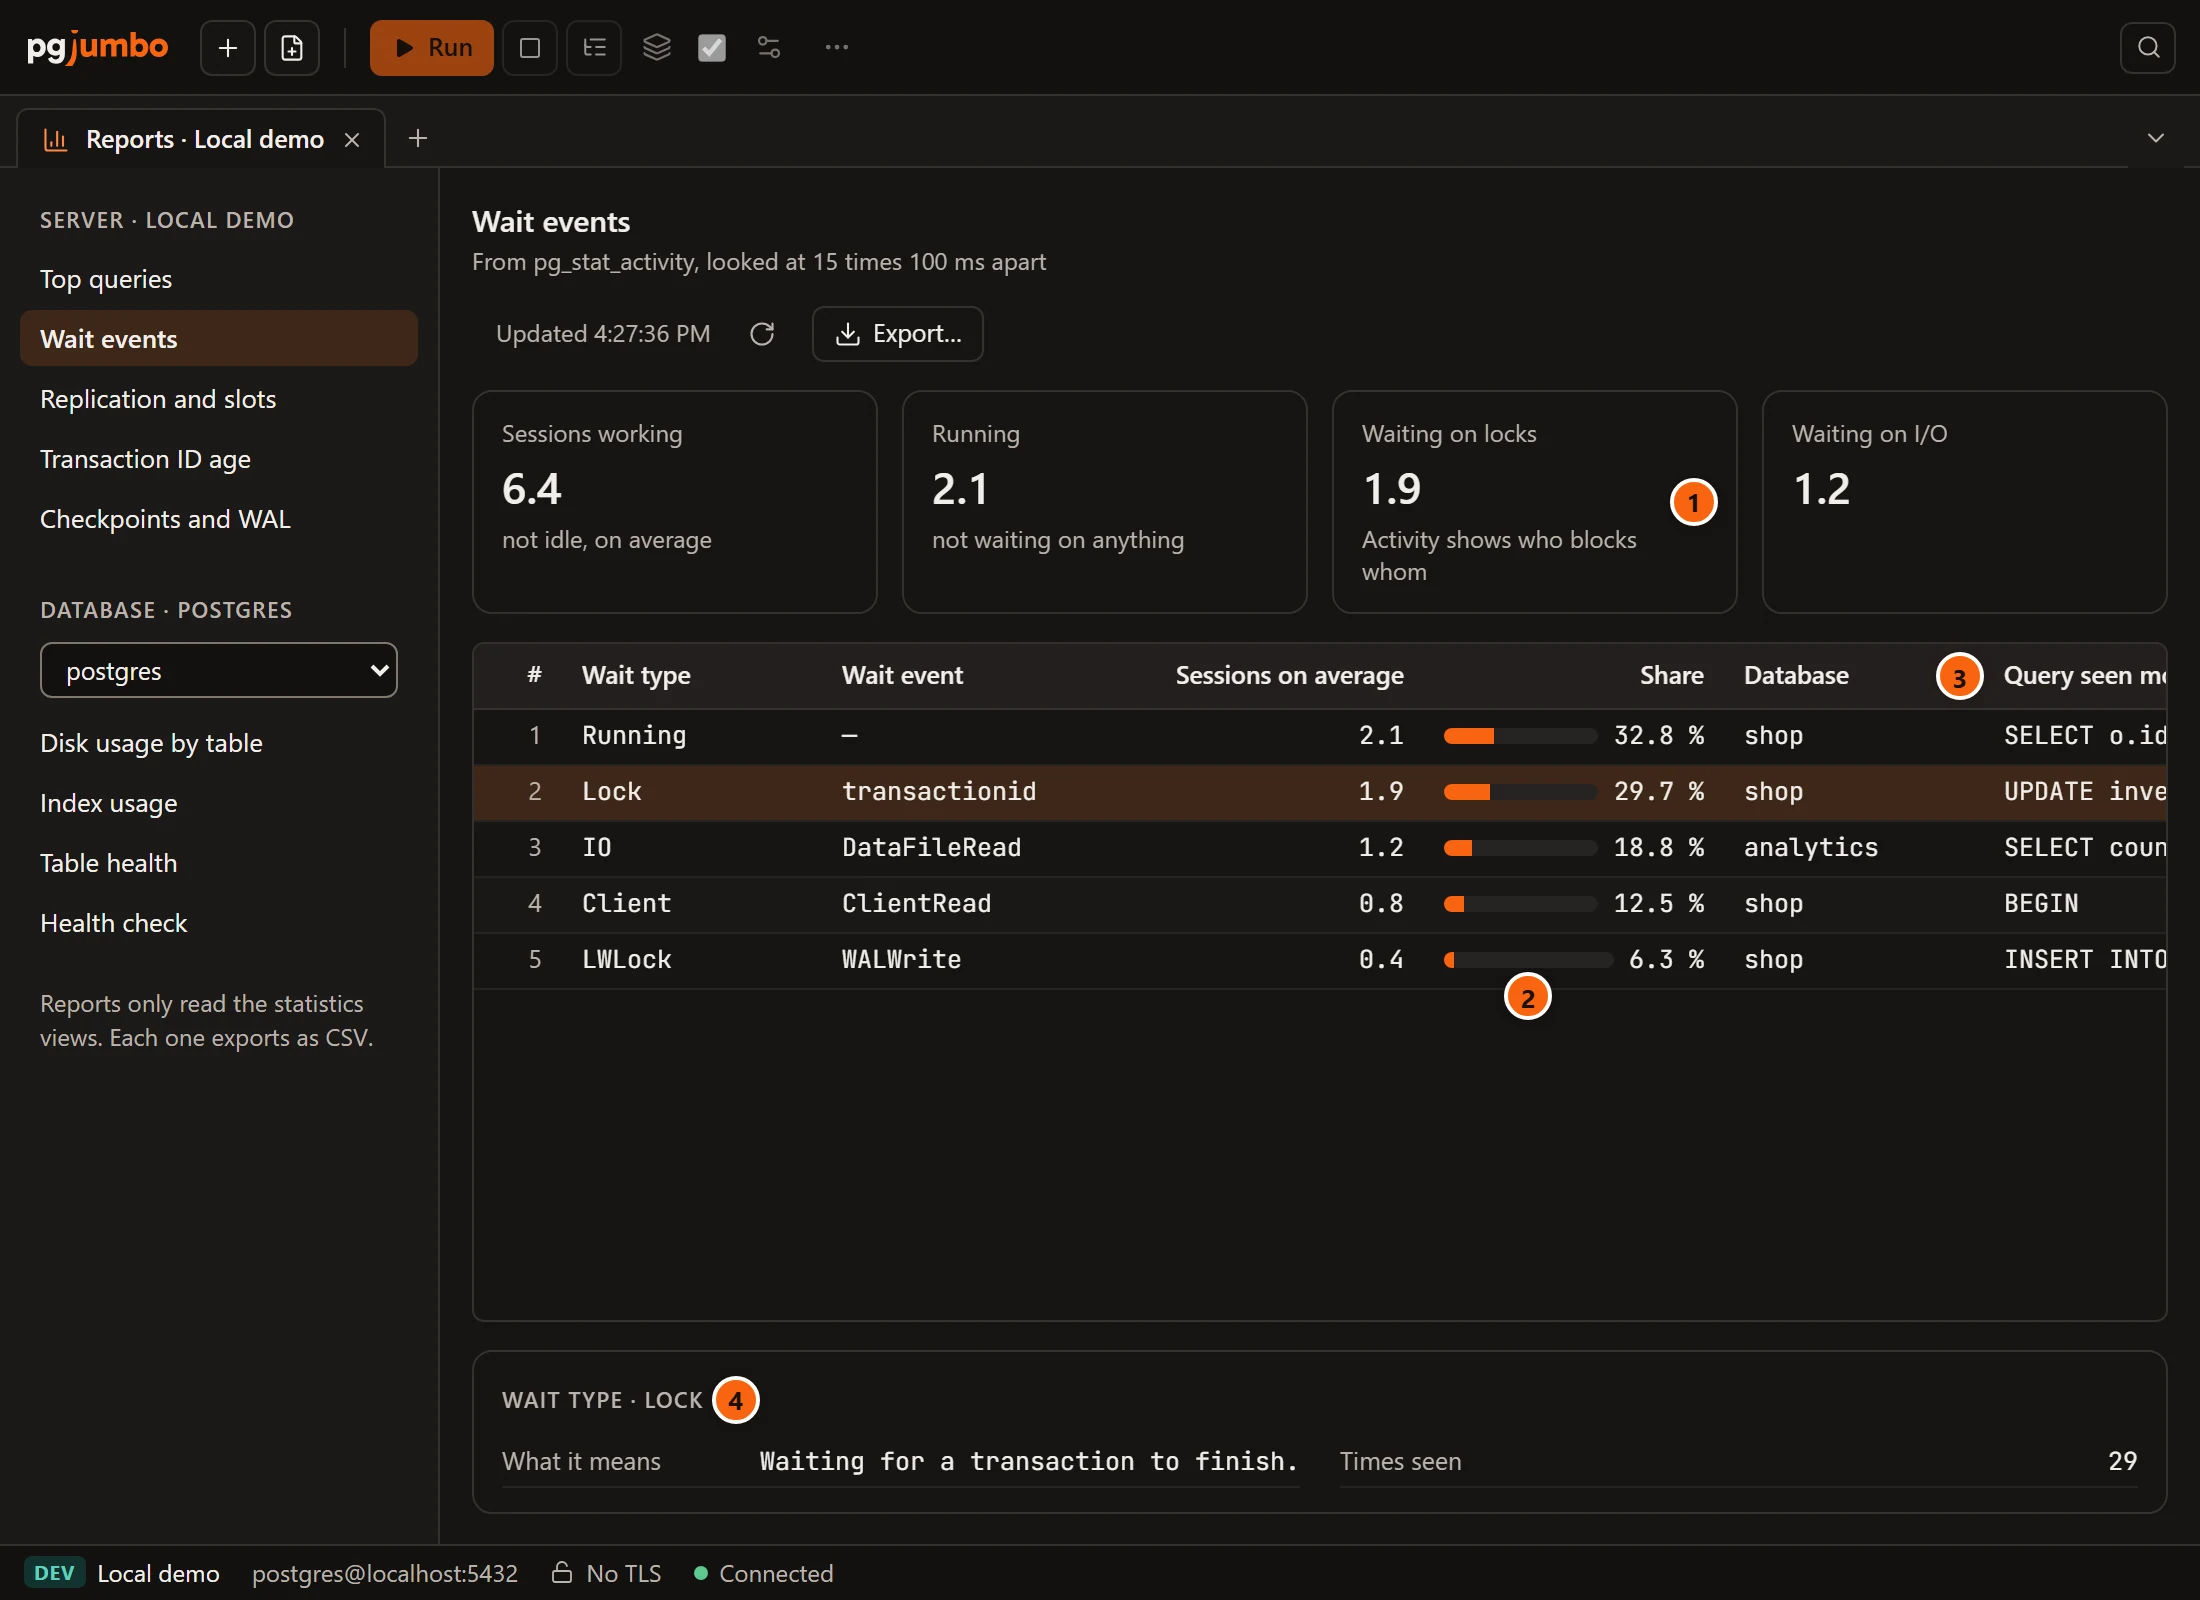
- 1 The totals, each an average over the looks: Sessions working (not idle), Running (not waiting on anything), Waiting on locks and Waiting on I/O. When sessions wait on locks, the box says Activity shows who blocks whom: the Activity view of the server’s tab draws the blocking chains.
- 2 Share: the wait’s share of everything seen, as a bar.
- 3 Query seen most: the statement seen most often with that wait, its passwords masked.
- 4 The row chosen adds What it means and Times seen.
| Column | What it shows |
|---|---|
| Wait type | PostgreSQL’s wait event type, such as Lock, IO, LWLock or Client. Running stands for sessions that were working, not waiting. |
| Wait event | The wait event, such as transactionid or DataFileRead. A dash for Running. |
| Sessions on average | How many sessions were on it, on average over the looks. |
| Share | Its share of all the sessions seen, as a bar. |
| Database | The database seen most often with it. |
| Query seen most | The statement seen most often with it. Only client sessions count here; background processes such as autovacuum workers show no statement. |
| What it means | Shown for the row chosen: PostgreSQL’s description of the wait event, from PostgreSQL 17. For Running it says Working, not waiting: on the CPU, or in a wait PostgreSQL does not name. |
| Times seen | Shown for the row chosen: how many times a session was seen on it. |
When no session was working while pgjumbo looked, the table says No session was working while pgjumbo looked. Read again to look again.
Replication and slots
Section titled “Replication and slots”The server’s replication slots, the WAL each one keeps, and the standbys streaming from the server, from
pg_replication_slots and pg_stat_replication. The slots that keep the most WAL come first.
| Total | What it says |
|---|---|
| Slots | How many replication slots the server has. |
| Not in use | How many slots nothing reads now. When there are some, it adds a slot nothing reads keeps WAL until it is dropped. |
| Most WAL kept | The most WAL one slot keeps, and which slot: by old_reporting. |
| Standbys streaming | How many standbys stream from this server, and how far behind the furthest one replays: the furthest replays 41 s behind. |
| Column | What it shows |
|---|---|
| Slot | The slot’s name. |
| Type | physical or logical. |
| Database | The database of a logical slot. |
| In use | Whether something reads the slot now. |
| WAL kept | The WAL the server keeps for it: from the slot’s restart position to the server’s current WAL position on a primary, or to the last position replayed on a standby. |
| WAL status | reserved, extended, unreserved or lost, from PostgreSQL 13. A dash before 13. |
| Plugin | The output plugin of a logical slot, such as pgoutput. |
| Oldest XID held | The age of the oldest transaction ID the slot holds back from vacuum. |
| Temporary, Restart LSN, Confirmed flush LSN | Shown for the slot chosen. |
When the server has no slots, the table says This server has no replication slots. To drop a slot, use the Replication view of the server’s tab.
Transaction ID age
Section titled “Transaction ID age”How far each database’s oldest unfrozen transaction ID is behind the current one, and what holds the oldest one back. PostgreSQL must freeze old rows before that age reaches about 2.1 billion, or it stops accepting new transactions.
| Total | What it says |
|---|---|
| Oldest unfrozen XID | The highest age of any database, which database, and autovacuum_freeze_max_age: in shop; autovacuum freezes at 200,000,000 whatever it costs. |
| Toward wraparound | That age as a share of 231, with a bar: the server refuses new transactions before 100 %. |
| Held back by a session | The age of the oldest snapshot a session holds, with its pid, user, database and state, or no session holds an old snapshot. |
| Held back by a prepared transaction | The age of the oldest prepared transaction, with its name and database, or none is prepared. |
| Held back by a slot | The age of the oldest transaction ID a replication slot holds, with the slot, or no slot holds one. |
| Column | What it shows |
|---|---|
| Database | Each database, the oldest first. |
| XID age | The age of its oldest unfrozen transaction ID. |
| Toward forced freeze | That age as a share of autovacuum_freeze_max_age, as a bar. At 100 %, autovacuum freezes the database’s tables however busy the server is. |
| Toward wraparound | That age as a share of 231. |
| Multixact age | The age of its oldest multixact ID. |
| Toward multixact freeze | That age as a share of autovacuum_multixact_freeze_max_age. |
| Allows connections | Shown for the database chosen. template0 does not. |
Checkpoints and WAL
Section titled “Checkpoints and WAL”How many checkpoints ran on schedule and how many were asked for early, what they cost, the WAL written, and the
settings that shape them. The numbers come from pg_stat_bgwriter before PostgreSQL 17 and from
pg_stat_checkpointer from 17, with pg_stat_wal from PostgreSQL 14. The source line says since when they count.
| Total | What it says |
|---|---|
| Checkpoints | How many ran, with the checkpoint_timeout setting. |
| Asked for early | The share that did not wait for checkpoint_timeout, because max_wal_size filled up or someone ran CHECKPOINT, with how many and the max_wal_size setting. |
| Time between checkpoints | The average time from one to the next. |
| Writing and syncing | The time one checkpoint spends writing and syncing files, on average. |
| WAL written | PostgreSQL 14 and later: the WAL written, and about how much an hour. |
| Full-page images | PostgreSQL 14 and later: the share of WAL records that are full-page images. Most come right after a checkpoint. |
The table lists the settings that shape checkpoints and WAL, those of this list the server has: archive_mode,
archive_timeout, bgwriter_delay, bgwriter_lru_maxpages, checkpoint_completion_target, checkpoint_timeout,
checkpoint_warning, commit_delay, full_page_writes, log_checkpoints, max_slot_wal_keep_size,
max_wal_size, min_wal_size, synchronous_commit, wal_buffers, wal_compression, wal_keep_segments,
wal_keep_size, wal_level, wal_writer_delay and wal_writer_flush_after.
| Column | What it shows |
|---|---|
| Setting | The setting’s name. |
| Value | Its value now. |
| Changed | Whether something other than its default sets it. |
| What it does, Set by, Needs a restart | Shown for the setting chosen: PostgreSQL’s description, where its value comes from (such as configuration file), and whether a change takes a restart. |
To change one, use the Configuration view.
Disk usage by table
Section titled “Disk usage by table”The tables and materialized views of the database the picker names, outside the system schemas, the largest first. It shows at most 200. A partition counts as a table of its own; a partitioned table holds no data and is not listed.
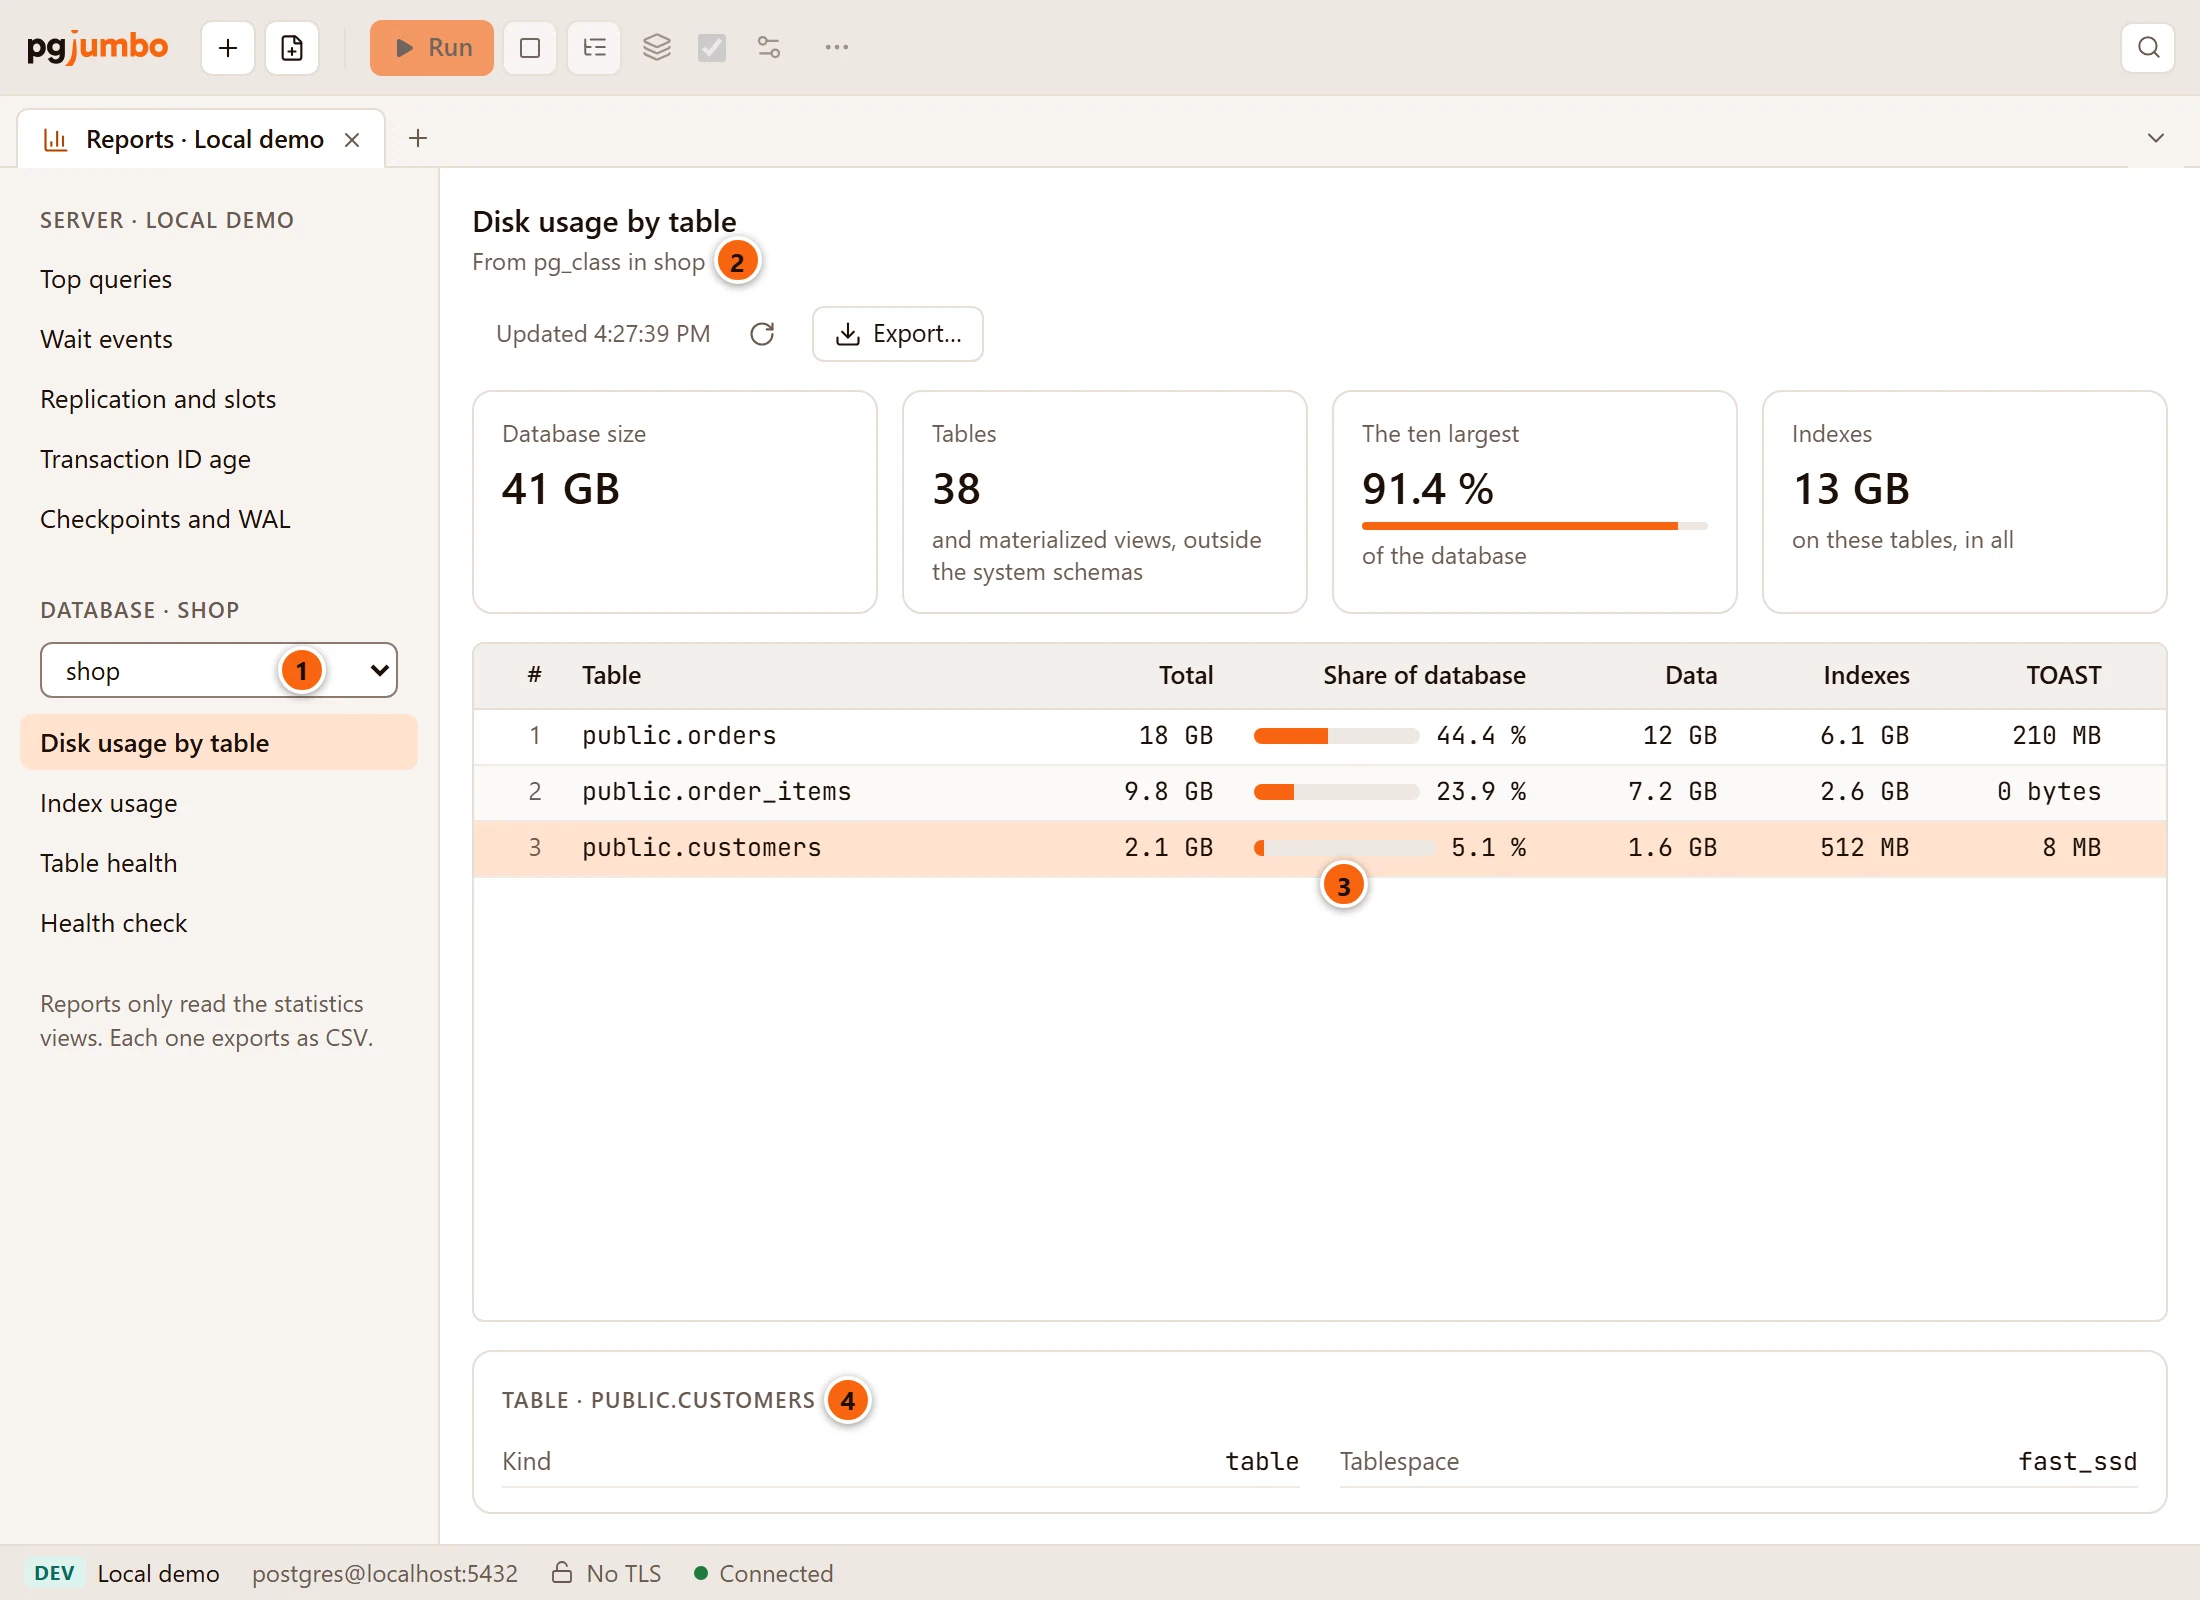
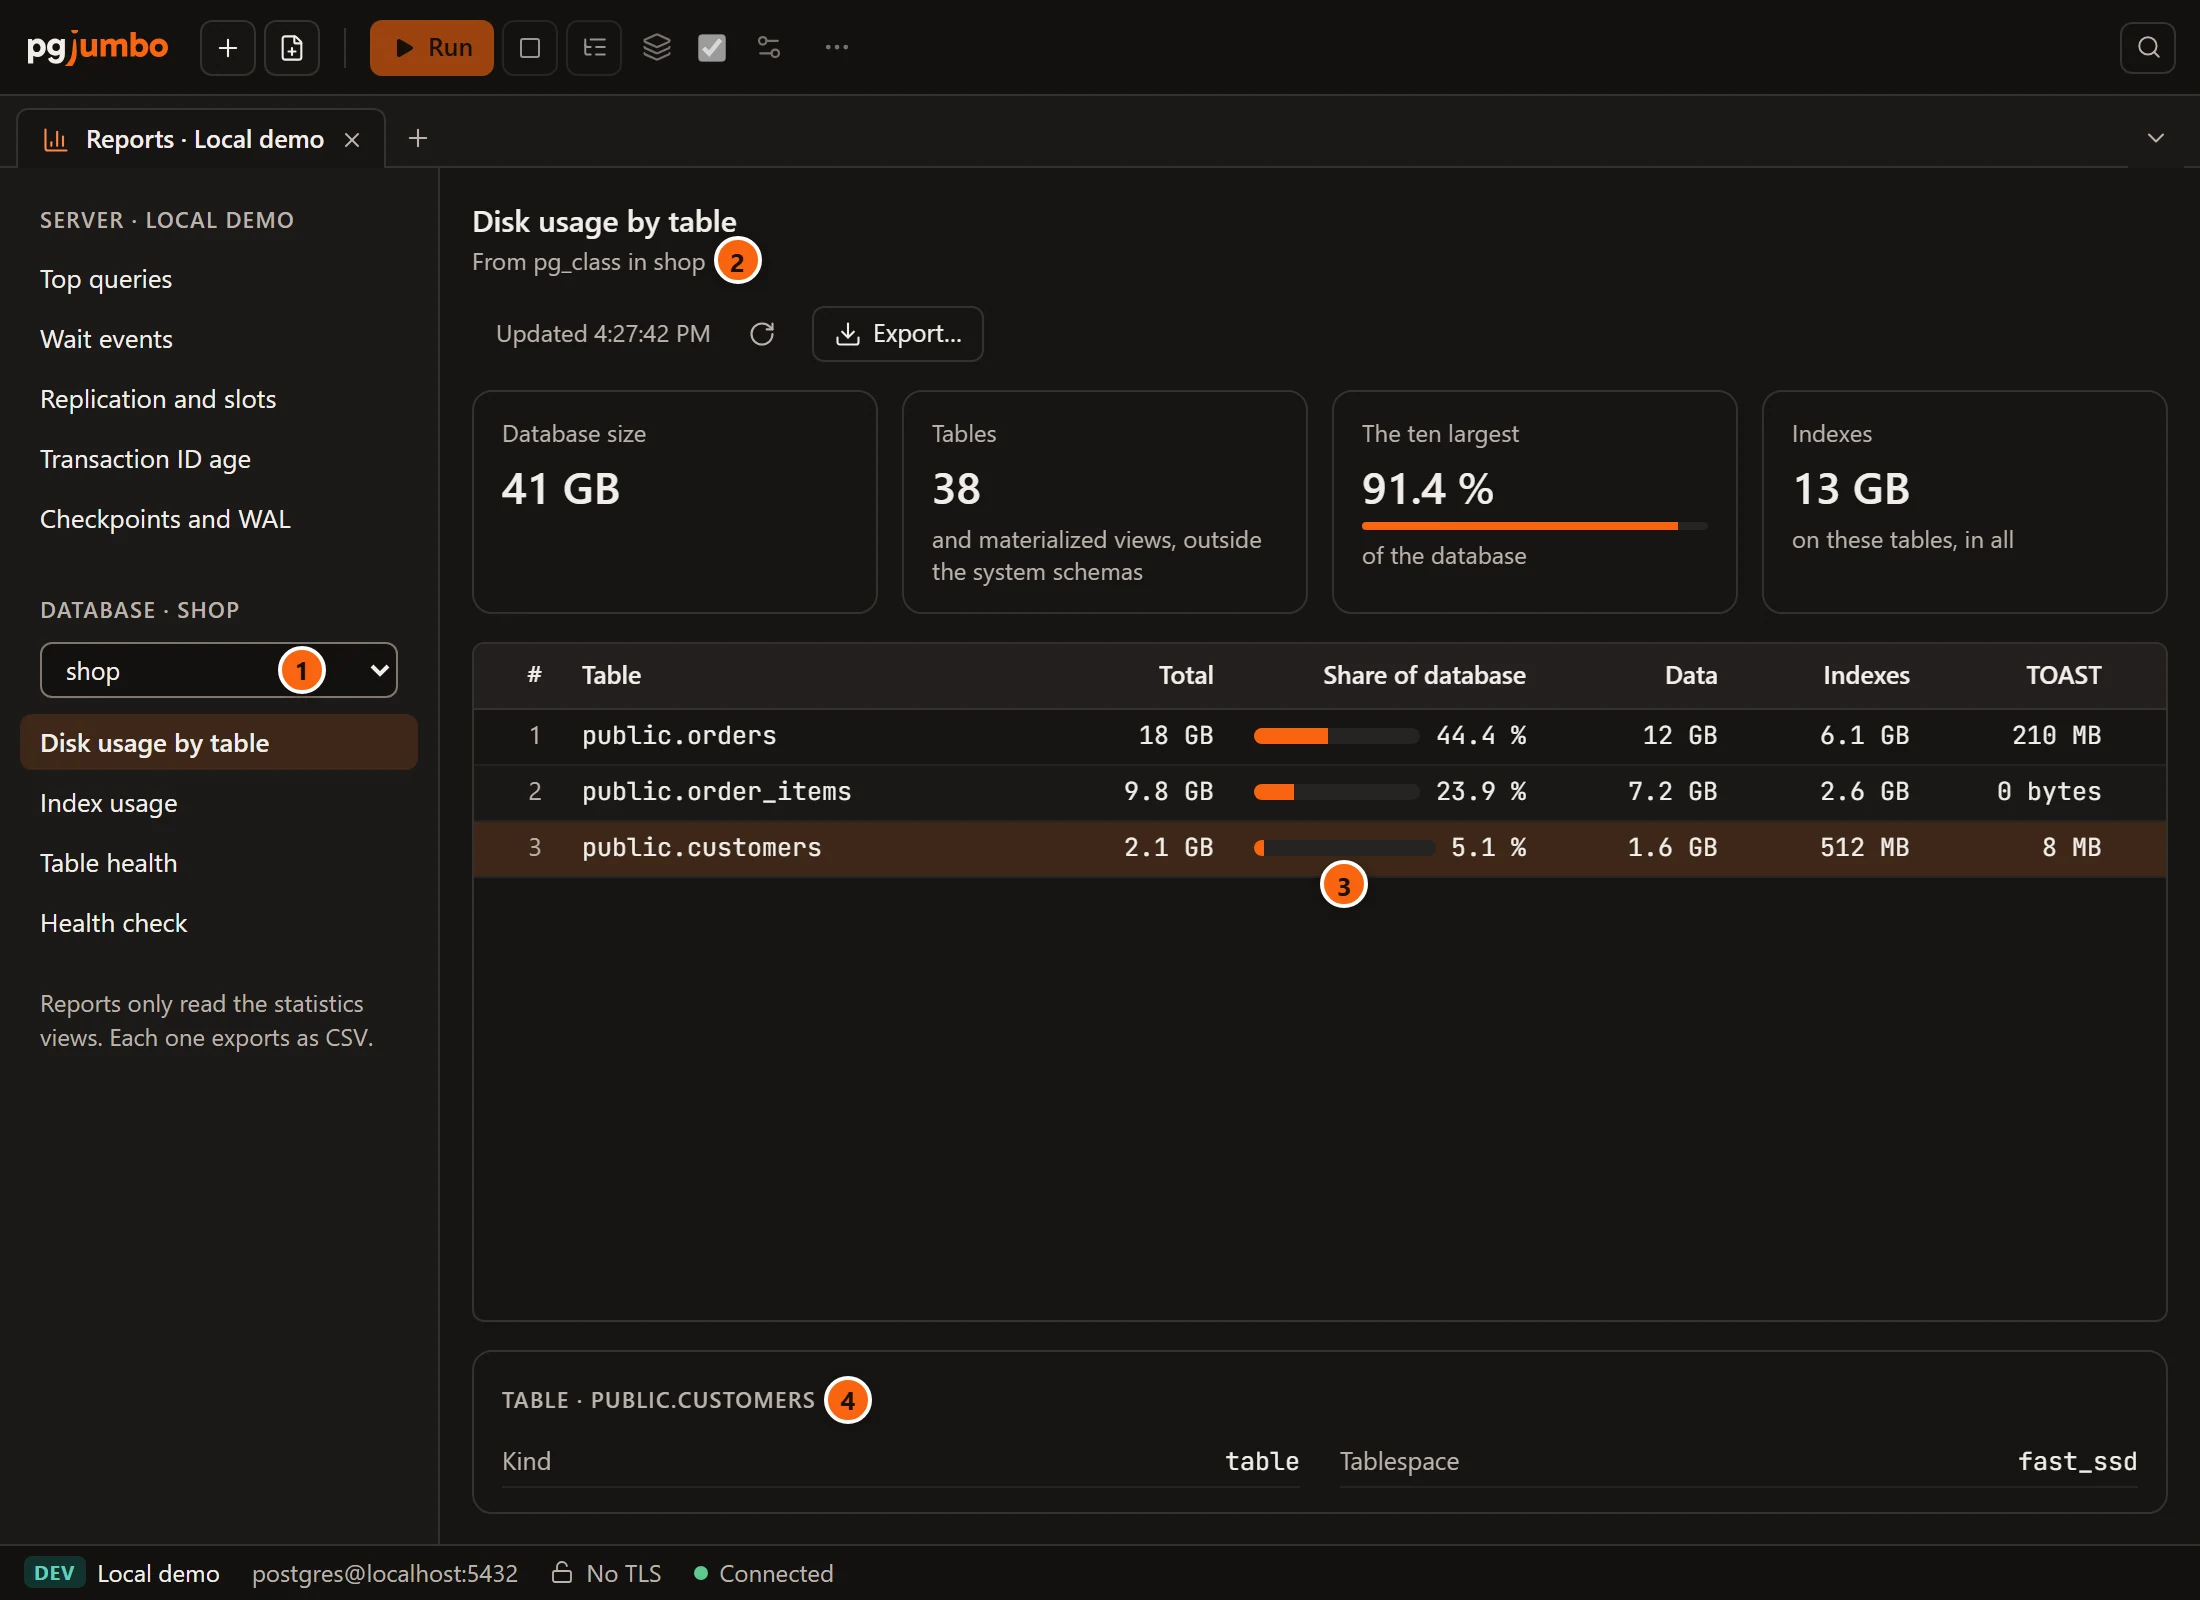
- 1 The picker set to
shop: the report reads that database. - 2 From pg_class in shop: the source line names the database too.
- 3 Share of database: each table’s whole size against the database’s, as a bar.
- 4 The row chosen adds Kind and Tablespace.
| Total | What it says |
|---|---|
| Database size | The whole database, as pg_database_size measures it. |
| Tables | How many tables and materialized views there are outside the system schemas. |
| The ten largest | Their share of the database. |
| Indexes | The size of these tables’ indexes, in all. |
| Column | What it shows |
|---|---|
| Table | The schema and name. |
| Total | Its whole size: data, indexes and TOAST. |
| Share of database | That size as a share of the database, as a bar. |
| Data | The table’s own data. |
| Indexes | Its indexes. |
| TOAST | Its TOAST table and that table’s index. |
| Rows | The planner’s estimate of its rows. A dash for a table that was never analysed, on PostgreSQL 14 and later. |
| Kind | Shown for the row chosen: table or materialized view. |
| Tablespace | Shown for the row chosen: its tablespace, or the database’s when it uses the database’s default. |
An empty list says This database has no tables outside the system schemas.
Index usage
Section titled “Index usage”The indexes of the database the picker names, outside the system schemas, the least used first and then the largest. It shows at most 500. Scans count since the database’s statistics were last reset, which the source line says.
| Total | What it says |
|---|---|
| Indexes | How many there are. |
| Never scanned | How many were never scanned, leaving out primary keys and unique indexes. Standby servers count their own scans, so an index used only on a standby counts here as never scanned. |
| Space they take | The size of those indexes. Every write keeps them up to date. |
| Invalid | How many are invalid. When there are some, it adds a failed CREATE INDEX CONCURRENTLY leaves one behind. |
| Column | What it shows |
|---|---|
| Index | The schema and name. |
| Table | The table it is on. |
| Scans | How many times it was scanned. |
| Size | Its size. |
| Unique or key | Whether it is unique or backs a primary key. These stay whatever their scans, since constraints use them. |
| Valid | Whether it is valid. |
| Last scan | PostgreSQL 16 and later: when it was last scanned. The column is not there before 16. |
| Rows read, Definition | Shown for the index chosen: the index entries its scans returned, and its CREATE INDEX statement. |
An empty list says This database has no indexes outside the system schemas. The health check turns unused, duplicate and invalid indexes into findings with a script.
Table health
Section titled “Table health”The tables and materialized views of the database the picker names, with their dead rows and when they were last vacuumed and analysed, the most dead rows first. It shows at most 500.
| Total | What it says |
|---|---|
| Tables | How many there are. |
| Vacuum due | How many have more dead rows than autovacuum’s own threshold. |
| Never analyzed | How many were never analysed, by hand or by autovacuum: the planner guesses their rows. |
| Oldest unfrozen XID | The highest transaction ID age of any of them, and which table. |
| Column | What it shows |
|---|---|
| Table | The schema and name. |
| Live rows, Dead rows | The rows PostgreSQL’s statistics count. |
| Dead share | Dead rows as a share of all rows, as a bar. |
| Vacuum due | Whether the dead rows are past autovacuum_vacuum_threshold plus autovacuum_vacuum_scale_factor times the table’s rows, where autovacuum starts. |
| Last vacuum, Last analyze | The later of the last manual run and the last autovacuum run. |
| Changed since analyze | Rows inserted, updated or deleted since it was last analysed. |
| XID age, Sequential scans, Index scans, Vacuums, Analyzes | Shown for the table chosen: the age of its oldest unfrozen transaction ID, how it was read, and how many times it was vacuumed and analysed, manual and automatic together. |
To vacuum or analyse a table, right-click it and choose TasksMaintenance…; see Maintenance and jobs.
Export a report
Section titled “Export a report”Export… saves the report in front as a CSV file. It is greyed out while the report has no rows.
- Click Export…. Your system’s Save dialog opens on a name such as
Local demo top queries.csv, orLocal demo shop disk usage by table.csvfor a database’s report. - Choose where to save it. The tab then says Saved to and the file’s path, or the error when the file could not be written.
The file has a header line, then one line per row of the table with every column, those shown only for the row chosen
as well. Top queries adds a Query id column, pg_stat_statements’ own number for the statement, which the tab
does not show. Values are written as the server gave them rather than as the tab shows them: sizes in bytes, times in
milliseconds, percentages as plain numbers, yes and no as true and false, moments in ISO 8601. Fields that hold a
comma, a quote or a line break are quoted.
Ask the Assistant about a report
Section titled “Ask the Assistant about a report”When the Assistant is turned on and the server is connected, the bar has Ask about this report. It opens the Assistant pane and asks it to explain the report on show: what stands out, and what to do first. It is greyed out until the report has been read. See Ask the Assistant.