
The pgjumbo window
pgjumbo has one main window. Everything you open (a query, a table, a server’s activity) becomes a tab in it, and a Query Tool or a psql tab can move out to a window of its own (see Tabs). This page goes through each part of the main window and what every control there does.
The parts of the window
Section titled “The parts of the window”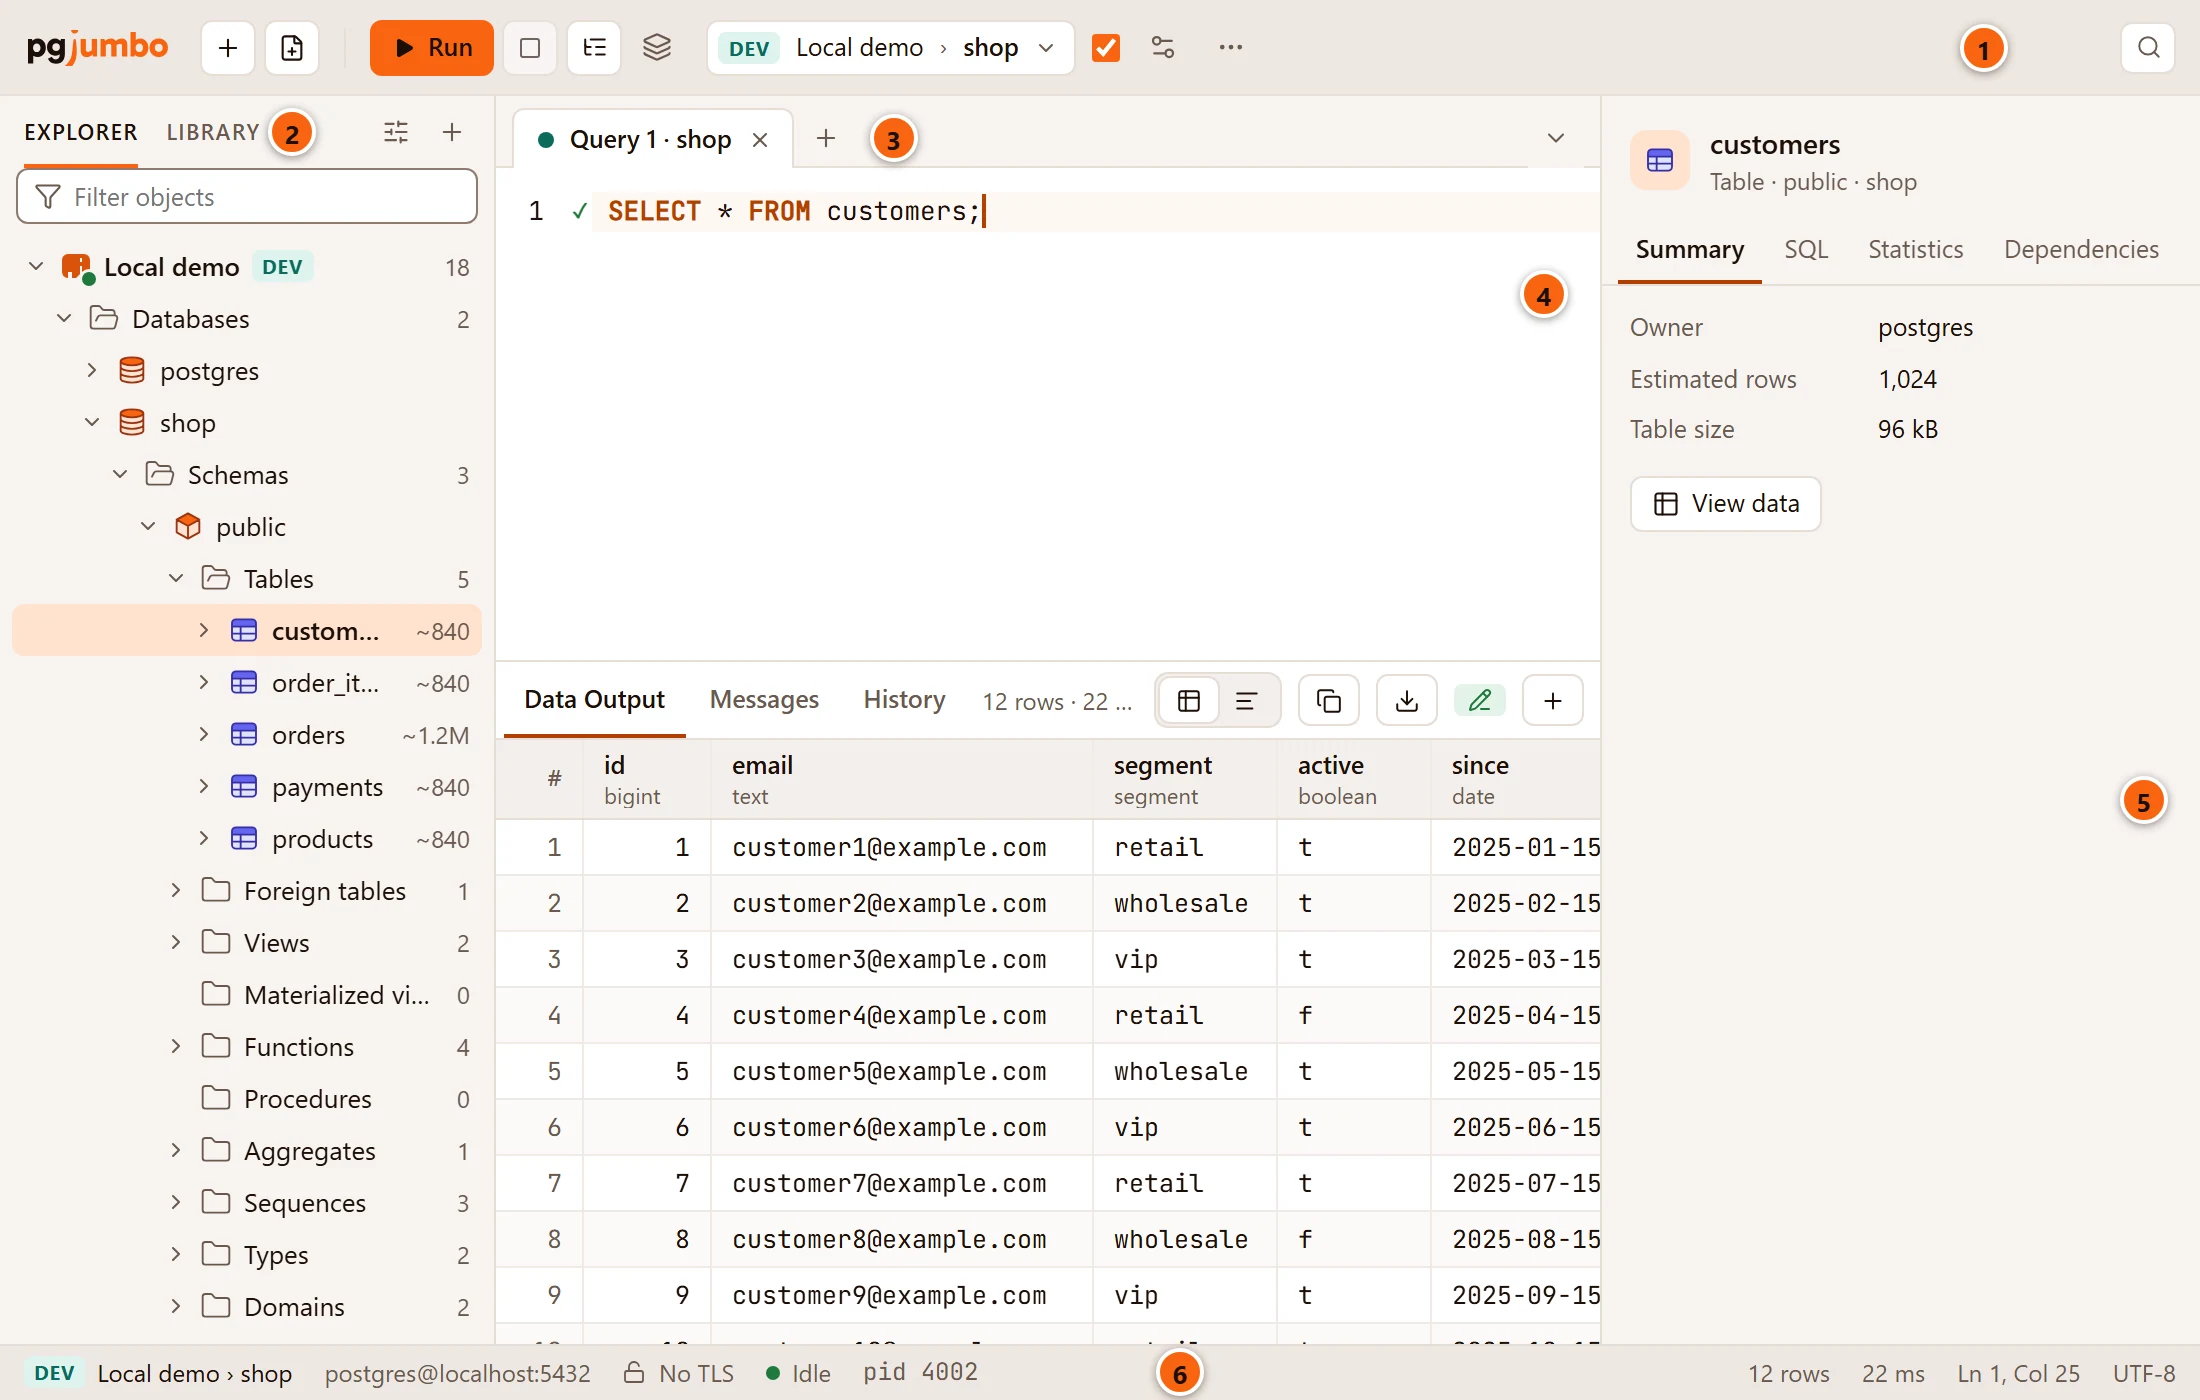
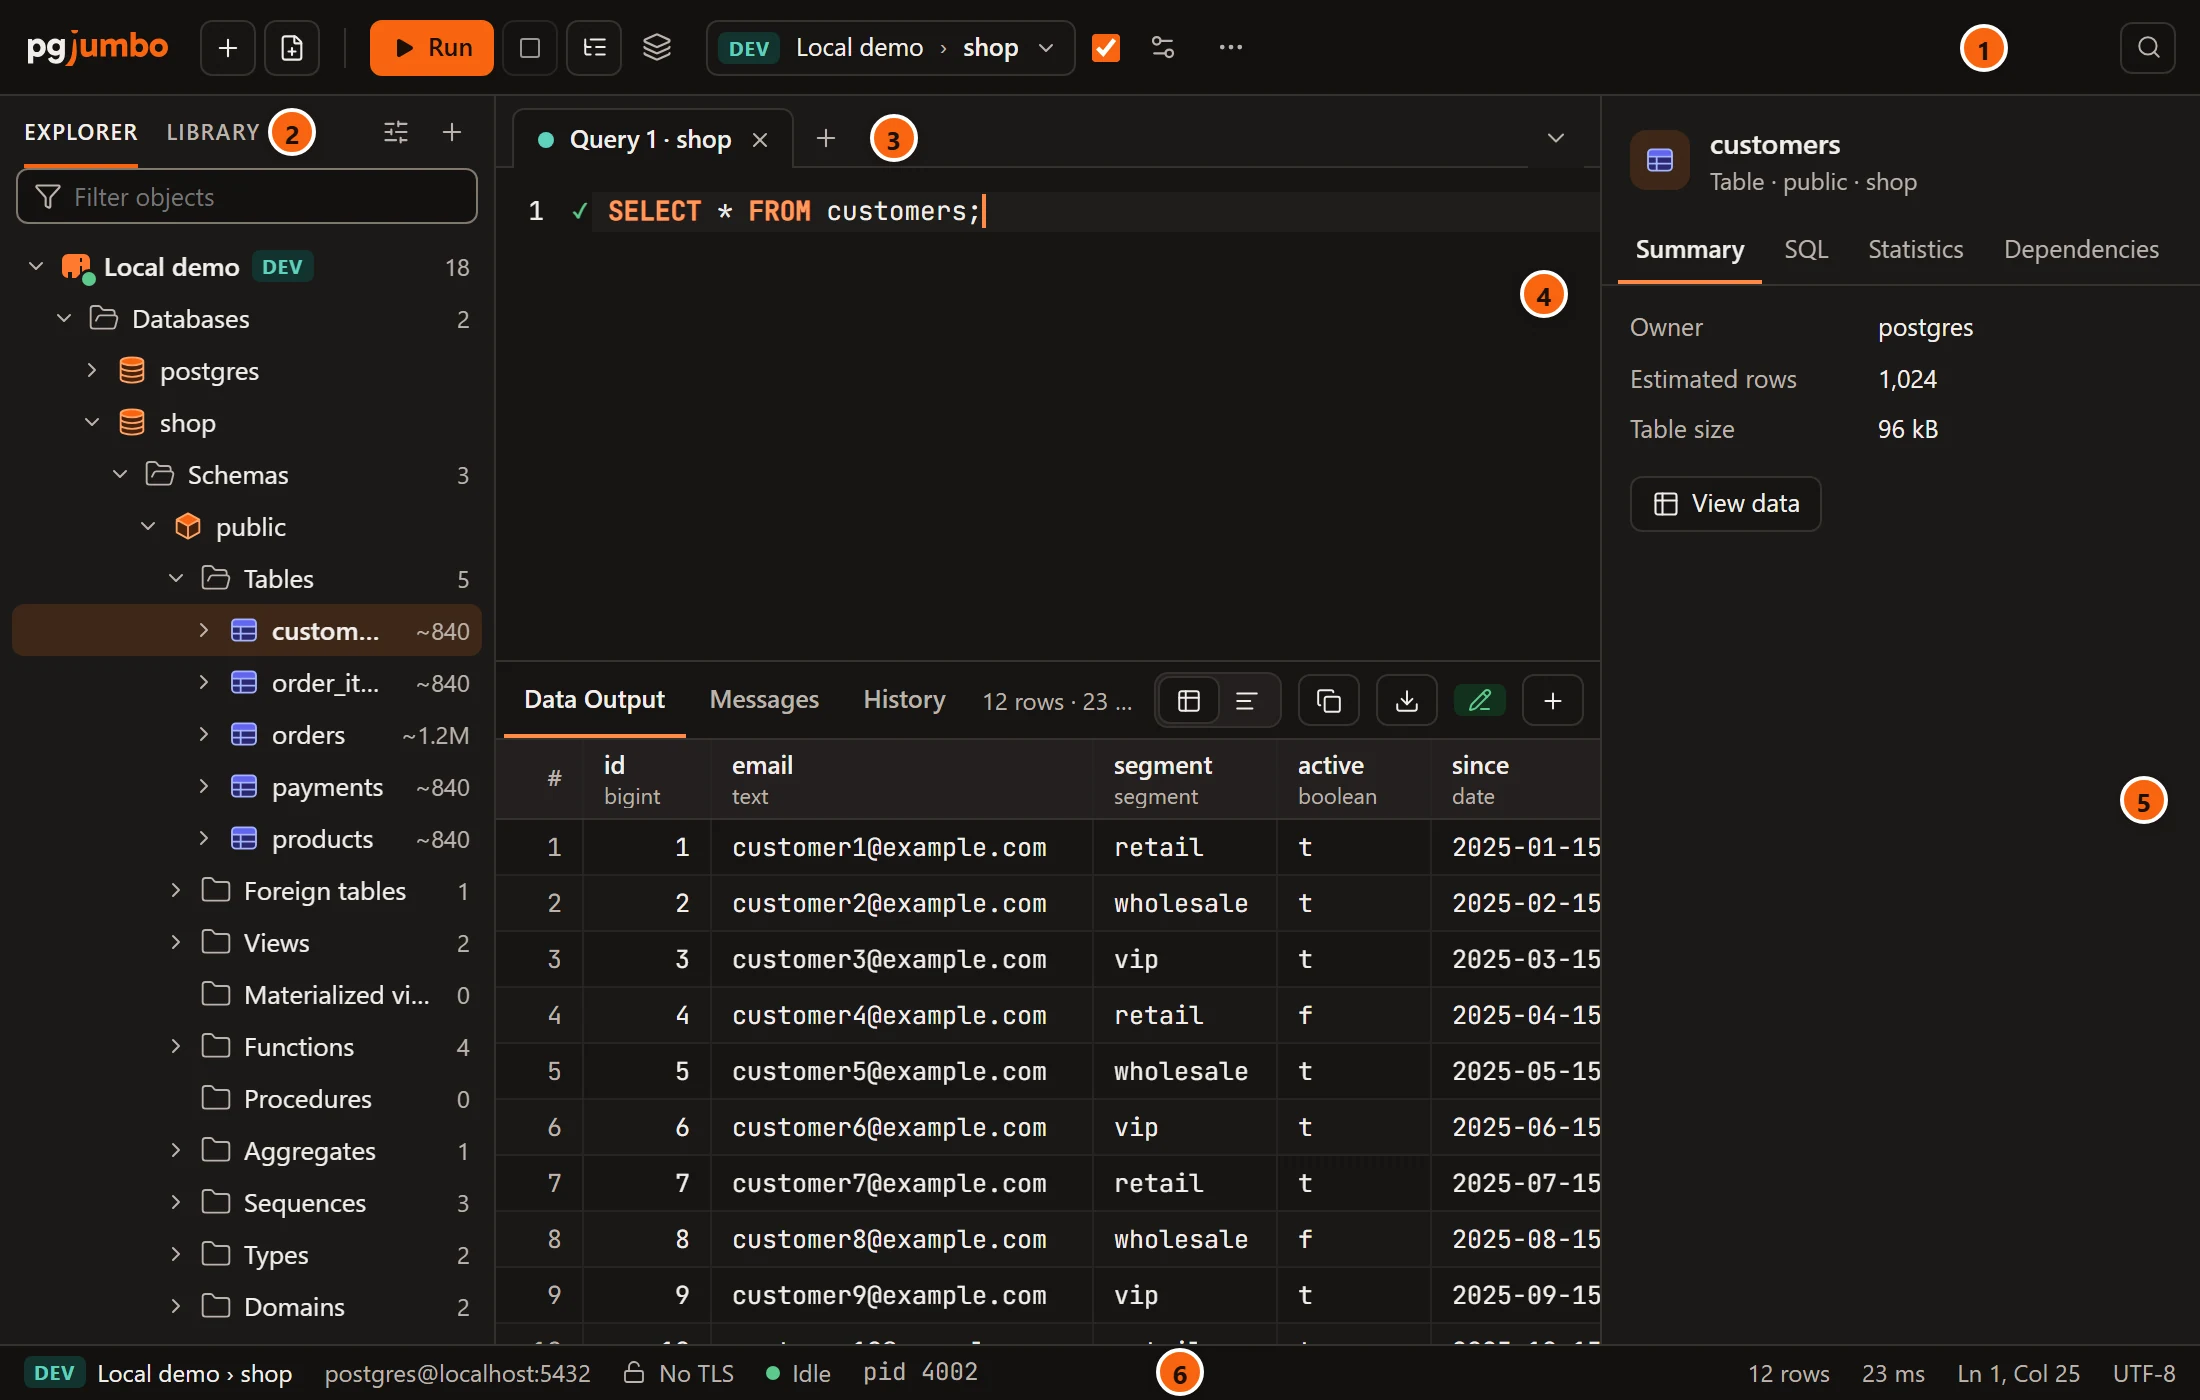
- 1 The main toolbar: add a server, open a query tab, the Query Tool’s actions, and Open Quickly.
- 2 The left pane, with two tabs: Explorer, the tree of your servers and their objects, and Library, your templates, snippets and scripts.
- 3 The tab strip: every open tab, with + for a new query tab.
- 4 The centre shows the tab in front, here a Query Tool with its editor above and its results below.
- 5 The right pane: the Inspector, which describes what you selected in the Explorer, or the Assistant.
- 6 The status bar: the connection of the tab in front, its session, and the last run.
The main toolbar
Section titled “The main toolbar”

- 1 Connect adds a server; New query opens a Query Tool tab.
- 2 Run, Stop, Explain and Run on several databases run the SQL of the Query Tool tab in front.
- 3 The tab’s server and database. Click it to switch the tab to another database.
- 4 Auto-commit and Session settings set how the tab’s session works.
- 5 More query actions (···) holds the rest.
- 6 Open Quickly… finds a table, view, function, schema or database by name.
- 7 Assistant shows or hides the Assistant. It is there only while the Assistant is on.
The pgjumbo name at the left end is only a logo; clicking it does nothing.
Everything from Run to ··· acts on the query tab in front: a Query Tool, a tab of a table’s rows, or a table’s tab on its Data view. With any other tab in front, or no tab, those buttons are there but greyed out, and the connection button is not shown. Hover over a button to see what it does and, for most, its keys.
| Button | What it does | Keys |
|---|---|---|
| Connect (+) | Opens the New connection dialog. See Your first connection. | ⌘ N (Ctrl+N on Windows and Linux) |
| New query | Opens a new Query Tool tab on the database of what you selected in the Explorer, when its server is connected. Otherwise on the database of the query tab in front; if that tab’s server is not connected, the new tab waits for it. Greyed out when there is neither. | ⌘ T (Ctrl+T on Windows and Linux) |
| Run | Runs the selection, or the whole tab when nothing is selected. In a tab of a table’s rows, it reads the rows again. Greyed out until the tab’s session is open, and while something runs. It is the orange button, except when Auto-commit is off and a transaction is open: then Commit is the orange one, or Rollback after an error. | ⌘ ↩︎ (Ctrl+Enter on Windows and Linux) |
| Stop | Stops the query or the Explain that is running. It turns red while there is something to stop, and is greyed out otherwise. | ⌘ . (Ctrl+. on Windows and Linux) |
| Explain | Shows the plan of the selection, or of the statement at the cursor when nothing is selected. Greyed out in a tab of a table’s rows. See Explain a query. | ⌘ E (F7 on Windows and Linux) |
| Run on several databases (layers) | Opens Run on several databases for the selection or the whole tab. Greyed out in a tab of a table’s rows. See Run on several databases. | |
Connection (DEV Local demo › shop) |
The environment tag, the server and the database of the tab. Its menu lists the server’s databases, with a tick on the current one; choosing another moves the tab there. Greyed out until the tab’s session is open, while a query runs, inside a transaction (or a failed one), while changes to rows wait to be saved, and in a tab of a table’s rows, which stays on its table’s database. Hover over it to see why. See The Query Tool. | |
| Commit and Rollback | Shown only when Auto-commit is off. Commit works inside a transaction, Rollback inside one or after an error in one. See Transactions and sessions. | |
| Auto-commit | Ticked, each statement commits by itself. Untick it to commit by hand. Greyed out until the session is open, and while something runs. | |
| Session settings (sliders) | Opens Session settings for the tab’s search path, role, timeouts and work_mem. |
|
| More query actions (···) | The menu below. | |
| Open Quickly… | Finds by name a database of a connected server, or an object in a database you have opened in the Explorer or in a tab. Greyed out until a server is connected. See Open Quickly. | ⇧ ⌘ O (Ctrl+P on Windows and Linux) |
| Assistant | Shows the Assistant in the right pane, or hides it again. Shown only while the Assistant is turned on in Settings. | ⌘ J (Ctrl+J on Windows and Linux) |
The toolbar keeps to one row and gives way as the window narrows. Zooming in has the same effect, because the window then holds fewer pixels’ worth of toolbar.
- Below about 1,460 pixels wide, which includes the window’s first size of 1,280, the buttons drop their names and shortcut hints and show only their icons. Run keeps its name.
- Below about 1,120 pixels, Open Quickly… and Auto-commit lose their names too, and the connection button gets narrower.
- Below about 920 pixels, the Run on several databases and Session settings buttons go, and the connection button shows only the tag and the database. The ··· menu still has both.
The ··· menu
Section titled “The ··· menu”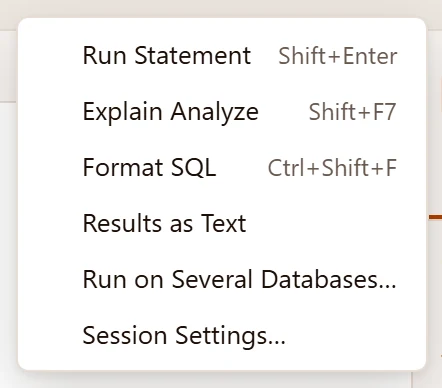
Each item does what the item of the same name in the Query menu does. The ··· button is greyed out until the tab in front has its session open, and while a query runs.
| Item | What it does | Keys |
|---|---|---|
| Run Statement | Runs the selection, or the statement at the cursor when nothing is selected. See The Query Tool. | ⇧ ↩︎ (Shift+Enter on Windows and Linux), in the editor |
| Explain Analyze | Runs the selection, or the statement at the cursor, for real and shows its plan with real times. | ⌥ ⌘ E (Shift+F7 on Windows and Linux) |
| Format SQL | Lays out the selection, or the whole tab. See Writing SQL. | ⇧ ⌘ F (Ctrl+Shift+F on Windows and Linux) |
| Results as Text | Shows results as text, the way psql prints them, instead of a grid. Ticked while it is on. See Results. |
|
| Run on Several Databases… | The same as the layers button. | |
| Session Settings… | The same as the sliders button. |
Run Statement, Explain Analyze, Format SQL and Run on Several Databases… need a tab with an editor, so they are greyed out in a tab of a table’s rows.
The left pane
Section titled “The left pane”The left pane has two tabs at its top. Explorer shows your servers as a tree; Library shows templates, your own
snippets and a folder of .sql scripts. ViewLibrary opens the pane on Library, showing the
pane first if it was hidden.
On the Explorer tab:
| Control | What it does |
|---|---|
| Explorer options (sliders) | A menu. Under View options: Show system objects (template databases, the pg_catalog and information_schema schemas, and other built-in objects) and Show object counts (the numbers beside each folder). Under Server list: Import servers… and Export servers…. See Manage your servers. |
| New connection (+) | Opens the New connection dialog. |
| Filter objects | Keeps the rows whose name contains what you type, and the rows above them, among the rows already loaded. When nothing matches, the tree says so. Esc clears the field. It appears once you have a server or a group. |
| The tree | Servers, their groups, databases and every object inside. The Explorer explains it, and Right-click menus lists what each row’s menu does. |
The options button and + show only on the Explorer tab. With no server yet, the Explorer says No servers yet and has a New connection button of its own.
On the Library tab, the Find a template or a script field narrows the list; The Library explains the rest.
The centre
Section titled “The centre”What the centre shows depends on what is open:
- With at least one tab open: the tab strip and the tab in front.
- With no tab open and a folder of a connected server selected in the Explorer, such as Tables: that folder’s objects as a list, the Object Details.
- With no tab open and a server, or something inside one, selected: the server’s panel, below.
- With no tab open and nothing selected, as when pgjumbo starts: the start page.
The start page
Section titled “The start page”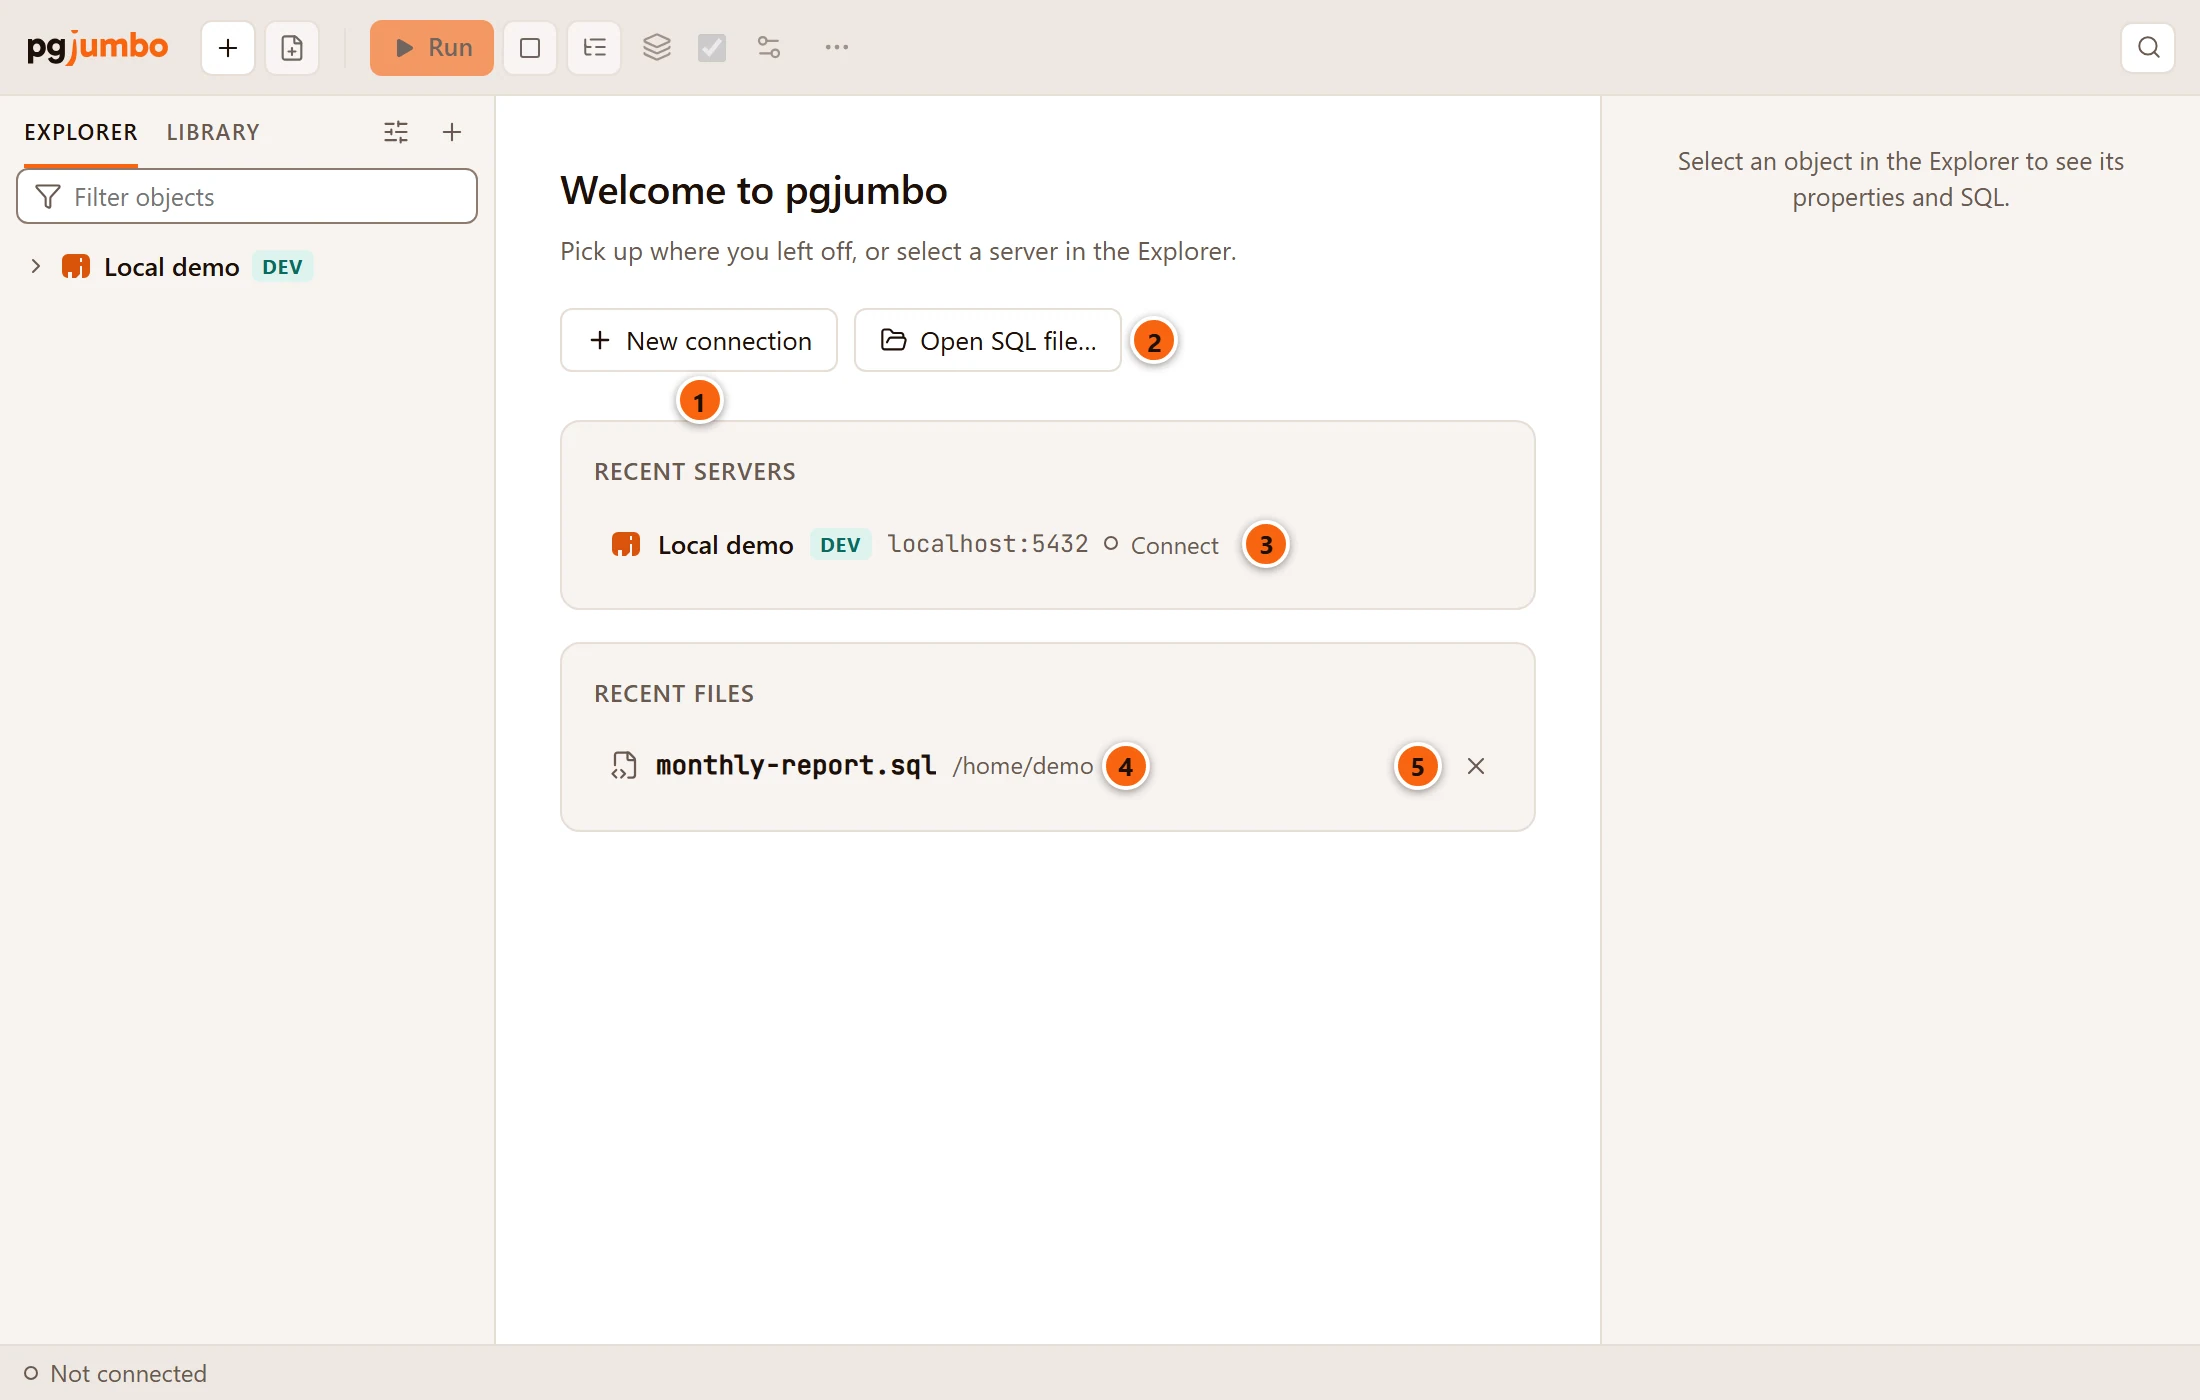
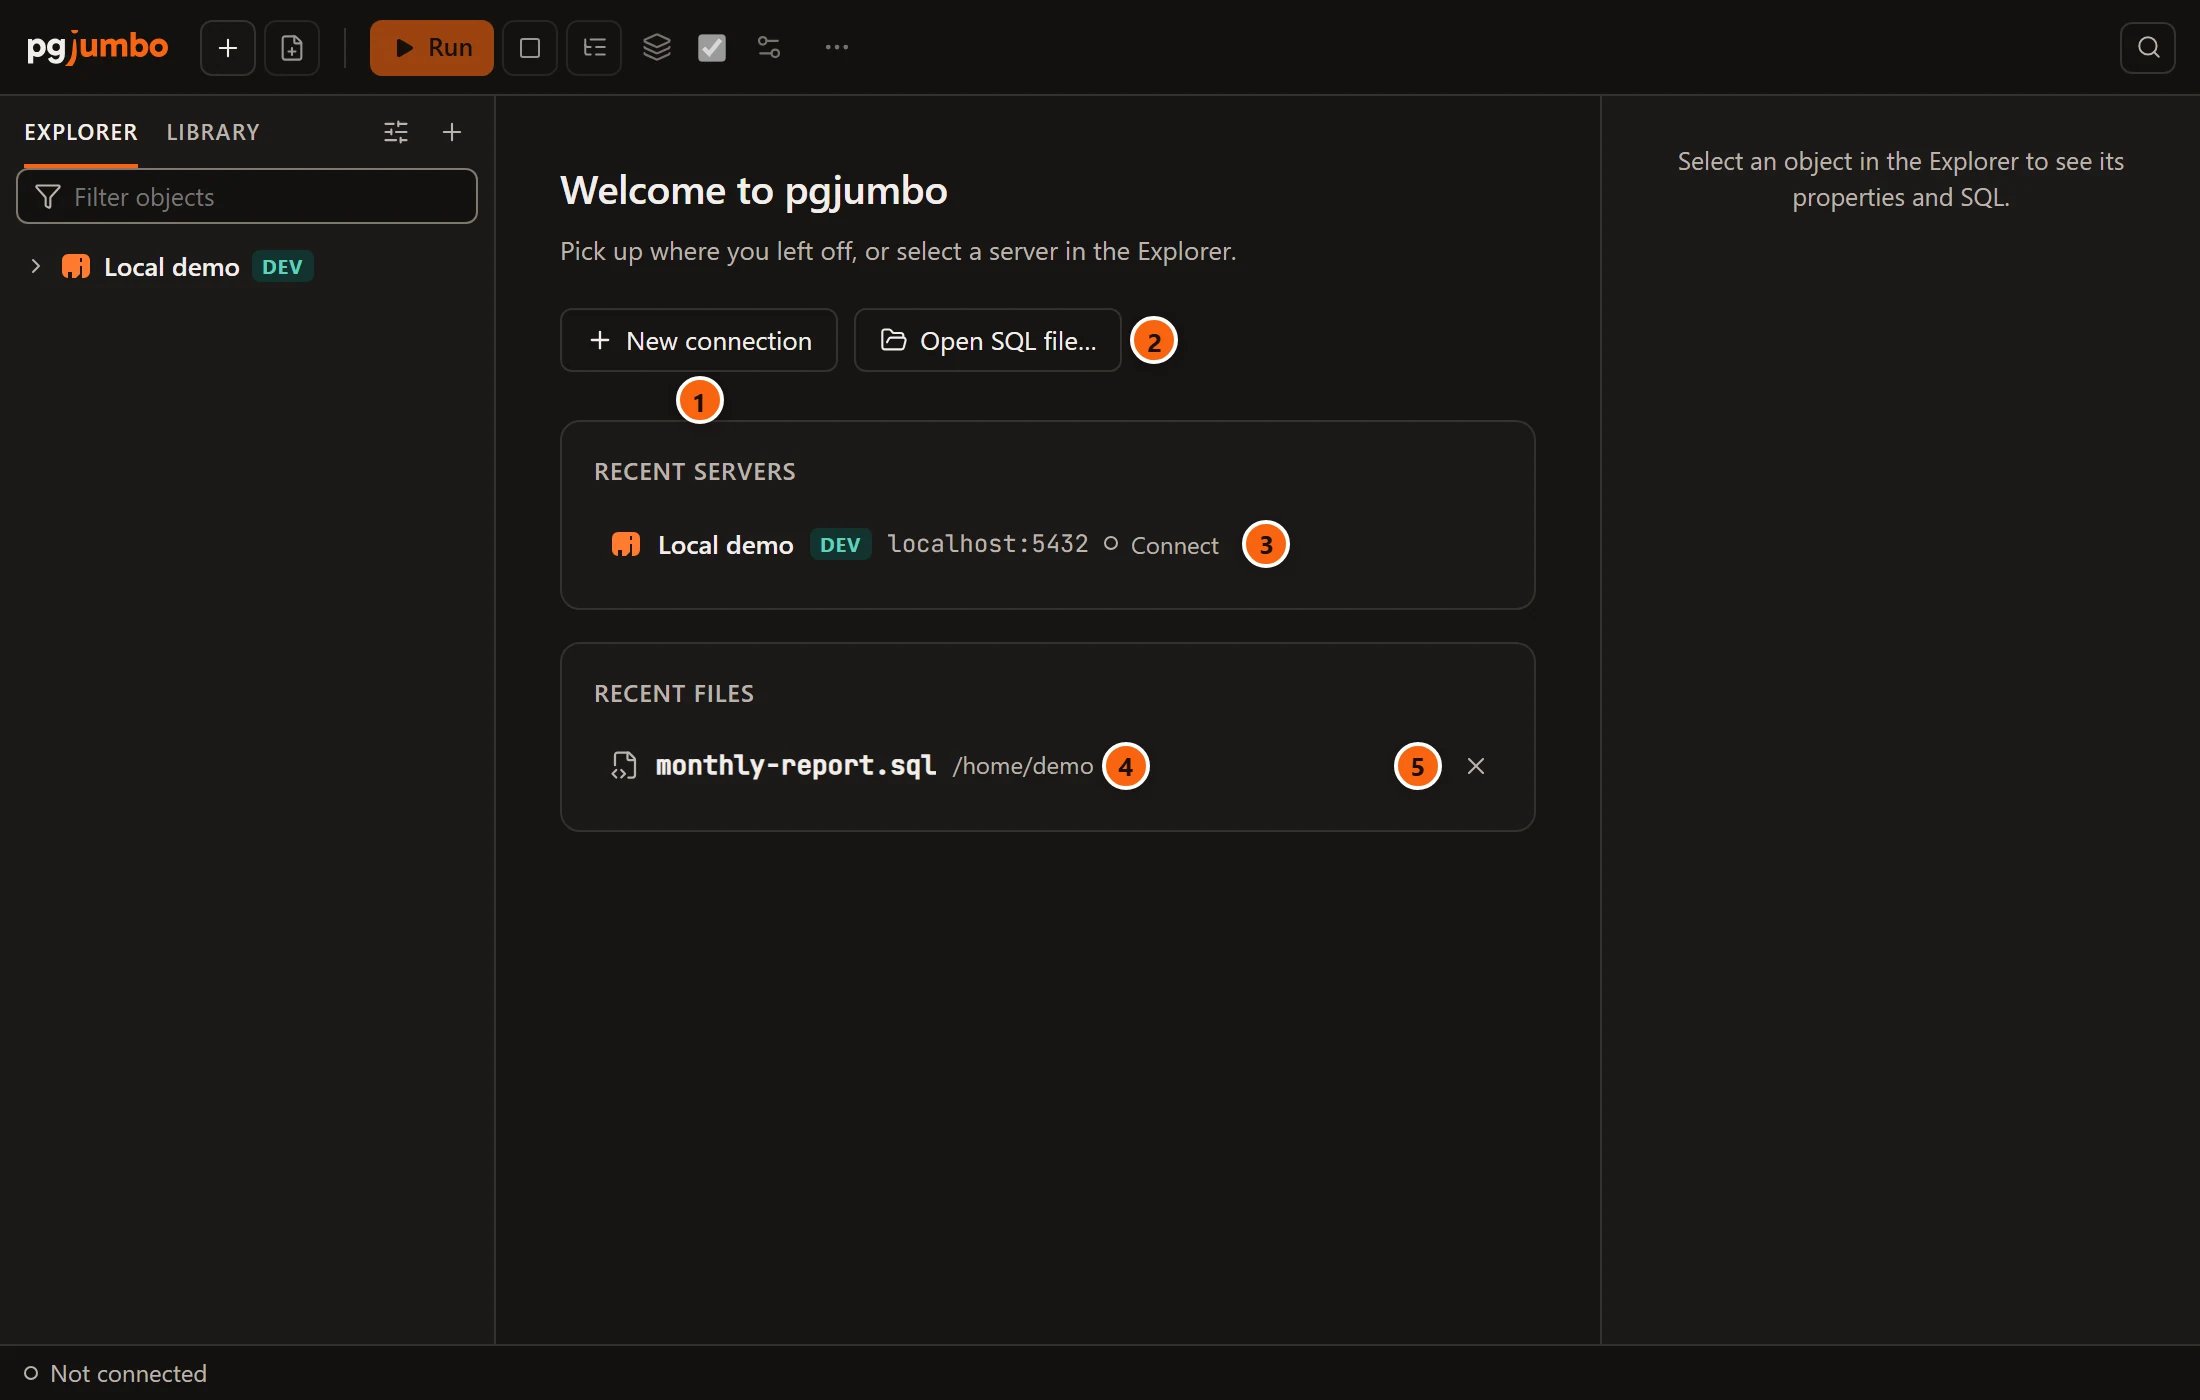
- 1 New connection opens the New connection dialog. It is the orange button while you have no servers.
- 2 Open SQL file… shows your system’s Open dialog. The file opens in a new Query Tool tab on the server you connected last (or the first one in the Explorer), on the database its connection settings name. If that server is not connected, the tab waits for it. Greyed out while you have no server.
- 3 Recent servers lists up to six servers: the ones you connected lately first, then the others in the Explorer’s order. Each row shows the name, the environment tag, the address and the state (Connect, Connecting…, Connected or Failed). Click a row to connect the server, or to select it if it is connected already; either way the centre then shows its panel.
- 4 Recent files lists the last ten
.sqlfiles you opened or saved through pgjumbo’s own Open and Save dialogs, newest first, with their folder. Hover for the full path. Click one to open it the way Open SQL file… would. A file that is no longer there says Not found and cannot be opened, and no file opens while you have no server. - 5 × removes a file from the list. The file itself stays where it is.
The line under Welcome to pgjumbo says Pick up where you left off, or select a server in the Explorer. once you have a server. Before that it says where a password will be kept; see Install pgjumbo. With nothing to list, the cards say Servers you add show here. and The .sql files you open or save show here. If the list of files cannot be read, the card says The recent files could not be read.
The server’s panel
Section titled “The server’s panel”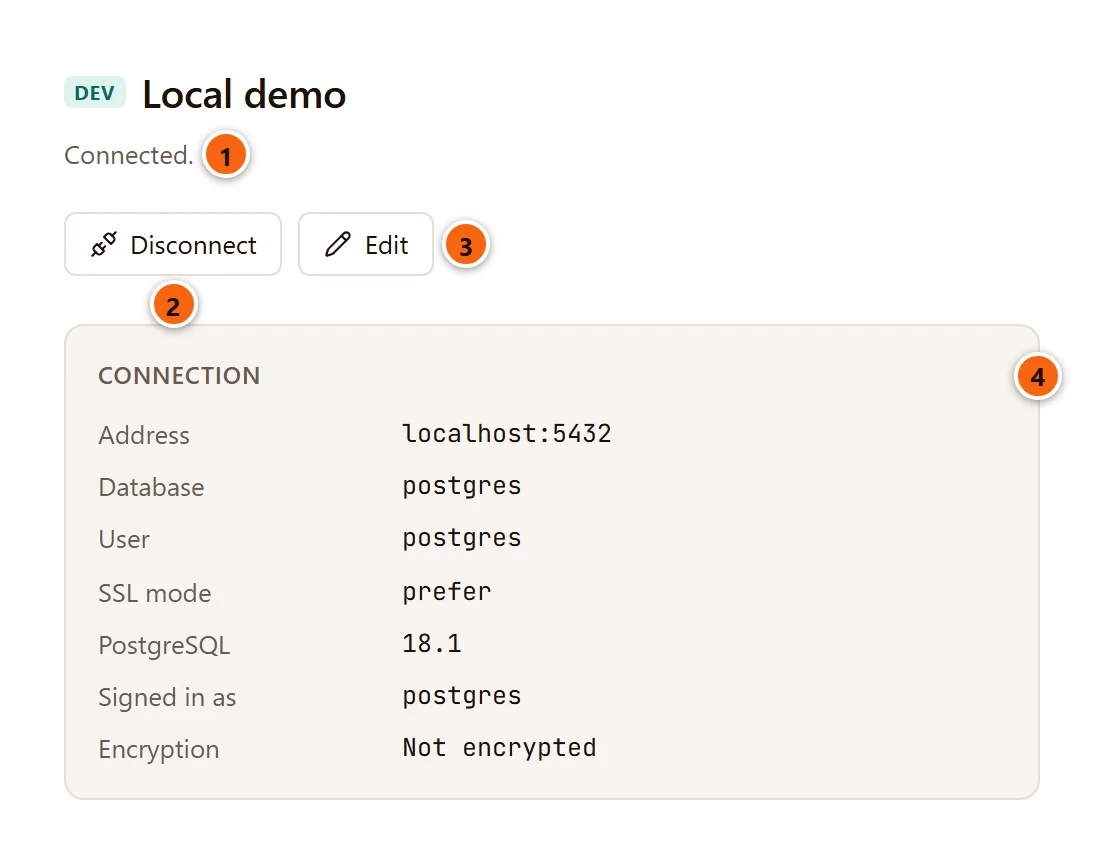
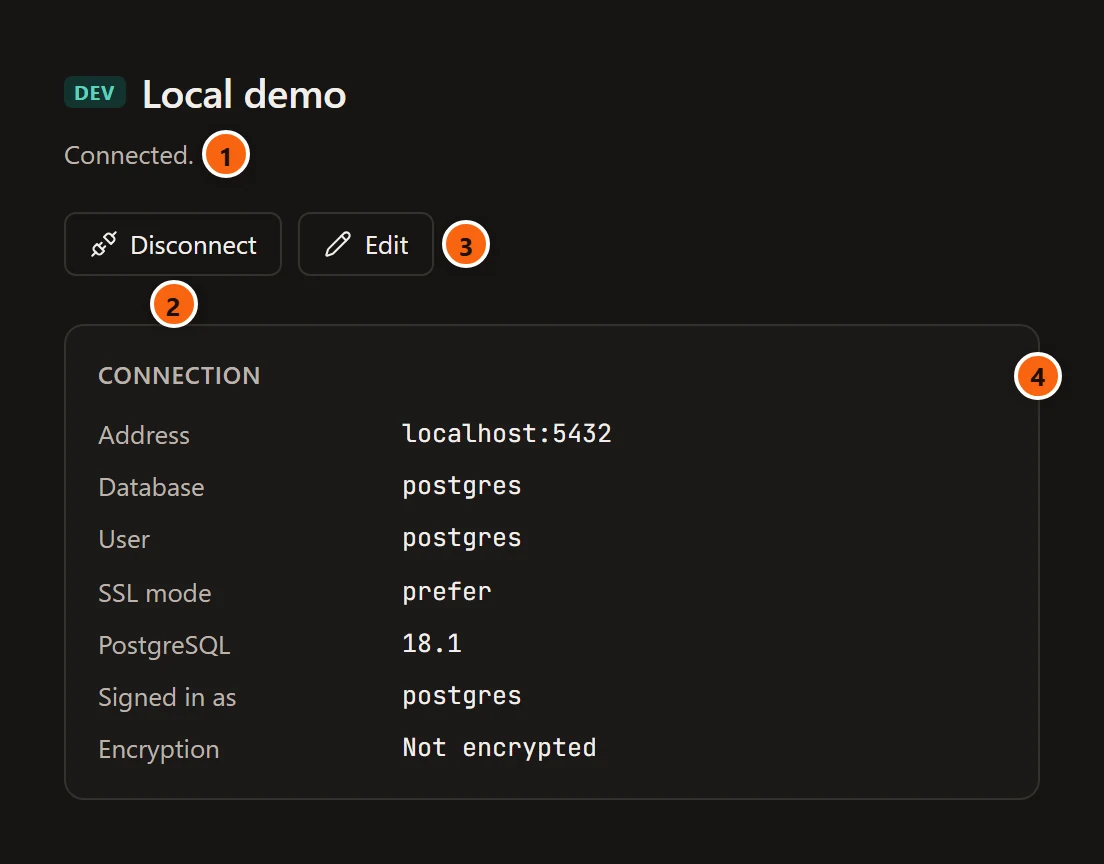
- 1 The environment tag, the server’s name and its state: Connected., Connecting…, Not connected., or Could not connect: with the reason.
- 2 Disconnect, or Connect while the server is not connected (greyed out while it connects).
- 3 Edit opens the Edit connection dialog for a server that is not connected. For a connected one it opens the server’s tab on its Connection view. See Connection settings.
- 4 Connection lists the Address, Database (the one the connection settings name), User ((OS user name) when none is set) and SSL mode. Once connected it adds the PostgreSQL version, who you are Signed in as, and the Encryption (the TLS protocol and cipher, or Not encrypted). A read-only server also shows Sessions: Read-only.
Every tab has its name and a close button (×); a pinned tab shows a pin there instead, and a tab with unsaved changes shows a dot. The tab strip ends with +, which opens a new query tab, and Open tabs, a list of every open tab, at its right end. Right-click a tab for Close, Close Others, Close to the Right, Close All, Pin and Split Right (or Move to the Left and Move to the Right once there are two sides). A Query Tool tab and a psql tab also have Move to New Window, and a psql tab Duplicate Tab.
Besides Query Tool tabs, a tab can hold a table’s rows, PostgreSQL’s own psql in a terminal, an object such as a
table or a role, a server, its reports, a folder’s Object Details, an entity-relationship diagram, a schema
comparison, notifications, scheduled jobs, a database guide or a file of the knowledge base. Tabs
explains the strip; PSQL Tool, Object tabs and review and
The server’s tab explain those kinds.
Move to New Window opens the tab alone in a window of its own, with the status bar (and a Query Tool’s toolbar) but no Explorer, Inspector or tab strip; closing that window brings the tab back here. See Move a tab to its own window.
⌘ W (Ctrl+W on Windows and Linux) closes the tab in front.
The right pane
Section titled “The right pane”The right pane shows the Inspector or the Assistant, one at a time, at the same width.
The Inspector describes what you selected in the Explorer: its Summary, the SQL that creates it, and for some objects Statistics and Dependencies. With nothing selected, or when the selected object’s server is not connected, it says Select an object in the Explorer to see its properties and SQL. For a folder it says how many objects are in it. The Inspector explains every view.
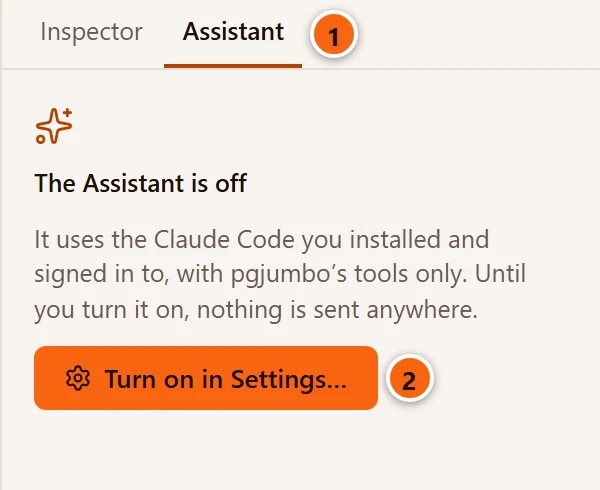
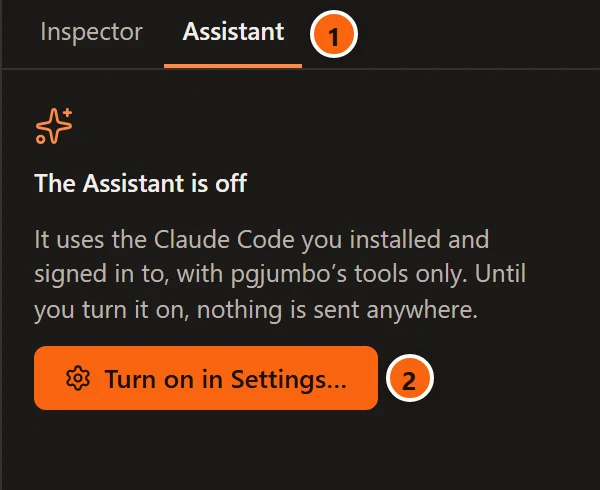
- 1 Inspector and Assistant tabs switch the pane. They are there while the Assistant is turned on, or while the pane shows the Assistant.
- 2 Turn on in Settings… opens Settings. Until you turn the Assistant on there, the pane says The Assistant is off and nothing is sent anywhere.
⌘ J (Ctrl+J on Windows and Linux) or ViewAssistant shows the Assistant in the right pane, opening the pane if it was hidden. Press it again to go back to the Inspector, or to hide the pane again if the key had opened it. Once the Assistant is on, the pane says Looking for Claude Code… while it checks, and Claude Code cannot be used yet with the reason, Check again and Settings… when it cannot start it. Set up the Assistant and Ask the Assistant explain the rest.
The status bar
Section titled “The status bar”

- 1 The environment tag, the server’s colour (if it has one) and the server’s name. With a Query Tool, data, psql, object or server tab in front, it is that tab’s server, followed by › and the database for a query tab, a psql tab or a server’s Activity. Otherwise it is the server selected in the Explorer, and with neither it says Not connected.
- 2 The user you are signed in as, and the server’s address. Shown while the server is connected.
- 3 A closed lock and the TLS version (TLS 1.3) when the connection is encrypted, an open lock and No TLS when it is not. Shown while the server is connected.
- 4 The state. For a query tab, its session: Idle, Active, In transaction, Failed, roll back to continue, Connecting… or Disconnected. Otherwise, and for a restored tab still waiting for its server, the server’s: Connected, Connecting…, Connection failed (hover for the reason) or Not connected.
- 5 pid: the server process that serves the tab. Find it by this number in the server’s Activity.
- 6 The rows of the result in front (2 rows, or Showing 100,000 of 2,345,678 rows when only the first ones were kept) and how long the last run took. The rows show only while a Data Output tab is in front.
- 7 The cursor’s line and column in the editor, and UTF-8, the encoding pgjumbo uses with the server.
Other items appear when they have something to say:
| Item | When | What it says |
|---|---|---|
| Statement 3 of 12 · 0:07 | While a script runs | Which statement it is on, of how many, and for how long. On several databases: 2 of 5 databases. |
| Progress of a long command | While a statement such as CREATE INDEX, VACUUM or COPY runs |
The command, its phase and how far it is, for example CREATE INDEX · building index: scanning table · 42 %, with a bar. Hover for the table it works on. |
| 2 ticked · 1.4 GB | When rows are ticked in Object Details | How many objects are ticked and their size. |
| postgres@localhost, psql 18.1, Running and, on the right, 105 × 26 and UTF-8 | With a psql tab in front | In place of the session’s items: who psql signs in as, its version and its state (Starting…, Running or Ended); on the right, the terminal’s columns and rows, and the encoding psql writes in. See PSQL Tool. |
| Live · every 2 s or Paused | With a server’s Activity view in front | In place of the state: whether Activity is reading. Beside it 12 sessions · 3 locks and Updated with the time of the last read. |
| 1 job running or Jobs · 4 | Once a backup, restore, maintenance or other job has run since pgjumbo started | Click it to open the Jobs panel. It goes away when no job runs and you clear the finished ones there. See Maintenance and jobs. |
Show, hide and resize the panes
Section titled “Show, hide and resize the panes”| Pane | Show or hide it | Keys |
|---|---|---|
| Left pane (Explorer and Library) | ViewExplorer | ⌘ 0 (Ctrl+B on Windows and Linux) |
| Left pane on its Library tab | ViewLibrary | |
| Right pane (Inspector or Assistant) | ViewInspector | ⌥ ⌘ 0 (Ctrl+Shift+B on Windows and Linux) |
| Assistant in the right pane | ViewAssistant, or the toolbar’s Assistant button | ⌘ J (Ctrl+J on Windows and Linux) |
The View menu ticks the panes that are showing. A hidden pane comes back by itself when you need it: Open Quickly (for an object it shows in the tree rather than in a tab) and ViewShow in Explorer show the Explorer, and ObjectProperties on an object without a tab of its own shows the right pane.
To resize a pane, drag its inner edge. Or press Tab until the edge has the focus, then use the arrow keys, 16 pixels a press; Home and End make the pane as narrow or as wide as it goes. The left pane is 200 to 560 pixels wide, the right pane 240 to 720. In a Query Tool, the bar between the editor and the results moves the same way, with the up and down arrows.
| Menu item | What it does | Keys |
|---|---|---|
| ViewZoom In | One step larger. | ⌘ = (Ctrl+= on Windows and Linux) (or with +) |
| ViewZoom Out | One step smaller. | ⌘ - (Ctrl+- on Windows and Linux) |
| ViewActual Size | Back to 100 %. | none |
The steps are 67, 75, 80, 90, 100, 110, 125, 150, 175 and 200 %. Zoom scales the whole window, text, lists and icons alike, and the text stays sharp. Zoom In greys out at 200 %, Zoom Out at 67 % and Actual Size at 100 %. Actual Size has no key, because ⌘ 0 is the Explorer on a Mac.
Light and dark
Section titled “Light and dark”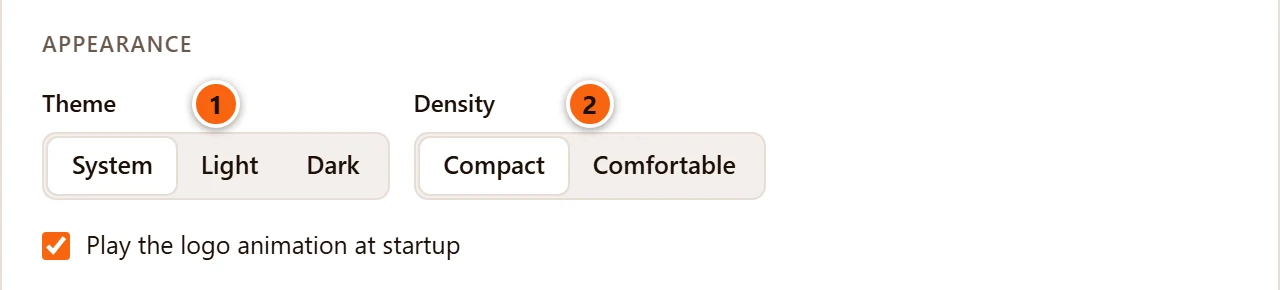
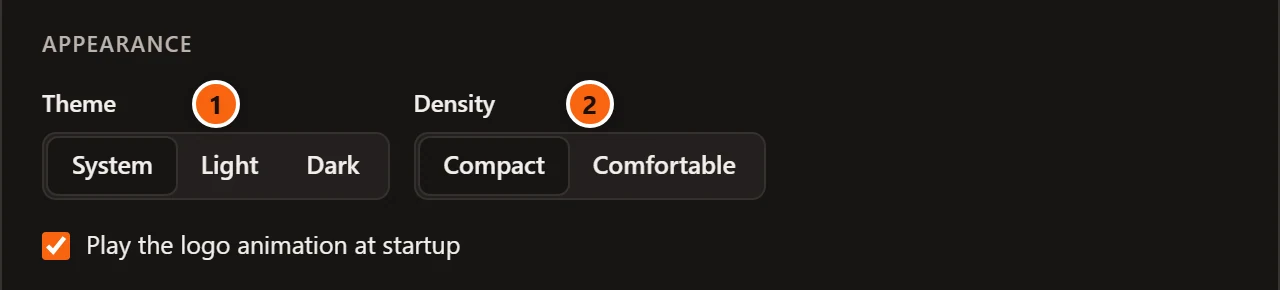
- 1 Theme: System, the default, follows your system’s light or dark setting and changes when it does. Light and Dark keep to one, whatever the system says. The window’s own title bar follows too.
- 2 Density: Compact (the default) or Comfortable rows in lists, trees and grids.
Both are in Settings, under Appearance; click Save to apply them. Settings describes every other setting.
What pgjumbo keeps between runs
Section titled “What pgjumbo keeps between runs”When you quit and start again, pgjumbo puts the window back as you left it:
- the window’s size and place, and whether it was maximised or full screen;
- which panes are showing, their widths, and which tab each side pane was on;
- the Inspector’s view, and the Explorer’s Show system objects and Show object counts;
- the server groups you closed in the Explorer;
- the height of the Query Tool’s editor;
- your Query Tool tabs, with their SQL, cursor and file, the one in front, and the pinned ones;
- the zoom;
- the view a table’s tab opens on, the panes open in Activity and the columns hidden in Object Details;
- the servers you connected lately, for the start page.
Other tabs (a table’s rows, psql tabs, object tabs, a server’s tab, reports and the rest) close with the window. A Query Tool that was in a window of its own comes back in the main window; the tab’s window itself is not kept. Servers start disconnected, so the tree’s open rows are not reopened, and restored Query Tool tabs wait until you connect their server. Where all this is kept is on Where pgjumbo keeps your data.
Menus on each system
Section titled “Menus on each system”pgjumbo uses your system’s own menus. The items are the same everywhere; where they sit differs:
| macOS | Windows | Linux | |
|---|---|---|---|
| Where | The menu bar at the top of the screen | A menu bar inside the window | A menu bar inside the window |
| Menus | pgjumbo, File, Edit, View, Object, Query, Tools, Window, Help | File, Edit, View, Object, Query, Tools, Help | File, View, Object, Query, Tools, Help |
| Settings | pgjumboSettings… | FileSettings… | FilePreferences… |
| About | pgjumboAbout pgjumbo | HelpAbout pgjumbo | HelpAbout pgjumbo |
| Quit | pgjumboQuit pgjumbo, ⌘ Q | FileExit | FileQuit, Ctrl+Q |
On a Mac the pgjumbo menu also has Services, Hide pgjumbo (⌘ H), Hide Others (⌥ ⌘ H) and Show All; File has Close Window (⇧ ⌘ W), because ⌘ W closes a tab; View has Enter Full Screen (⌃ ⌘ F); and Window has Minimize (⌘ M), Zoom and Bring All to Front. Edit has Undo, Redo, Cut, Copy, Paste and Select All on a Mac and on Windows. Linux has no Edit menu, but the same keys work in every field and in the editor.
Items grey out while there is nothing for them to act on, and Explorer, Inspector, Assistant, System
Objects, Auto-commit and Results as Text show a tick while they are on. Their keys work wherever the focus is
in the window, but not while a dialog is open. The web view’s own keys for reloading and printing do nothing in
pgjumbo, so ⌘ R (Ctrl+R on Windows and Linux) is Refresh, and on Windows and Linux Ctrl+P is
Open Quickly. No
shortcut uses Ctrl+Alt, so the AltGr key on Windows and Linux keeps typing characters such as [, { and @. In a
psql tab’s terminal most keys go to psql instead (see PSQL Tool).
With a tab in a window of its own, the menu bar on a Mac acts on the window in front. On Windows and Linux a tab’s window has no menu bar, and the keys of its tab’s menu items work there instead.
The Help menu opens this guide (pgjumbo User Guide), the contact form on pgjumbo.com (Report an Issue…) and pgjumbo.com itself (pgjumbo Website) in your browser. It also has Open Log Folder, which opens the folder of pgjumbo’s logs in your file manager, and Copy Diagnostics…, a report to paste into a bug report. Menus lists every item of every menu, and Keyboard shortcuts every key.
Right-clicking shows pgjumbo’s own menus where it has them, and the system’s Cut, Copy and Paste in text fields and the SQL editor. Elsewhere it shows nothing.