
The server's tab
Each server has one tab for everything about the server itself rather than one database: what it is doing, its settings, who may connect, how it replicates, its log, and pgjumbo’s own connection settings for it. This page covers the tab, its header and the Overview, Authentication, Replication, Logs and Connection views. Activity and Configuration have pages of their own: Activity and Server configuration.
Open the server’s tab
Section titled “Open the server’s tab”Every way in needs the server connected.
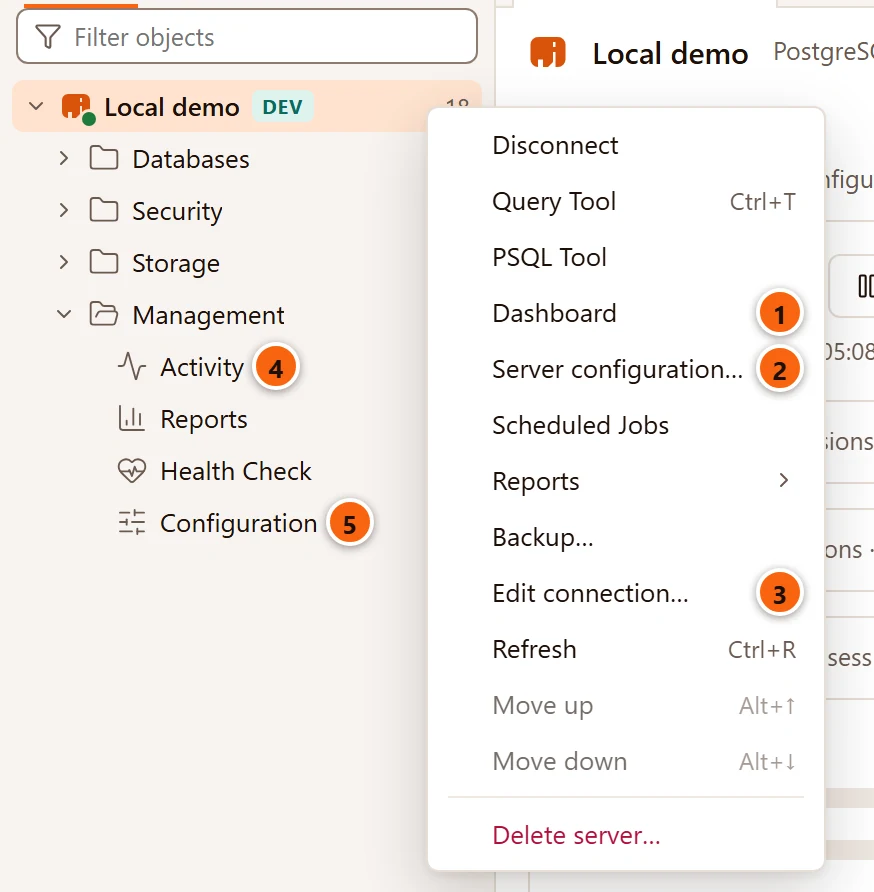
- 1 Right-click the server and choose Dashboard: the tab opens on Activity.
- 2 Server configuration… opens it on Configuration.
- 3 Edit connection… opens it on Connection when the server is connected. On a server that is not connected it opens the Edit connection dialog instead (Connection settings).
- 4 Under the server, the Management folder holds Activity. Double-click it, select it and press Enter, or right-click it and choose Open.
- 5 Configuration in the same folder opens the tab on Configuration the same ways. Reports and Health Check there open the reports tab instead (Reports, Health check).
The other ways in:
| Where | What opens |
|---|---|
| ToolsServer Activity in the menu bar | The tab on Activity, for the server selected in the Explorer when it is connected, else for the server of the tab in front. The item is greyed out when neither is connected. |
| ToolsServer Configuration | The tab on Configuration, for the same server. |
| The pencil button that shows when you point at a server in the Explorer (its tooltip says Edit and the server’s name) | The same as Edit connection…: the tab on Connection on a connected server, else the Edit connection dialog. |
| Open in Activity on a finding of the Health check | The tab on Activity. |
| Open Configuration on Scheduled jobs, when pg_cron is not loaded | The tab on Configuration. |
| Stage in Configuration on a settings card of the Assistant (What the Assistant proposes) | The tab on Configuration, with the card’s values added to its draft. |
| Review… on that card, once its values are staged | The tab on Configuration. |
A server has one tab. When it is open already, each of these brings it to the front and switches it to the view named. The tab sits in the tab strip with the query tabs: an elephant icon, the server’s name, and a Prod tag on a Production server (Tabs).
Close it with its ×, or with FileClose Tab (⌘ W (Ctrl+W on Windows and Linux)) while it is in front. If Configuration holds changes that are not saved, pgjumbo asks first (Server configuration). Server tabs are not reopened when pgjumbo starts again; query tabs are.
The header and its views
Section titled “The header and its views”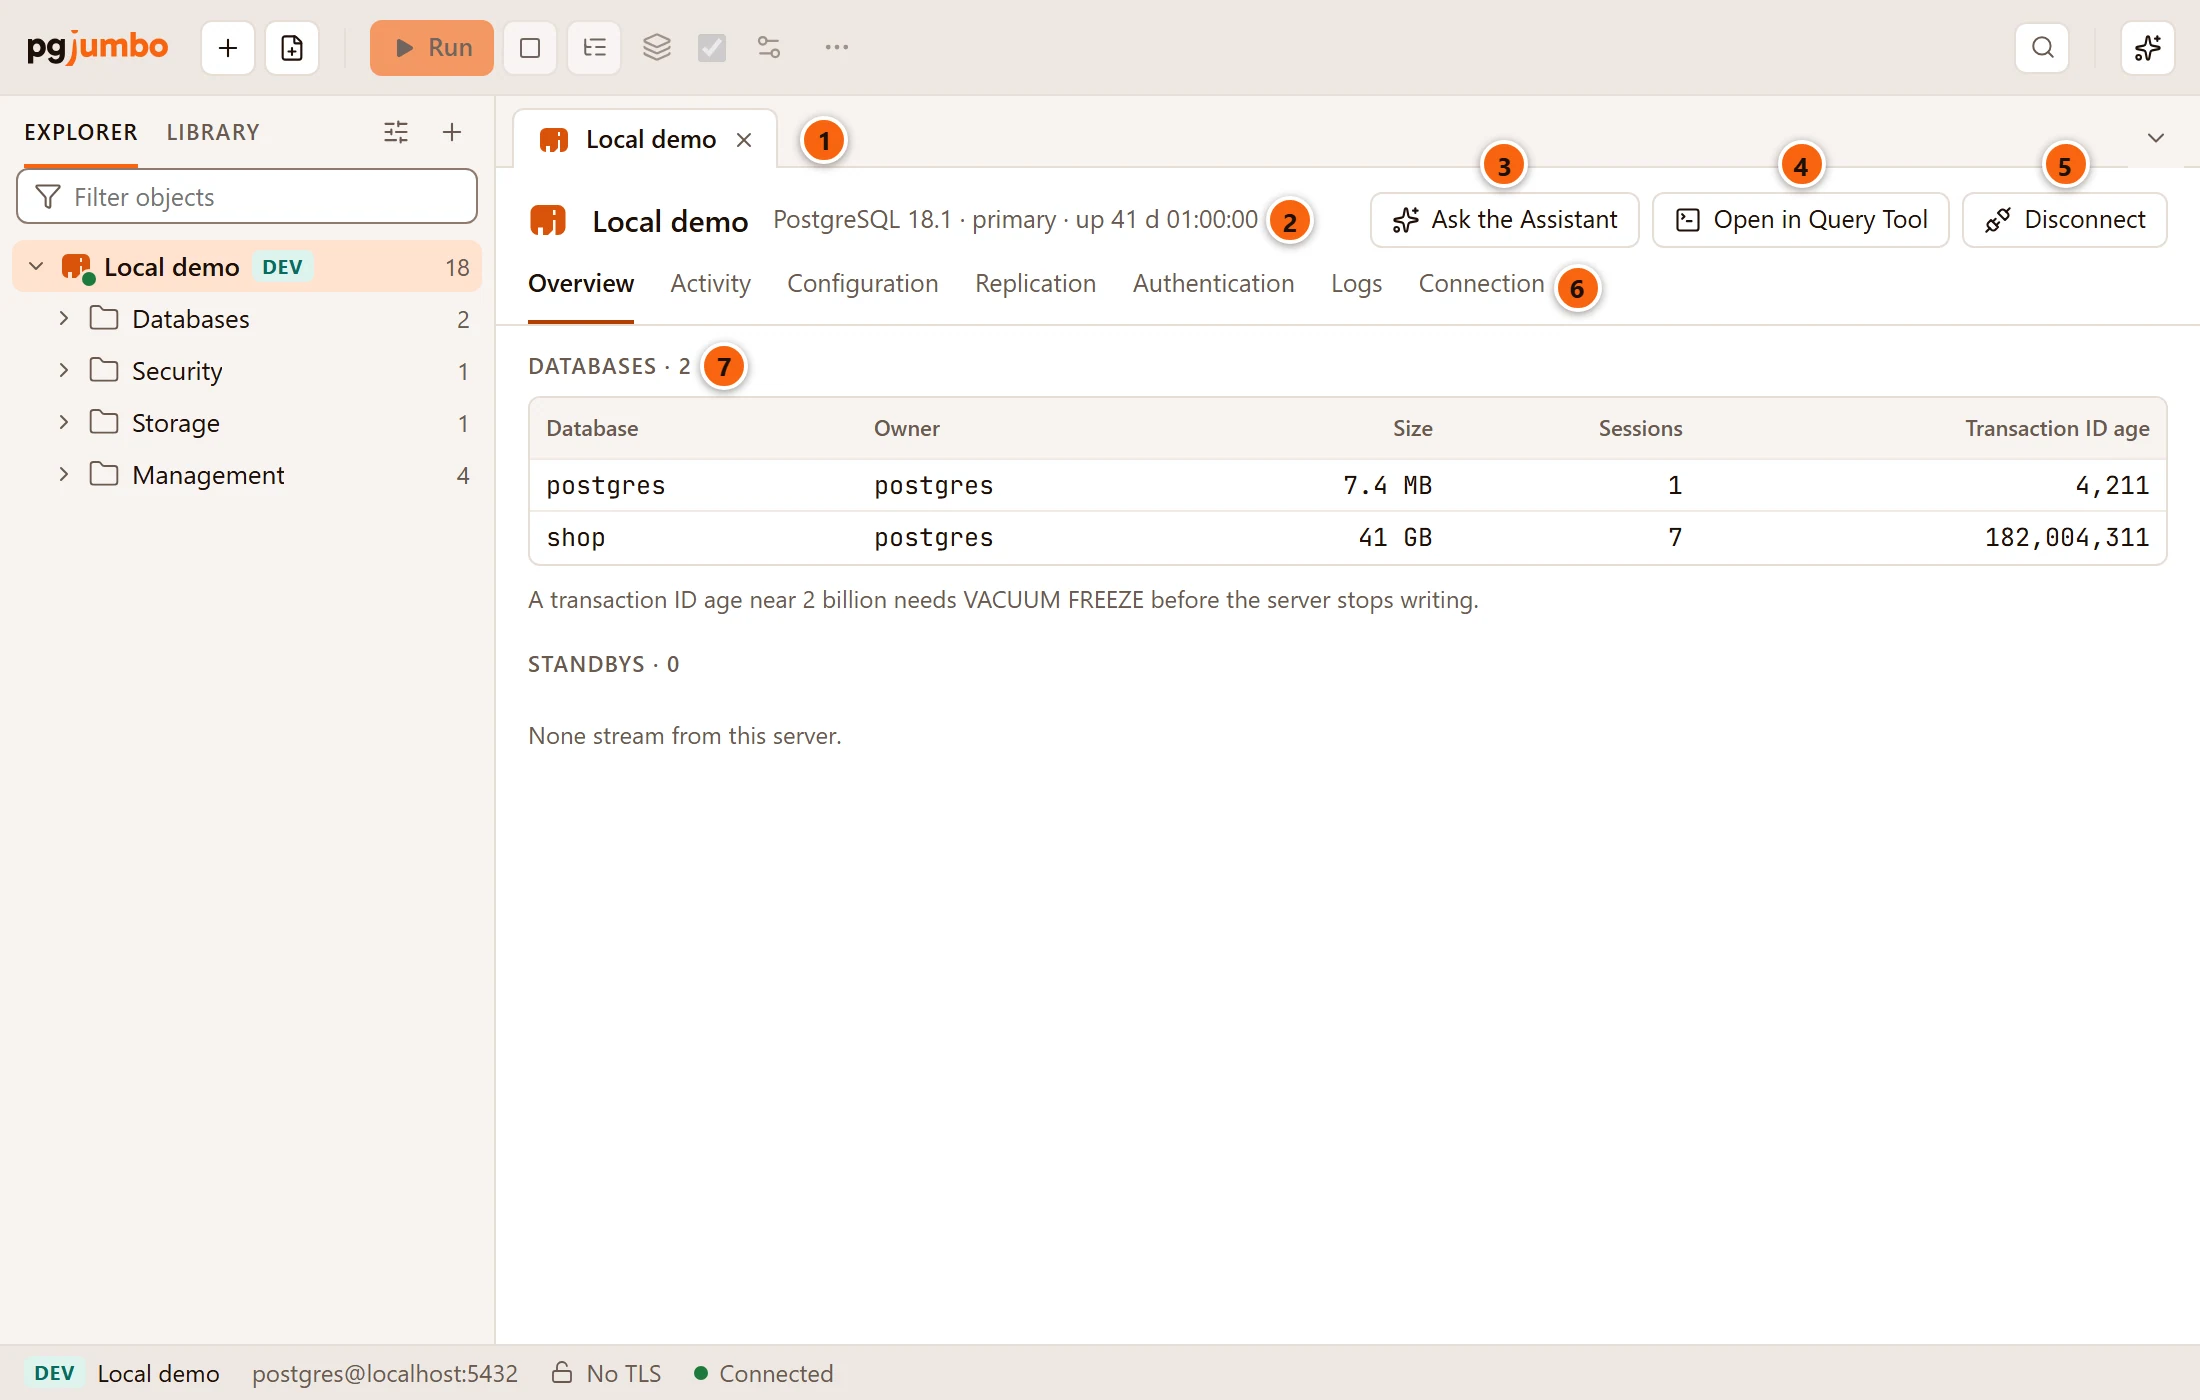
- 1 The tab in the strip, named after the server.
- 2 The server’s version, primary or standby, and how long it has been up (
up 41 d 01:00:00: days, then hours, minutes and seconds). The version shows only while the server is connected. - 3 Ask the Assistant asks the Assistant about the view in front. It shows only while the Assistant is on (Set up the Assistant), the server is connected and the view has a question; see Ask the Assistant about a view.
- 4 Open in Query Tool opens a new Query Tool on the server’s maintenance database (the button’s tooltip names it). See The Query Tool.
- 5 Disconnect disconnects the server, as Disconnect in the Explorer does (Manage your servers), without asking first: queries still running are cancelled and open transactions in Query Tools are rolled back. The tab stays open.
- 6 The views. Click one to show it. Configuration gets a dot while it holds changes not saved yet.
- 7 The view in front, here Overview with its Databases table.
Open in Query Tool and Disconnect show only while the server is connected.
| View | What it shows |
|---|---|
| Overview | The server’s databases and the standbys streaming from it (below). |
| Activity | What the server is doing now: sessions, waits, locks, the costliest statements. See Activity. |
| Configuration | Every setting, and changing them with ALTER SYSTEM. See Server configuration. |
| Replication | Standbys, replication slots, or where a standby reads from (below). |
| Authentication | The rules of pg_hba.conf (below). |
| Logs | The server’s log files (below). |
| Connection | pgjumbo’s own settings for reaching the server (below). |
Overview, Authentication, Replication and Logs read the server on pgjumbo’s connection to its maintenance database. None of them reads table rows. While a view reads, it says so (Reading the rules…, Reading how the server replicates…); when a read fails, the view shows the error instead.
When the server is not connected
Section titled “When the server is not connected”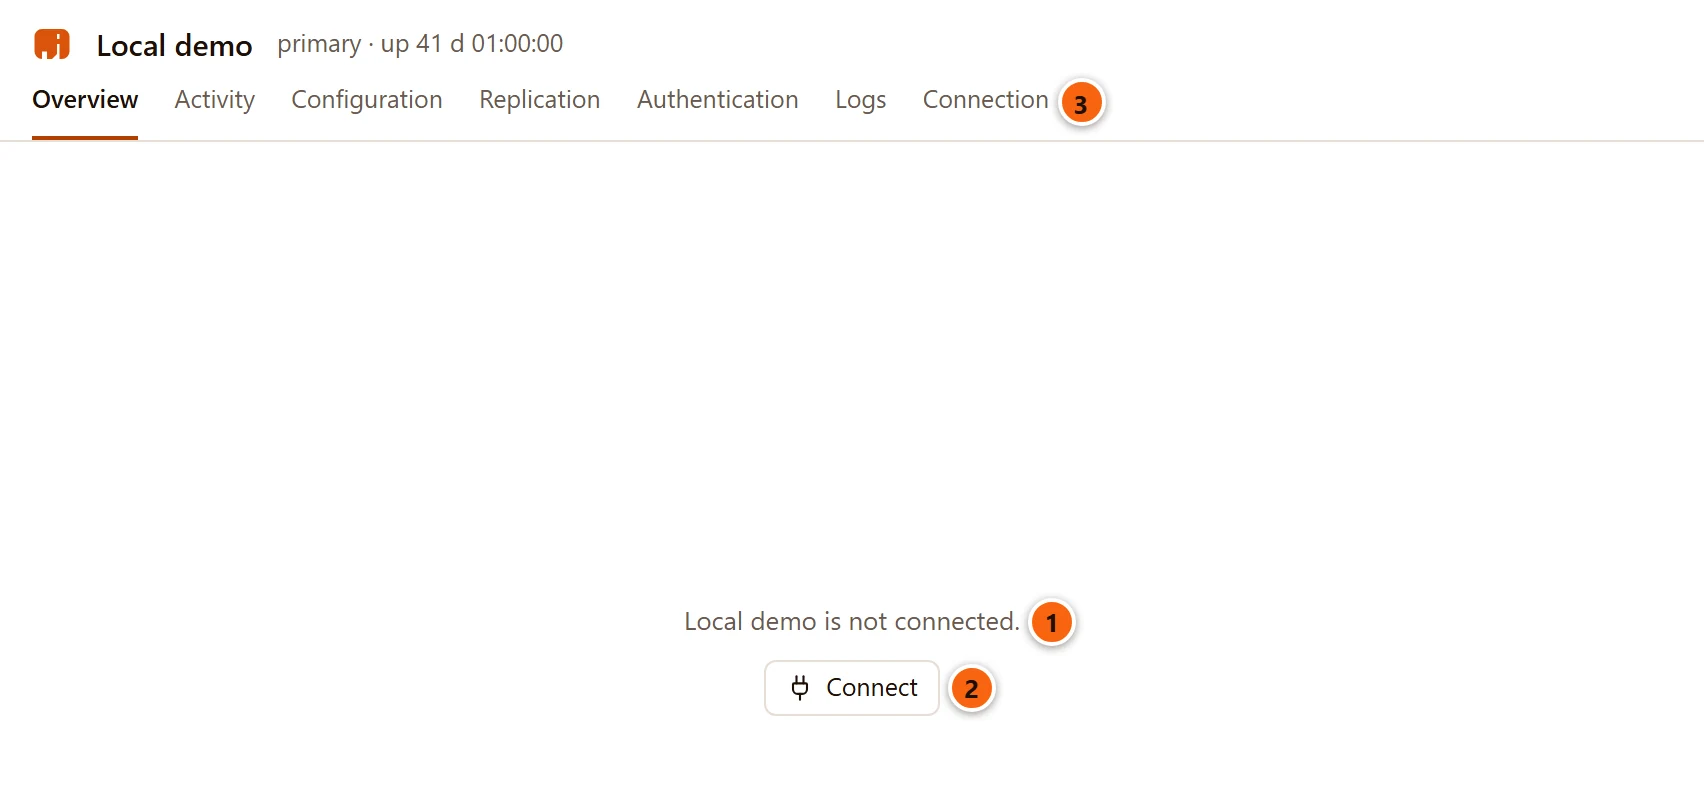
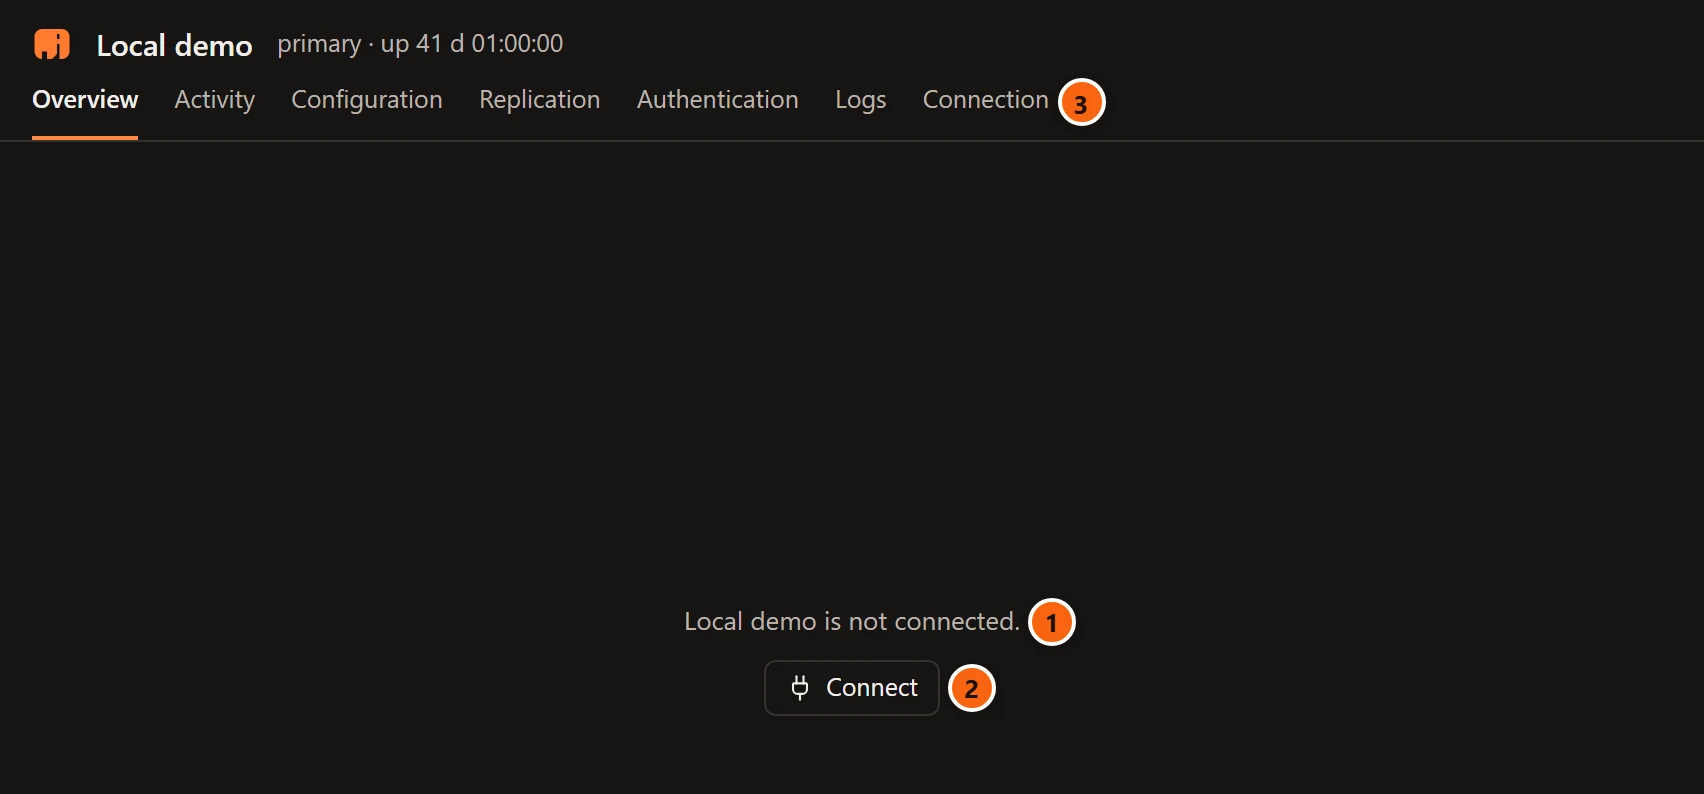
- 1 Every view but Connection says the server is not connected (or Connecting… while it connects).
- 2 Connect connects it, as a double-click in the Explorer does.
- 3 Connection still works: it edits pgjumbo’s settings for the server, which needs no connection.
Overview
Section titled “Overview”Overview reads the server when you show the tab and each time you come back to it. It has two tables.
Databases lists every database except the templates:
| Column | What it says |
|---|---|
| Database | Its name. |
| Owner | The role that owns it. |
| Size | pg_database_size(). A dash where your role may not connect to the database. |
| Sessions | How many sessions pg_stat_activity shows in it. |
| Transaction ID age | age(datfrozenxid): how many transactions old its oldest unfrozen row is. The note under the table reminds you that an age near 2 billion needs VACUUM FREEZE before the server stops writing. See Maintenance and jobs. |
Standbys lists the standbys streaming from this server, from pg_stat_replication: Standby (its application
name, else its address, or local), State, Replay lag and Commit (async, sync, potential or
quorum). With none, it says None stream from this server., and on a standby adds that it is itself a standby.
Unless your role is a superuser or a member of pg_read_all_stats, PostgreSQL hides most of what it knows about each
standby. The Replication view has more on each one.
Authentication
Section titled “Authentication”Authentication shows pg_hba.conf as the server read it, from the pg_hba_file_rules view, one rule per row in
the order the server tries them.
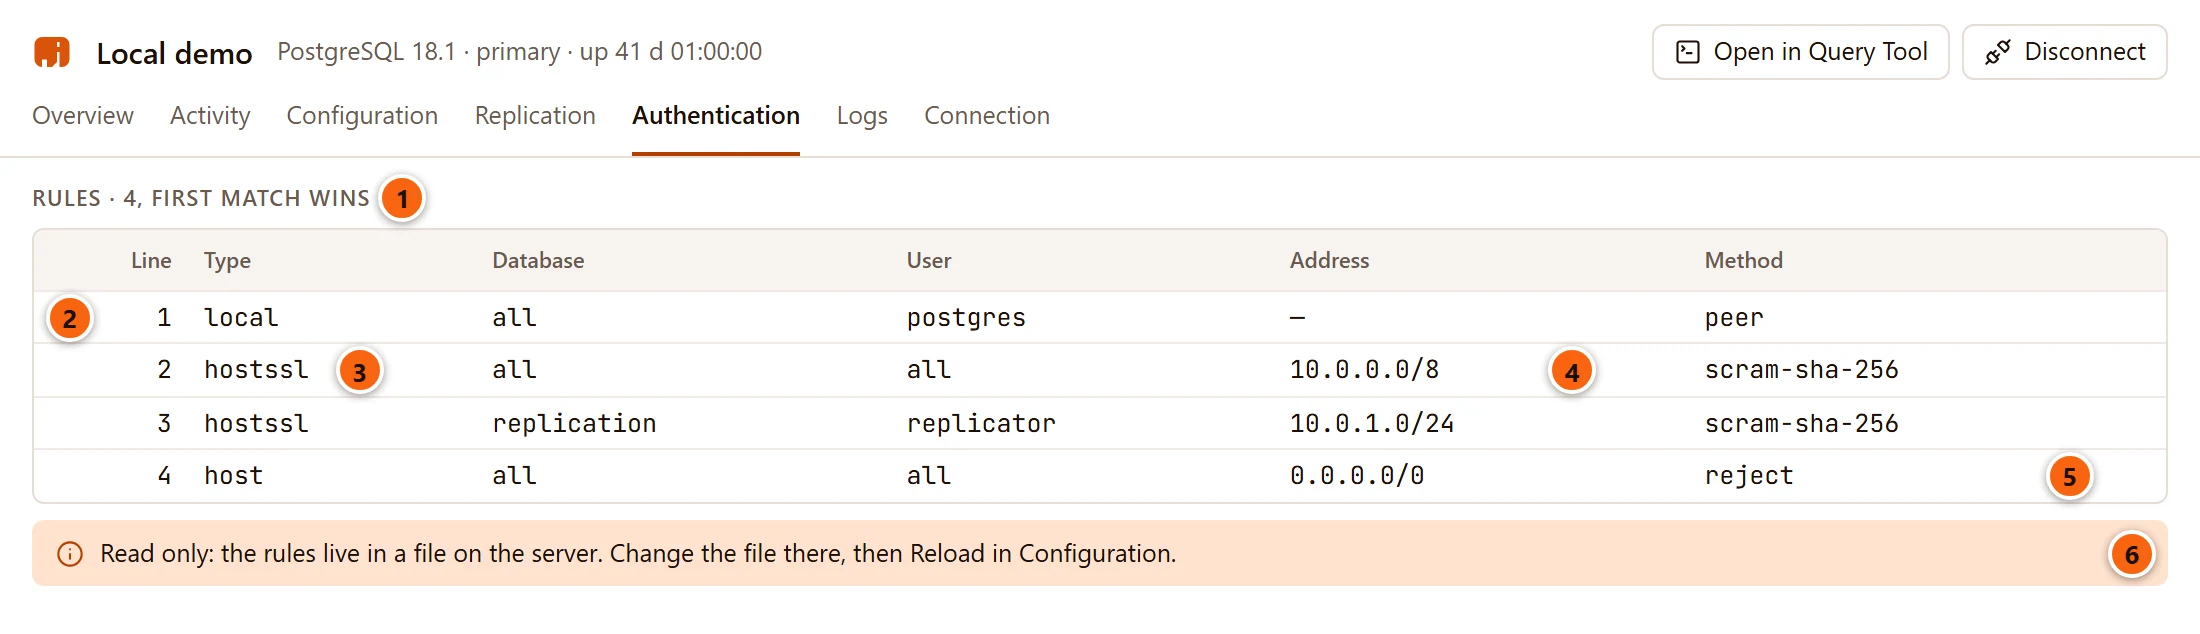
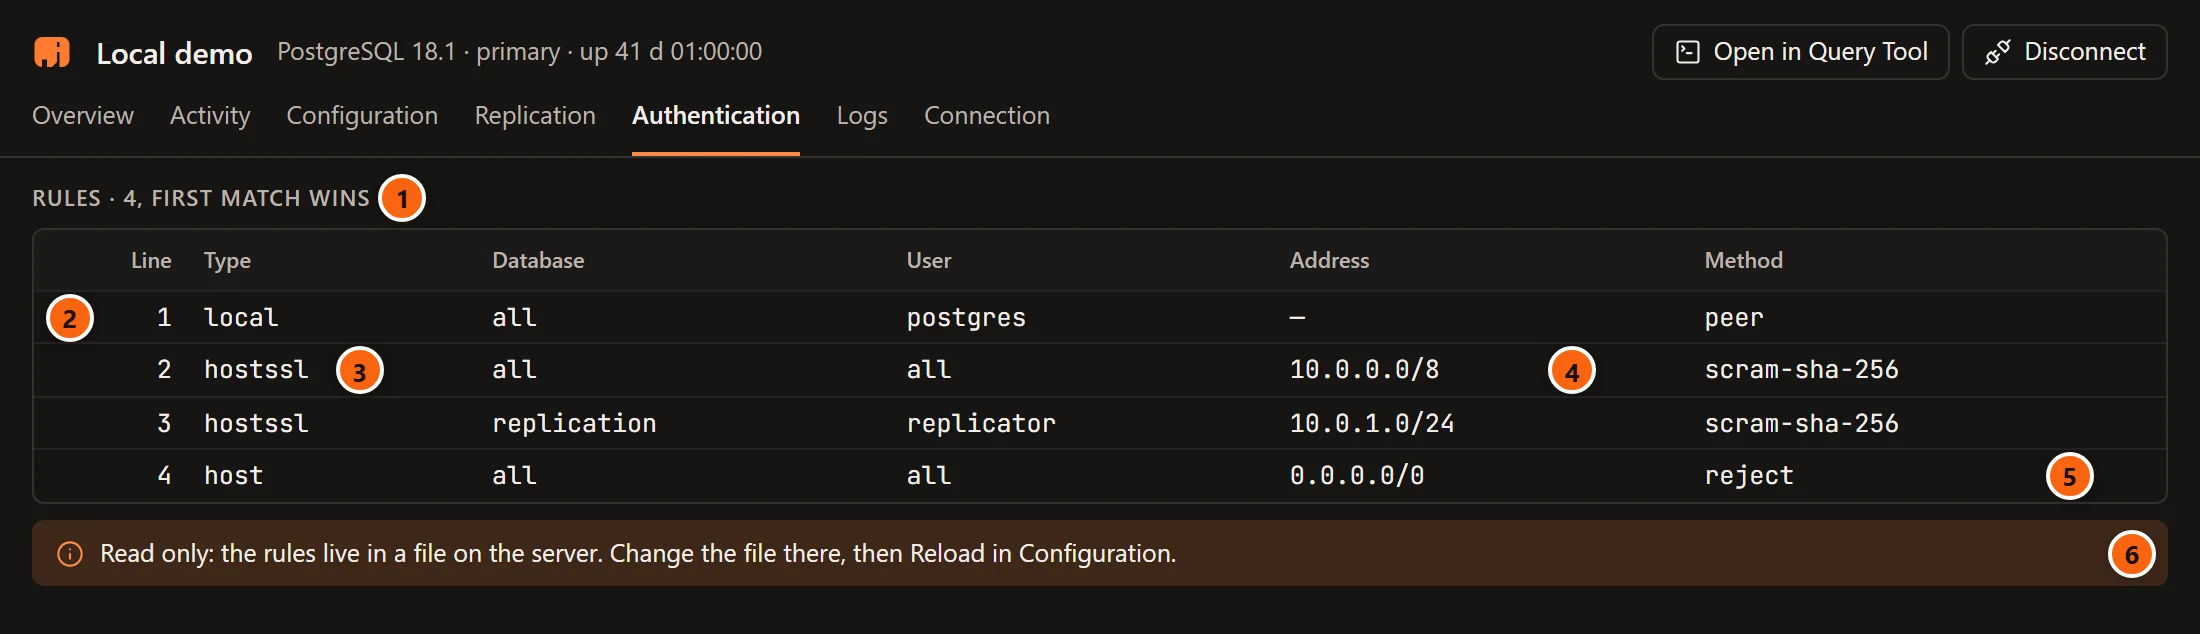
- 1 How many rules there are. The first rule that matches a connection decides how it signs in, or whether it is refused.
- 2 Line: the rule’s line in the file. From PostgreSQL 16 the file can include others; when the rules
come from more than one file, this column says
file:line. Point at it to see the file’s full path. - 3 Type:
local,host,hostssl,hostnossl,hostgssencorhostnogssenc. Database and User list what the rule matches (all,replication, names,+group). - 4 Address is written as in the file: an address and a netmask that fold into a prefix show as
10.0.0.0/8, and alocalrule shows a dash. - 5 Method:
scram-sha-256,md5,peer,cert,rejectand the others, followed by the rule’s options in grey. - 6 The view is read only: the rules live in a file on the server. Change the file there, then click Reload configuration in Configuration.
A line the server could not use shows the server’s reason across its row; the server skips that line.
When the rules cannot be read, the view says why instead:
| Message | Why |
|---|---|
| Seeing the rules needs a superuser, or a role granted SELECT on pg_hba_file_rules. | Your role may not read pg_hba_file_rules. |
| Amazon RDS and Aurora decide who may connect themselves; their rules cannot be read. | The server is Amazon RDS or Aurora (Amazon RDS and Aurora). |
Replication
Section titled “Replication”Replication reads the server again every 5 seconds while it is shown, since lag moves by the second. What it shows depends on whether the server is a primary or a standby. At the bottom, a note reminds you that publications and subscriptions stay in each database, under Replication in the Explorer (Publications and subscriptions).
pgjumbo never promotes a standby. It changes only two things here, and only when you ask: it drops a slot nothing reads, and it pauses or resumes replay on a standby.
On a primary
Section titled “On a primary”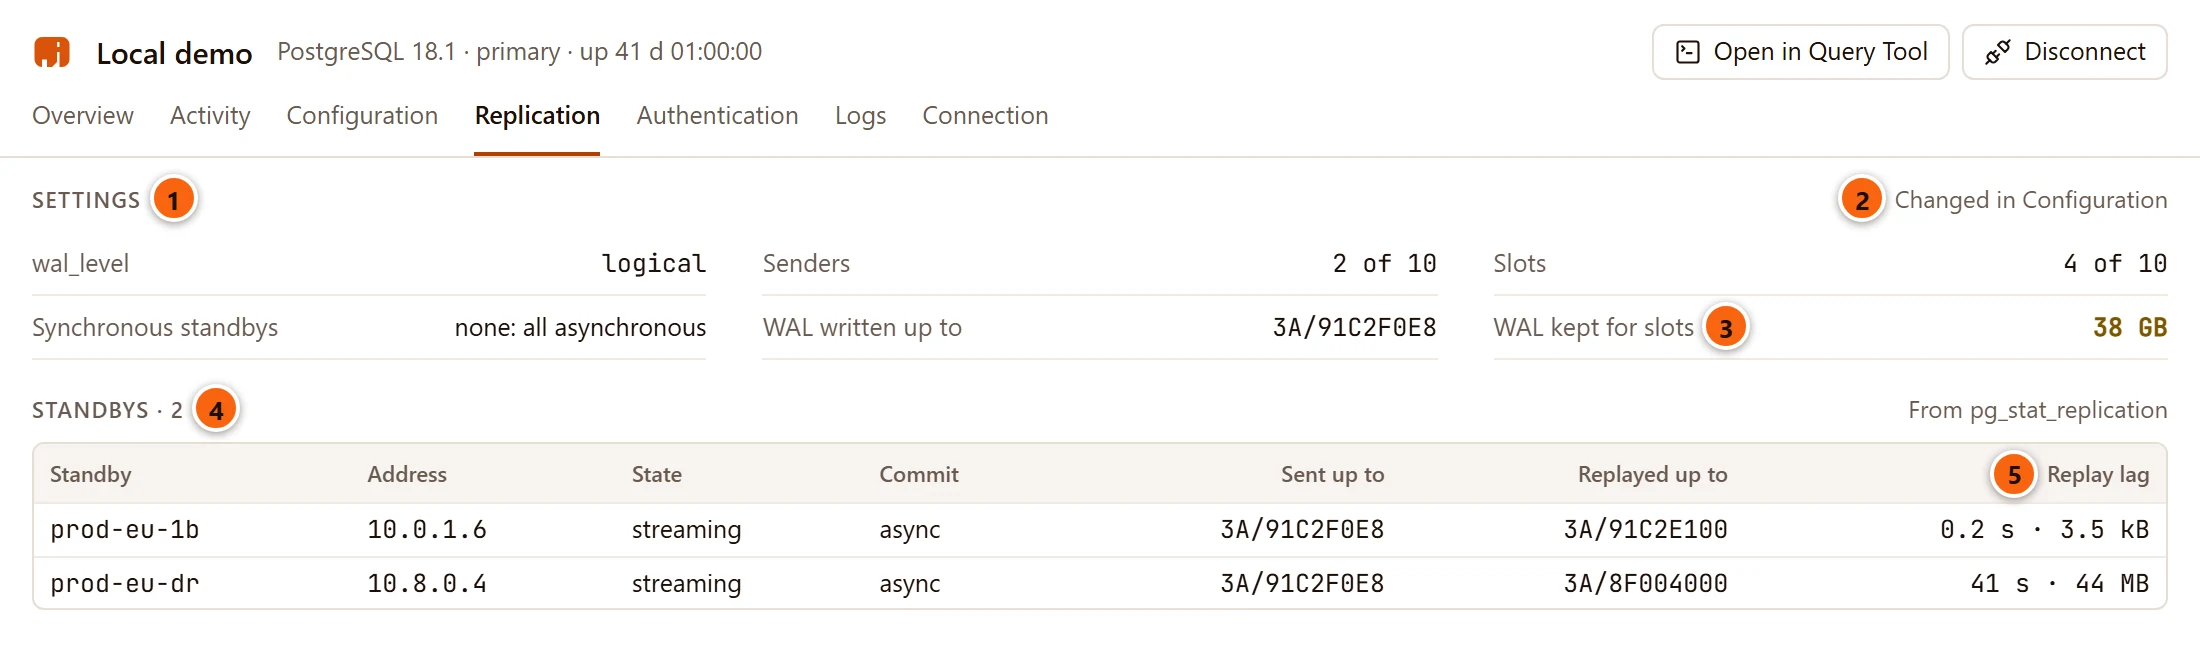
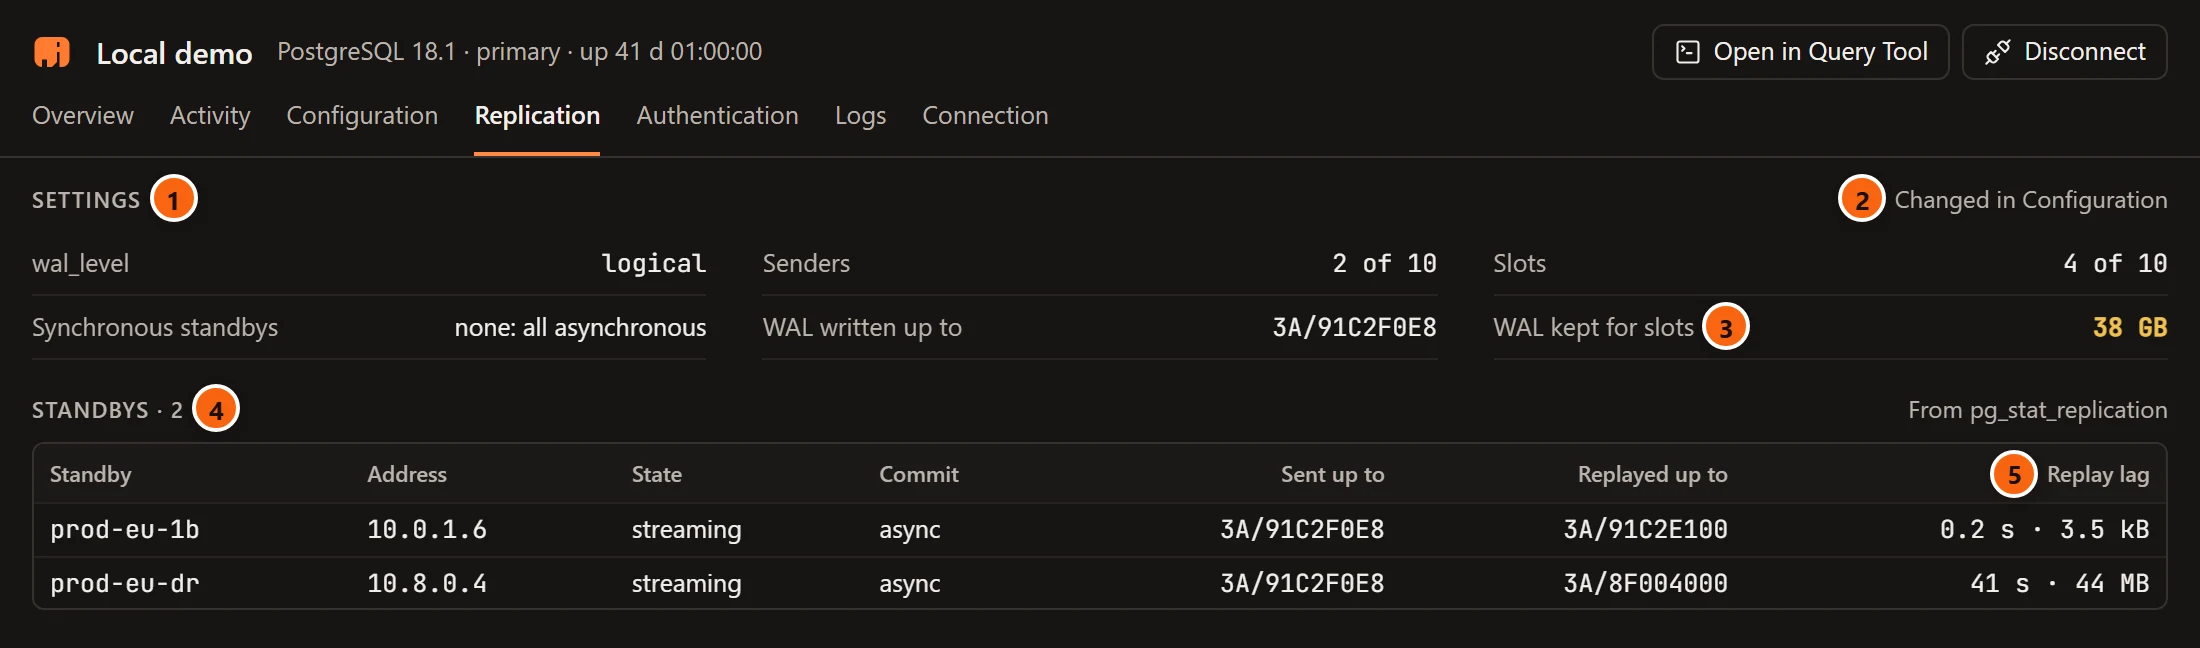
- 1 Settings: how the server is set up to replicate.
- 2 They are changed in Configuration, not here.
- 3 WAL kept for slots is the most WAL any one slot holds back. It turns amber when a slot nothing reads holds a lot (see the slots below).
- 4 Standbys, from
pg_stat_replication. None stream from this server. when there are none. - 5 Replay lag: how far behind the standby is in time, then how much WAL it has not replayed yet.
| Setting | What it says |
|---|---|
| wal_level | replica, logical or minimal. |
| Senders | WAL senders running now, of max_wal_senders. |
| Slots | Replication slots, of max_replication_slots. |
| Synchronous standbys | synchronous_standby_names, or none: all asynchronous. |
| WAL written up to | The server’s current WAL position (LSN). |
| WAL kept for slots | The largest amount of WAL one slot keeps from being removed. |
| Standbys column | What it says |
|---|---|
| Standby | Its application name, else its address. |
| Address | The address it connects from. |
| State | streaming, catchup, backup… |
| Commit | async, sync, potential or quorum. |
| Sent up to | The last WAL position sent to it. |
| Replayed up to | The last position it has replayed. |
| Replay lag | How far behind it is in time, and in bytes of WAL. |
Further down, the slots:
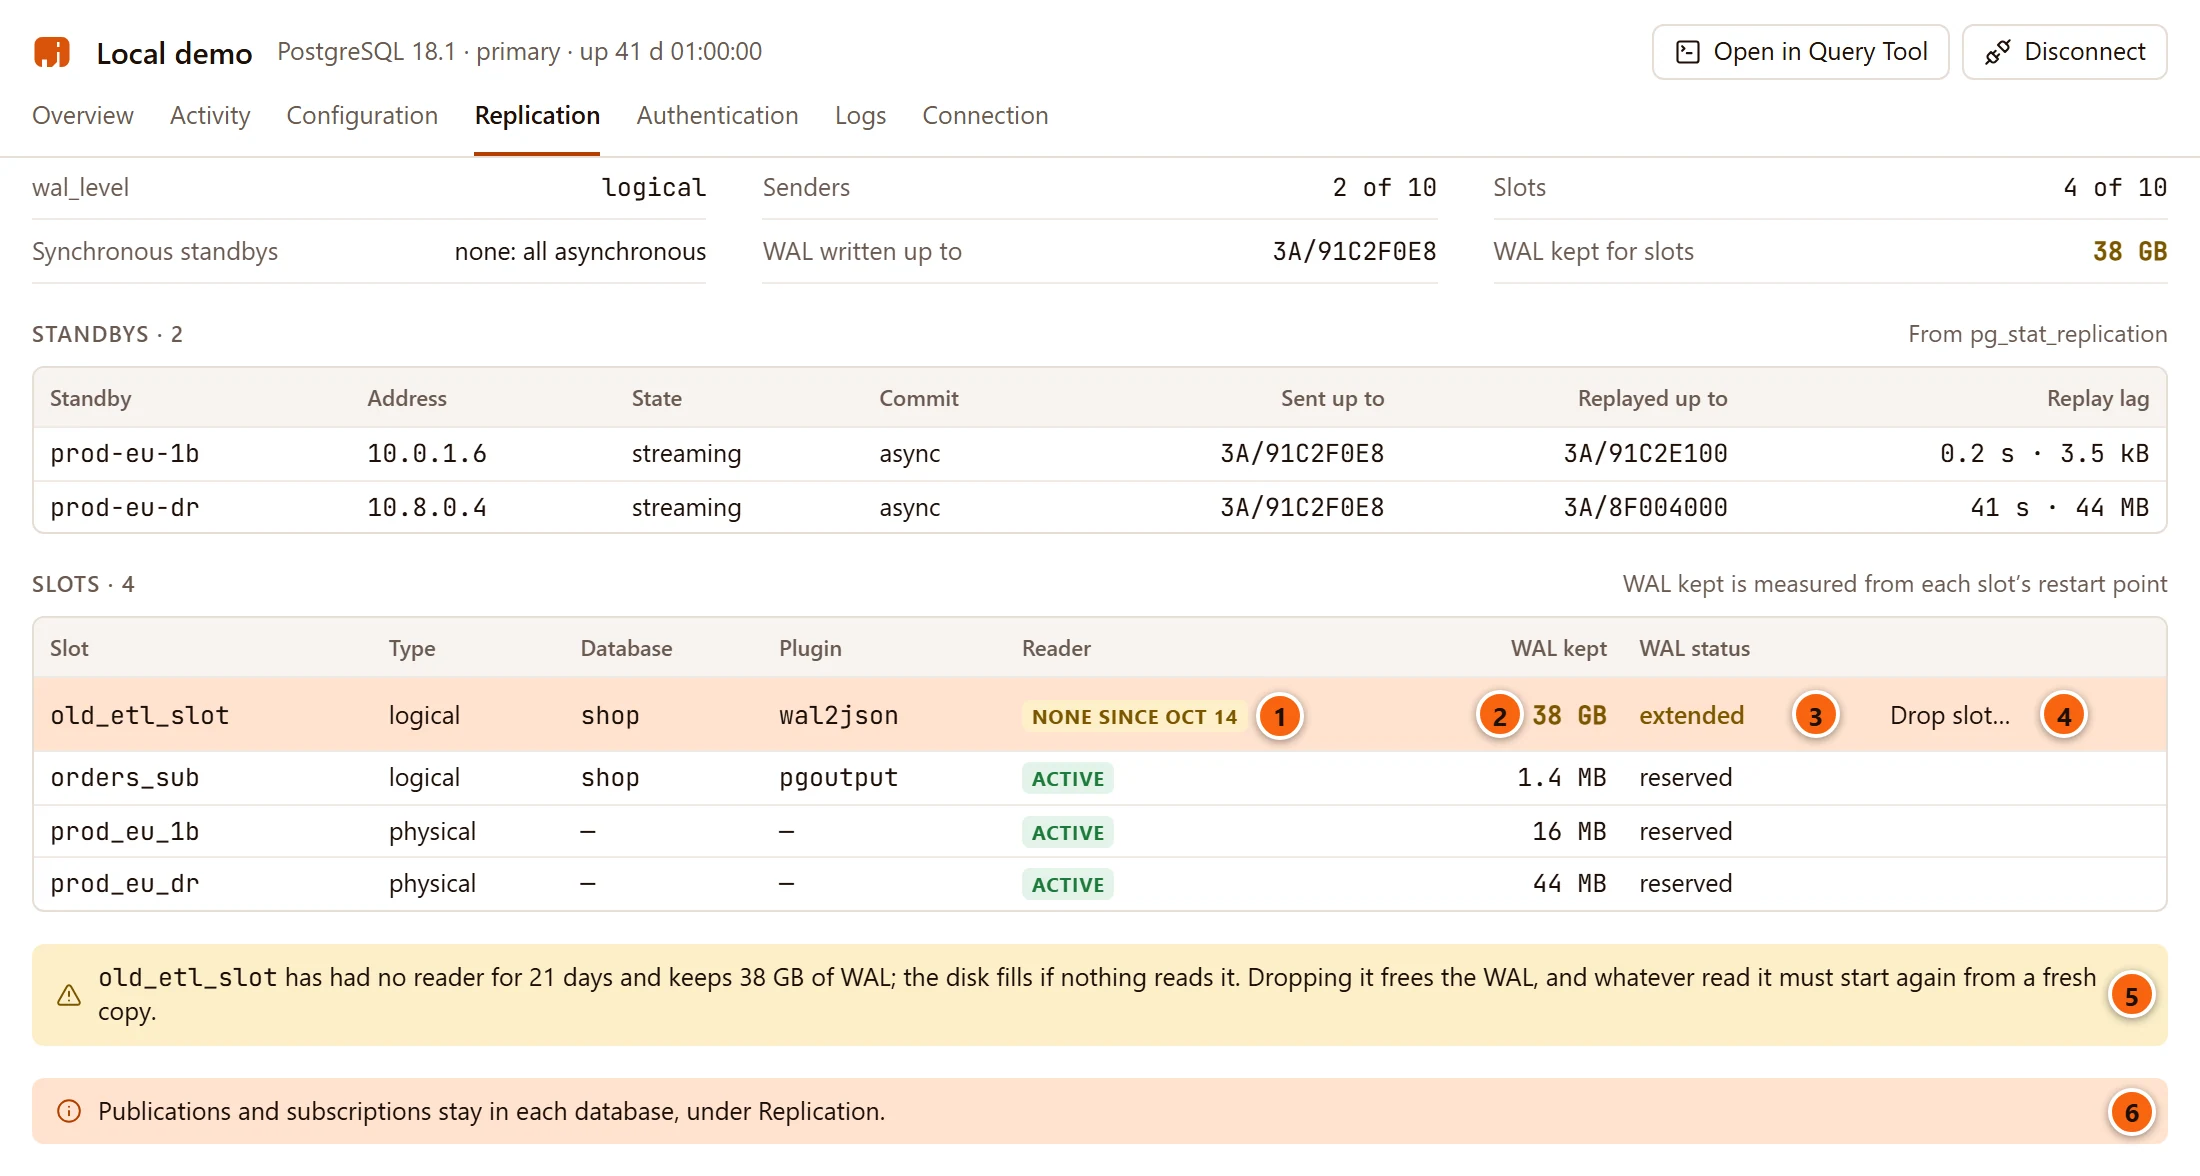
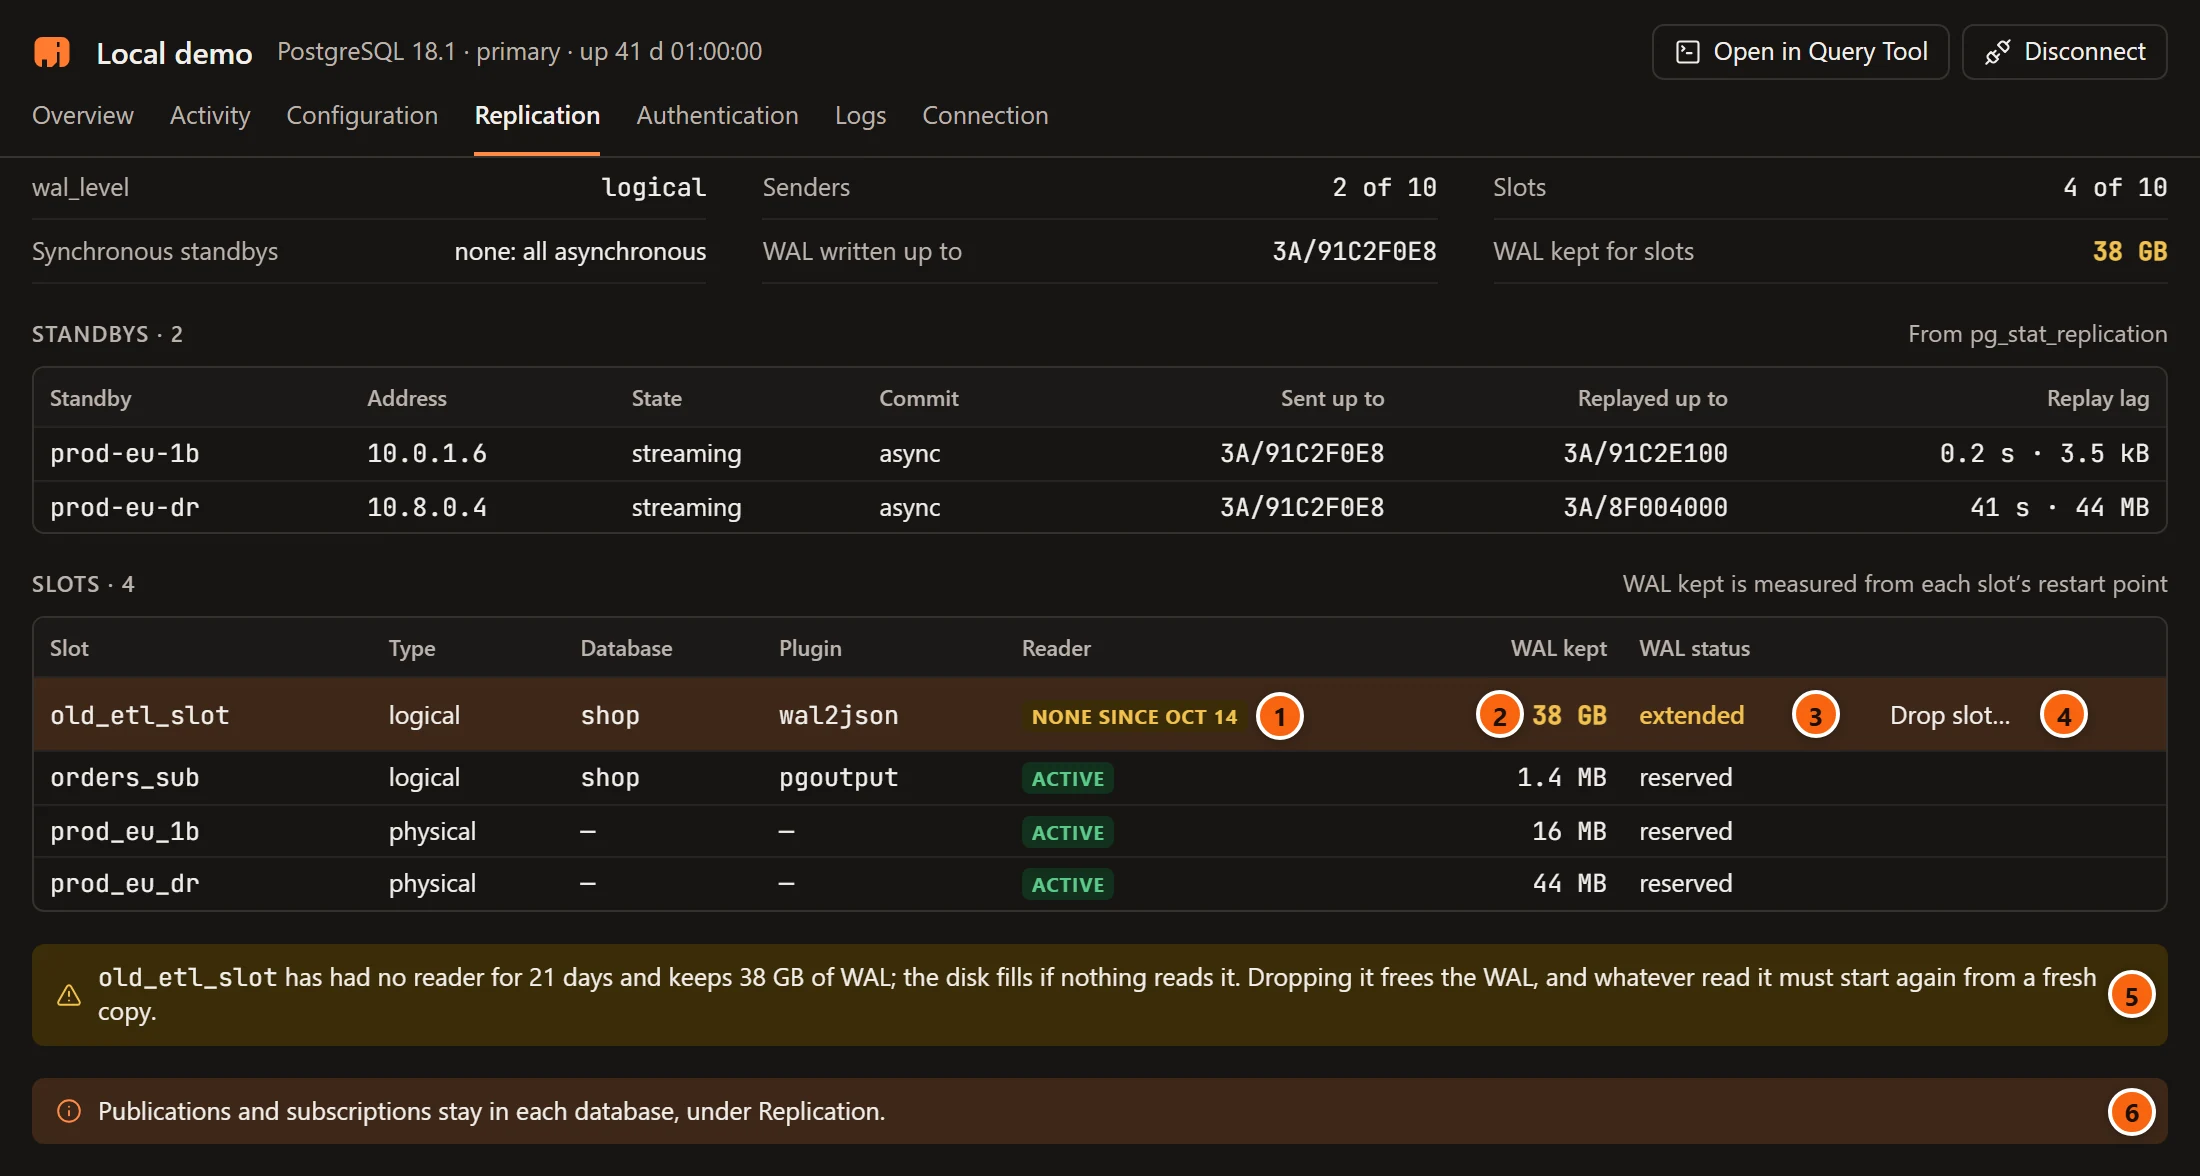
- 1 Reader says Active when something reads the slot now. Otherwise it says None, or from PostgreSQL 17 None since and the date the last reader left.
- 2 WAL kept: how much WAL the slot holds back, measured from its restart point.
- 3 WAL status (PostgreSQL 13 and later):
reserved,extended,unreservedorlost. The last three show in amber: the slot holds more WAL thanmax_wal_size, or its WAL is going or gone. - 4 Drop slot… shows on each slot nothing reads, unless it is temporary.
- 5 The slot nothing reads that keeps the most WAL is called out when it keeps 1 GB or more, or its WAL status
is
unreservedorlost: its row is highlighted, and the note says how long it has had no reader and how much it keeps. The disk fills if nothing reads it. - 6 Publications and subscriptions are in each database, not here.
The other columns are Slot (its name, with · temporary for a temporary slot), Type (logical or
physical), Database and Plugin (for a logical slot, such as pgoutput or wal2json). The view says This
server has no replication slots. when there are none.
Drop a slot nothing reads
Section titled “Drop a slot nothing reads”Click Drop slot… on the slot’s row.
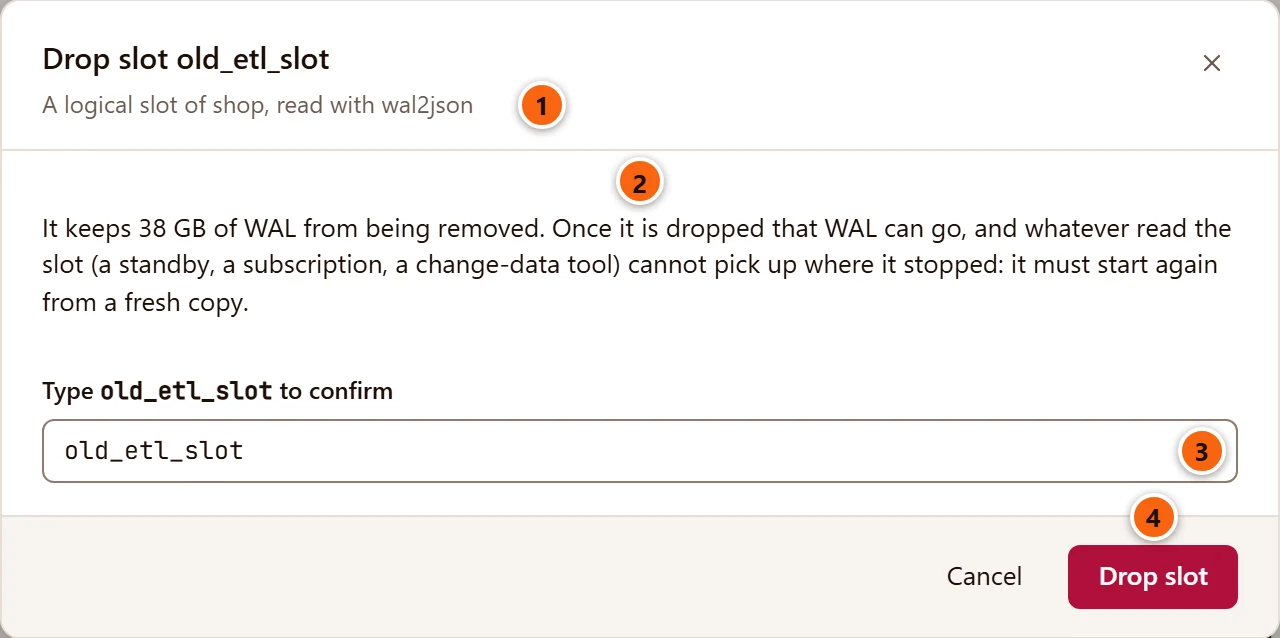
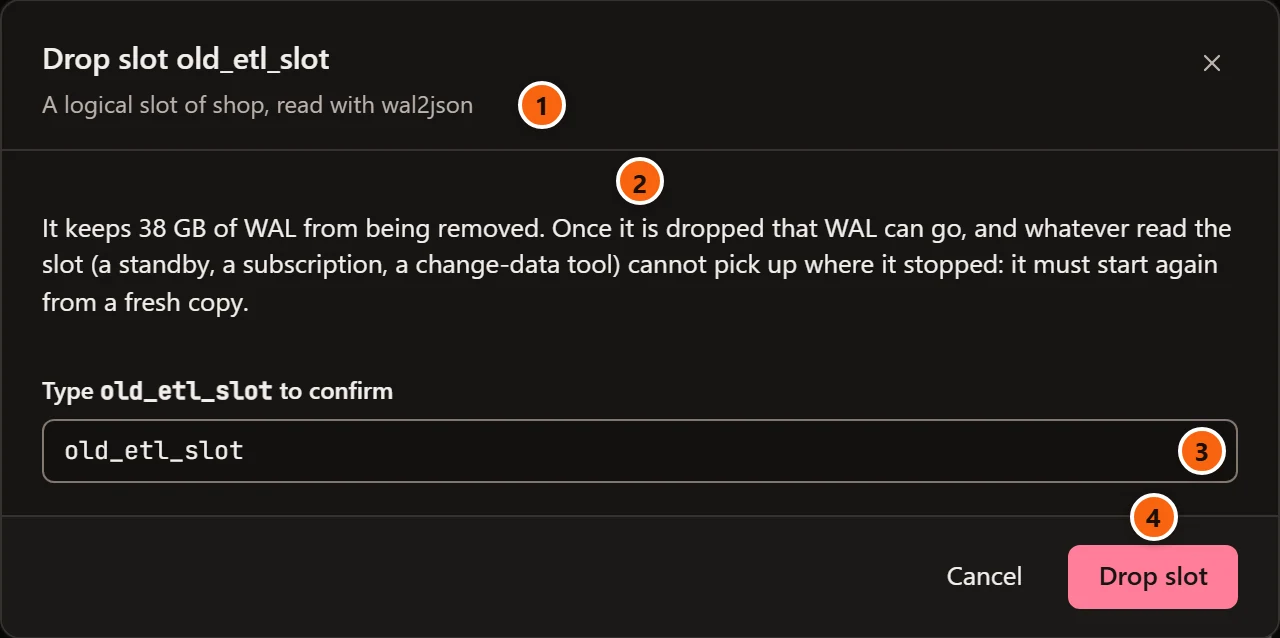
- 1 What kind of slot it is: logical, with its database and plugin, or physical.
- 2 What dropping it frees, and what it costs: whatever read the slot (a standby, a subscription, a change-data tool) cannot pick up where it stopped and must start again from a fresh copy.
- 3 On a server that asks first, type the slot’s name. Production servers always ask; Staging servers ask when Staging servers ask before destructive statements too is on in Settings. Other servers show no field.
- 4 Drop slot drops it. The button says Dropping… meanwhile.
pgjumbo runs pg_drop_replication_slot() once, on a connection of its own (to the slot’s database for a logical
slot), and only if nothing reads the slot at that moment. It refuses with a message in the dialog when:
| Message | Why |
|---|---|
| Something reads name now: stop whatever reads it first. | A reader came back since the list was read. |
| name was gone, or something reads it again: nothing was dropped. | The slot changed between the check and the drop. |
| There is no slot name any more. | Someone dropped it already. |
| pgjumbo opens this server read-only: turn Read-only off in the server’s connection first. | The server has Read-only sessions on (Connection settings). Choosing Production ticks it. |
PostgreSQL’s own errors, such as a role that may not drop slots, show in the dialog too.
On a standby
Section titled “On a standby”On a standby the view shows Receiving, from pg_stat_wal_receiver, in place of the settings, standbys and slots:
| Fact | What it says |
|---|---|
| From | The primary’s host and port, and the role it signs in as; an archive, not a primary while it restores from an archive. |
| State | The WAL receiver’s state, such as streaming, or restoring. |
| Slot | The slot it reads on the primary, or none. |
| Received up to | The last WAL position received. |
| Replayed up to | The last position replayed. |
| Behind | Time since the last transaction it replayed, and the WAL received but not replayed yet. With no time to give and no WAL waiting, it says caught up. In amber past 30 seconds. While the primary is idle the time grows although nothing is missing. |
| Last message from the primary | How long ago it last heard from the primary. |
| Replay | running or paused (in amber). |
| Timeline | The timeline it follows. |
PostgreSQL hides the password in the primary’s connection string, and pgjumbo does not read it. When the standby reports nothing about its source, the view says This standby reports nothing about where it reads from. and offers no replay button.
Pause replay stops applying WAL while the standby keeps receiving it, for a long report or to look at the data as
it is; Resume replay starts again. pgjumbo runs pg_wal_replay_pause() or pg_wal_replay_resume() once, on a
connection of its own, and greys the button out until it answers. That needs a superuser, or a role granted EXECUTE
on those functions; a refusal shows in red under the button. A server with Read-only sessions on is refused, as
above.
On Amazon Aurora
Section titled “On Amazon Aurora”On an Aurora cluster the view adds Aurora instances, from aurora_replica_status(): each Instance, its
Role (writer or reader) and a reader’s Lag. When those cannot be read, the note at the bottom says that
Aurora’s readers share the cluster’s storage and are not streaming standbys, and that their lag is in the RDS console.
See Amazon RDS and Aurora.
Logs reads the server’s log files where the server writes them, through PostgreSQL’s own functions
(pg_ls_logdir() and pg_read_binary_file()), so it needs no access to the server’s machine.
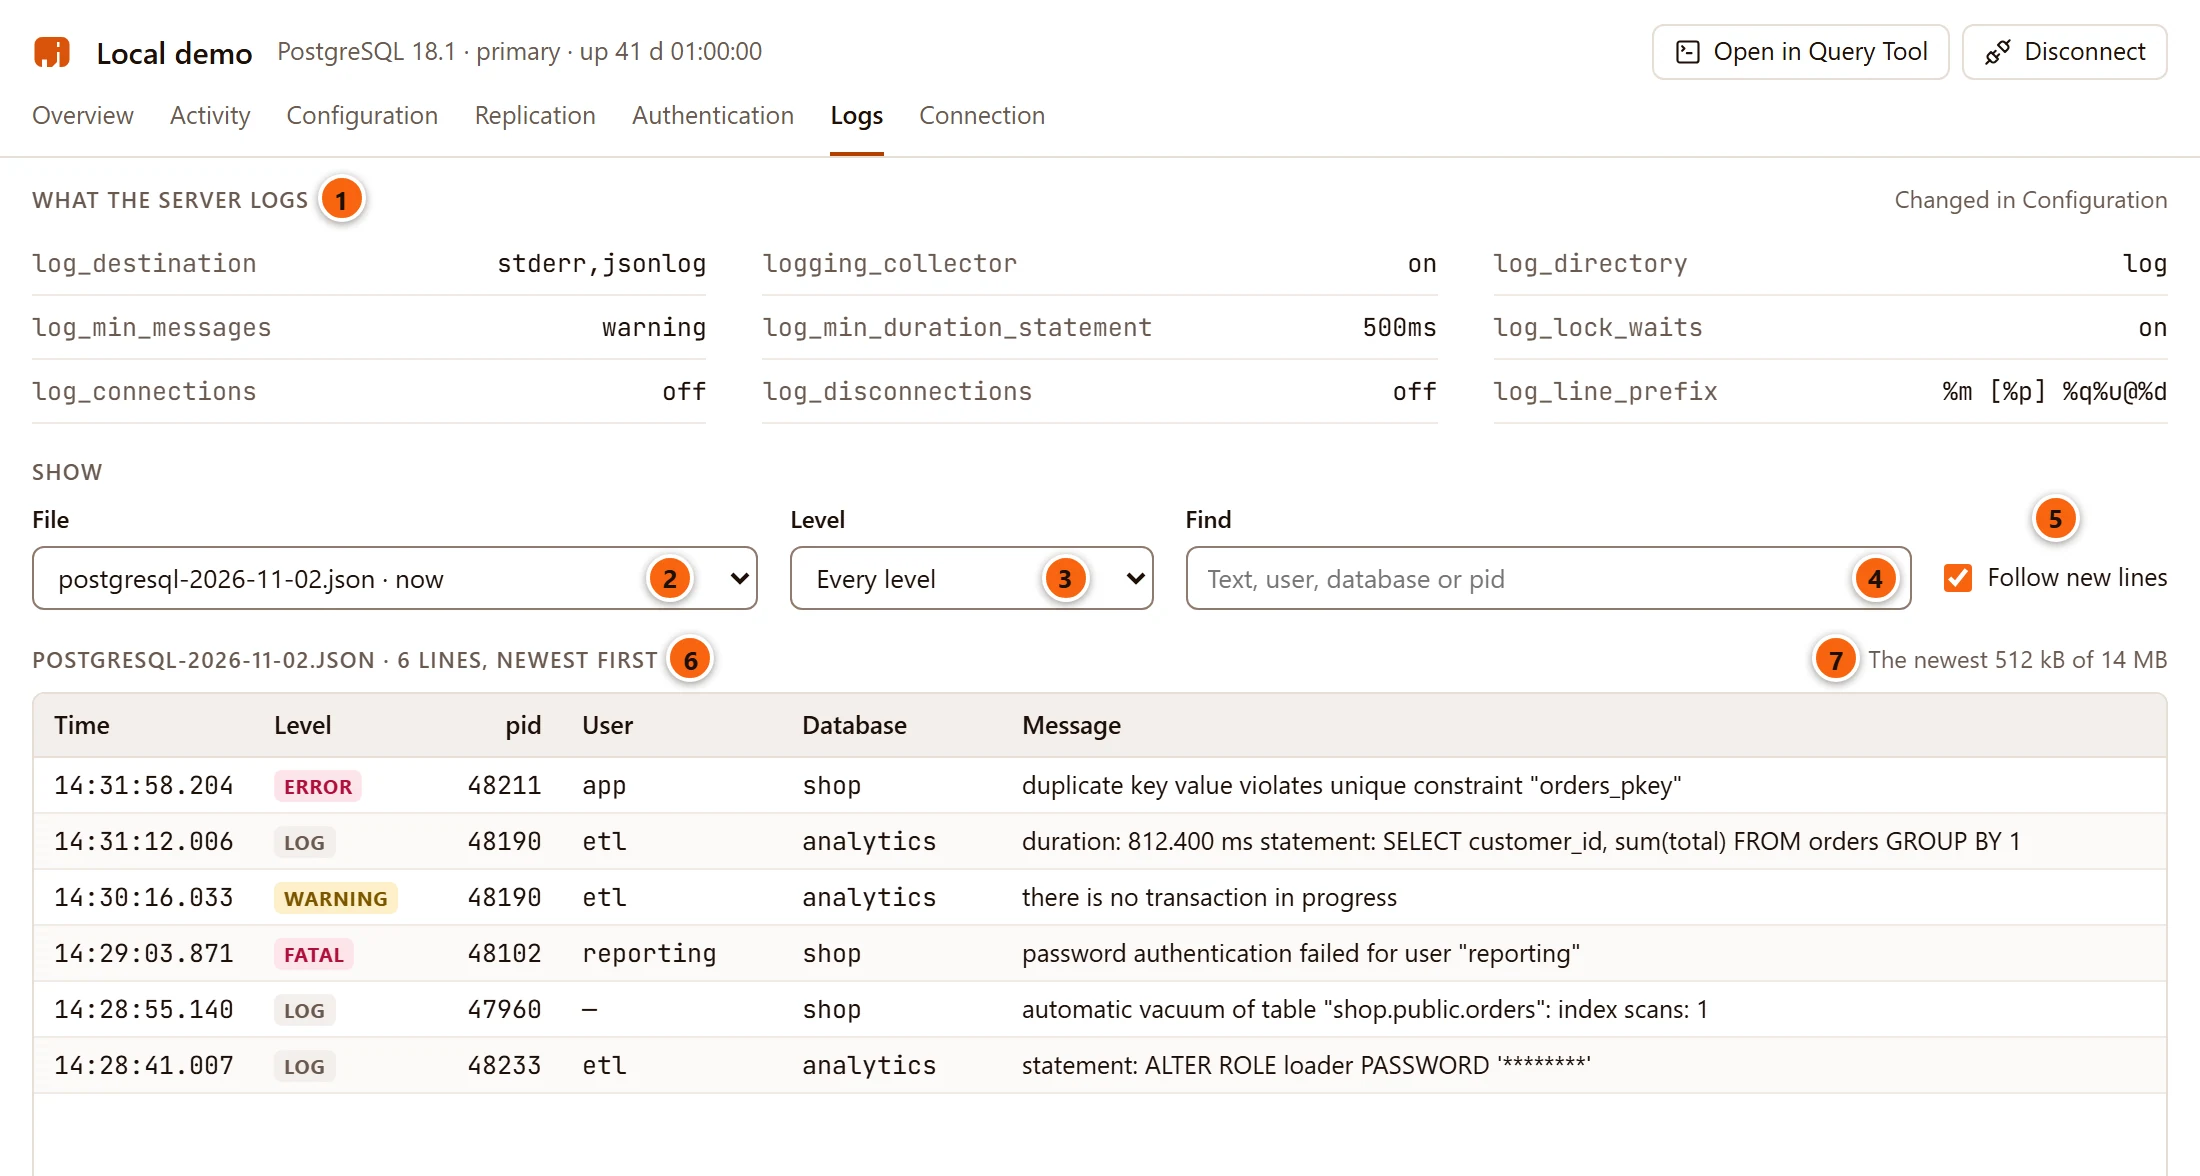
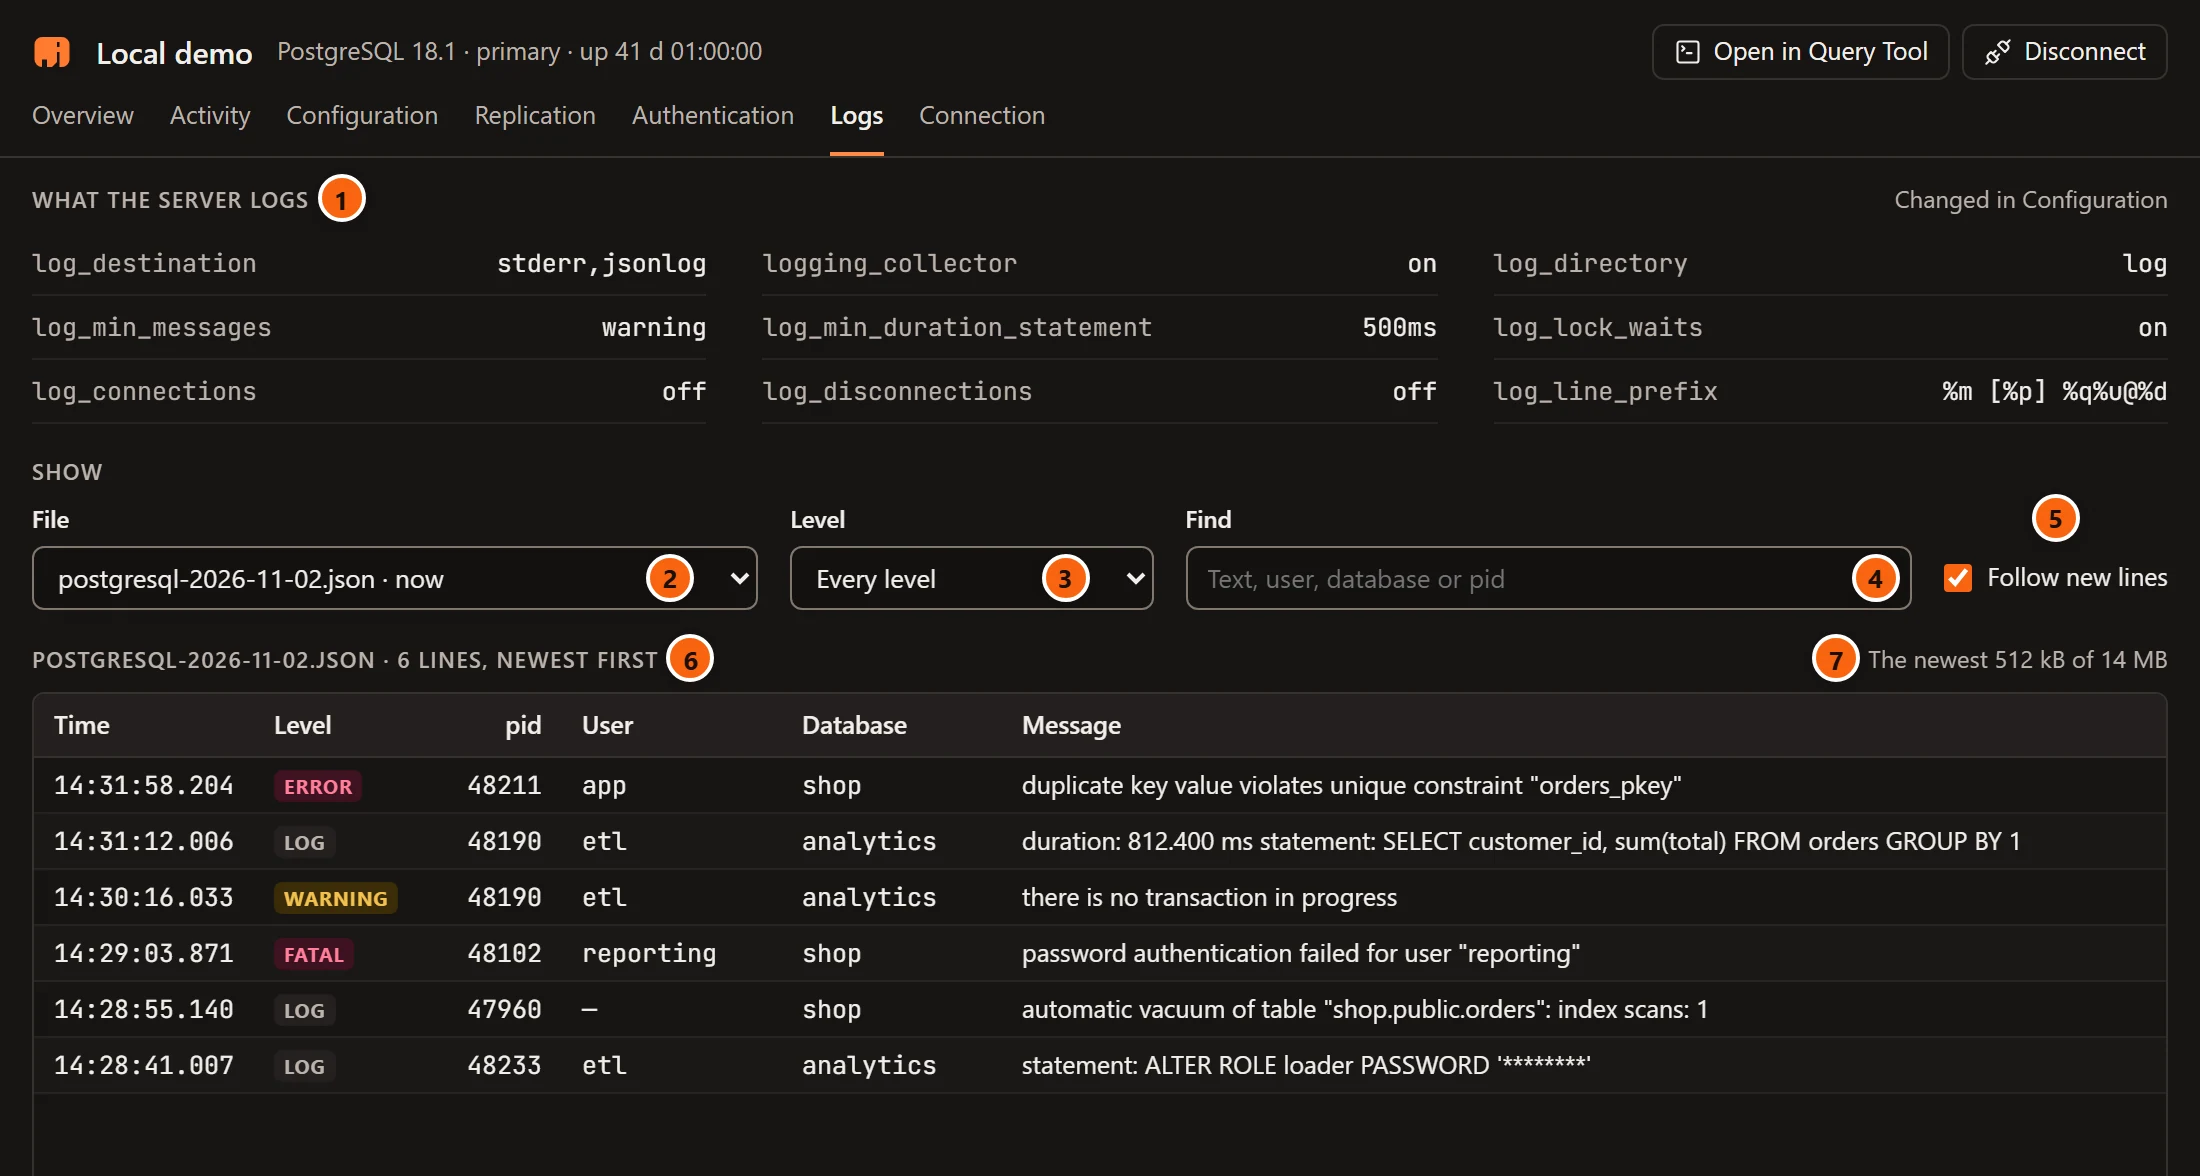
- 1 What the server logs: the settings that decide what goes into the log, each with its unit:
log_destination,logging_collector,log_directory,log_min_messages,log_min_duration_statement,log_lock_waits,log_connections,log_disconnectionsandlog_line_prefix. Change them in Configuration. - 2 File: the log file to read. The file the server writes now is marked · now. pgjumbo starts on
that file in the richest format the server writes (
jsonlog, thencsvlog, then plain text), else on the newest file. - 3 Level: Every level, Warnings and worse (
WARNING,ERROR,FATAL,PANIC) or Errors and worse (ERROR,FATAL,PANIC). A line whose level pgjumbo cannot tell counts asLOG. - 4 Find (Text, user, database or pid) keeps the lines whose message, statement, user, database or pid holds the text, whatever its case.
- 5 Follow new lines (on at first) reads the file again every 5 seconds while the view is shown, when the file chosen is the one the server writes now.
- 6 The file’s name and how many lines were read, newest first.
- 7 On a large file pgjumbo reads only its end, and says so: The newest 512 kB of 14 MB. It keeps at most 2,000 lines.
The lines table has Time (the clock time; point at it for the full timestamp), Level (a red tag for ERROR,
FATAL and PANIC, amber for WARNING), pid, User, Database and Message (its first line; point at
it for the whole message). It says Nothing in this file yet. for an empty file and No line matches. when the
filters leave nothing. Choosing another file in File starts it with no line selected.
jsonlog and csvlog files are read field by field. A plain stderr file is split where each entry’s level starts
(LOG:, ERROR: and the others), and the DETAIL, HINT, CONTEXT and STATEMENT lines that follow join the
entry before them. From the prefix that log_line_prefix writes, pgjumbo picks out a time at the start, a pid in
brackets and user@database, when it finds them. Passwords in logged statements are masked, as in the query history.
Read one line in full
Section titled “Read one line in full”Click a line. The selected line opens under the table:
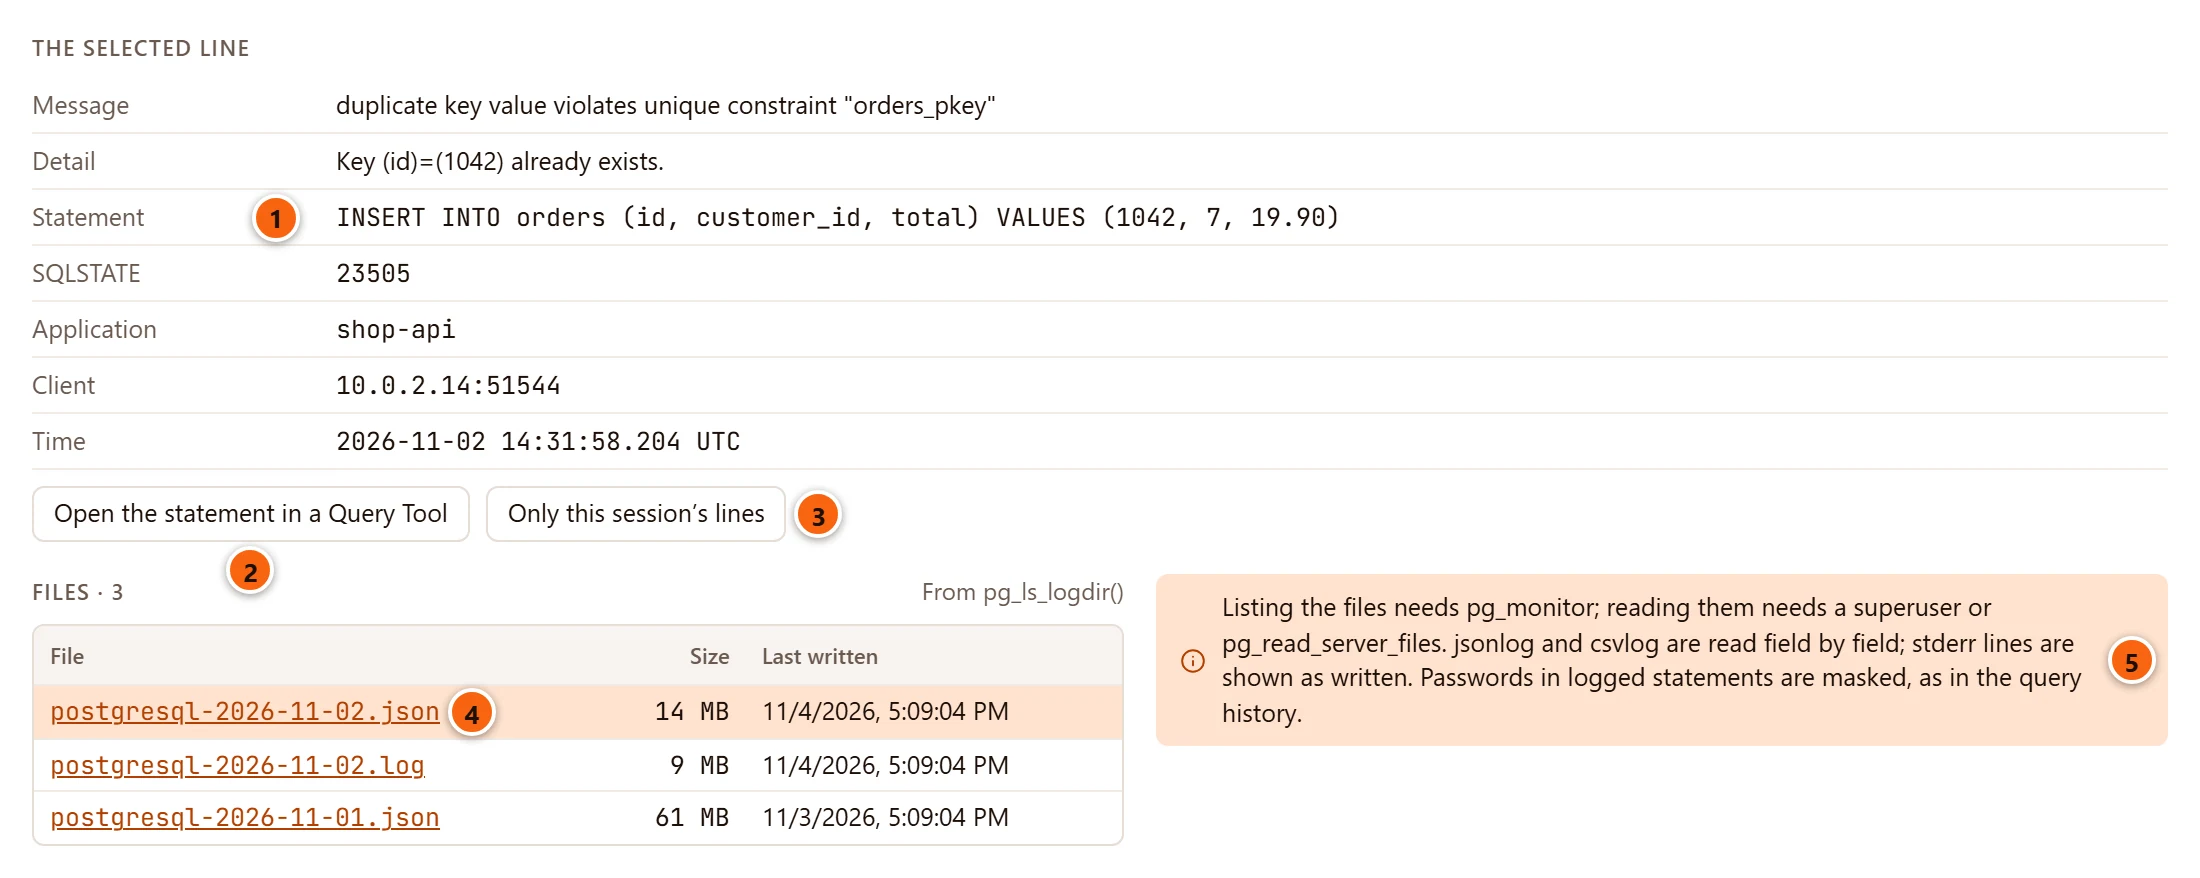
- 1 Every field the line has: Message, Detail, Hint, Context, Statement, SQLSTATE,
Application, Client and Time. Fields the line lacks are left out;
stderrlines carry fewer. - 2 Open the statement in a Query Tool opens a new Query Tool on the line’s database (or the maintenance database) with the statement in it. Nothing runs. It shows only on a line that logged a statement.
- 3 Only this session’s lines keeps the lines of the line’s pid. It shows only on a line with a pid.
- 4 Files: the server’s log files from
pg_ls_logdir(), newest first, with their Size and when each was Last written. The file being read is highlighted; click another name to read that one. Twelve are listed; and N more, older counts the rest. - 5 Which roles may do what, and the formats pgjumbo reads.
With one session’s lines kept, the heading says so and the button reads Every session’s lines:
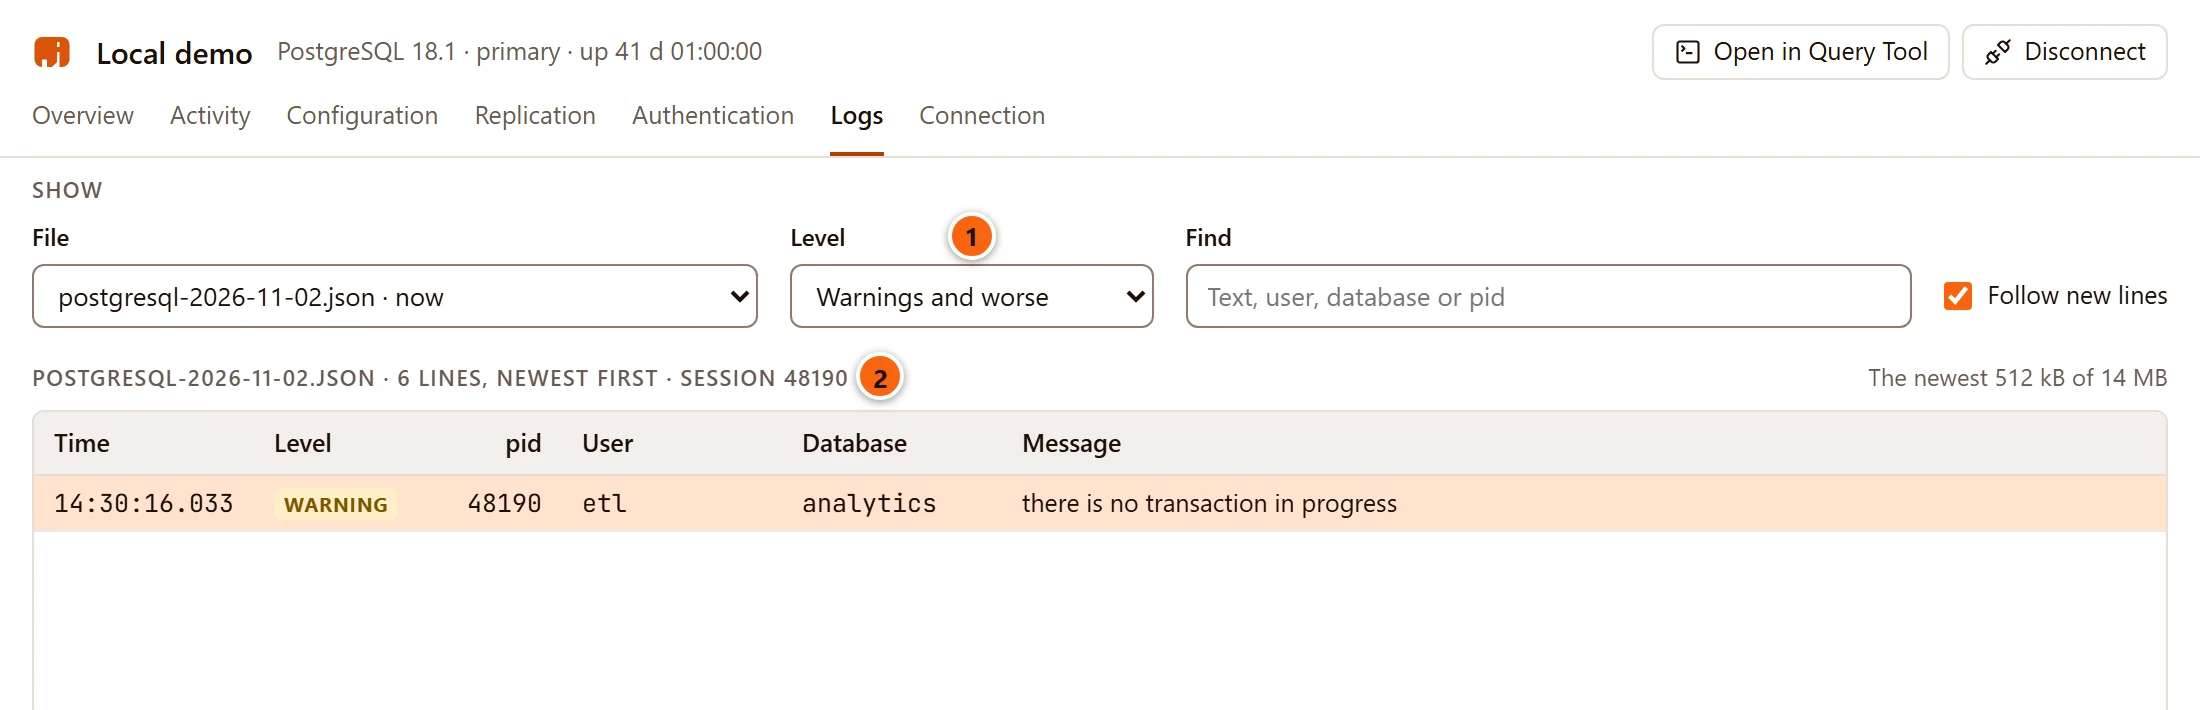
- 1 The level filter still applies.
- 2 · session 48190 in the heading: only that pid’s lines show. Click Every session’s lines to see all of them again.
When the log cannot be read
Section titled “When the log cannot be read”The settings always show. In place of the file controls, the view says why the files cannot be read:
| Message | What to do |
|---|---|
| The server writes its log to its standard error, not to files: logging_collector is off. Turn it on in Configuration (it takes a restart) for the log to be read here. | Set logging_collector to on in Configuration and restart the server. |
| Listing the log files needs a superuser, or a member of pg_monitor. | Connect as such a role, or have one grant you pg_monitor. |
| Reading the log files needs a superuser, or a member of pg_read_server_files. | Shown where the lines would be, when the files can be listed but not read. |
| On Amazon RDS, PostgreSQL cannot read its own log files: they are in the RDS console, under Logs & events. | On RDS (or Aurora, which the message names), read the log in the AWS console. |
| The server lists no log file name. | The file was removed (log rotation) since the list was read. Pick another one. |
Connection
Section titled “Connection”Connection is the connection dialog’s form inside the tab: pgjumbo’s own settings for reaching the server. It works whether or not the server is connected.
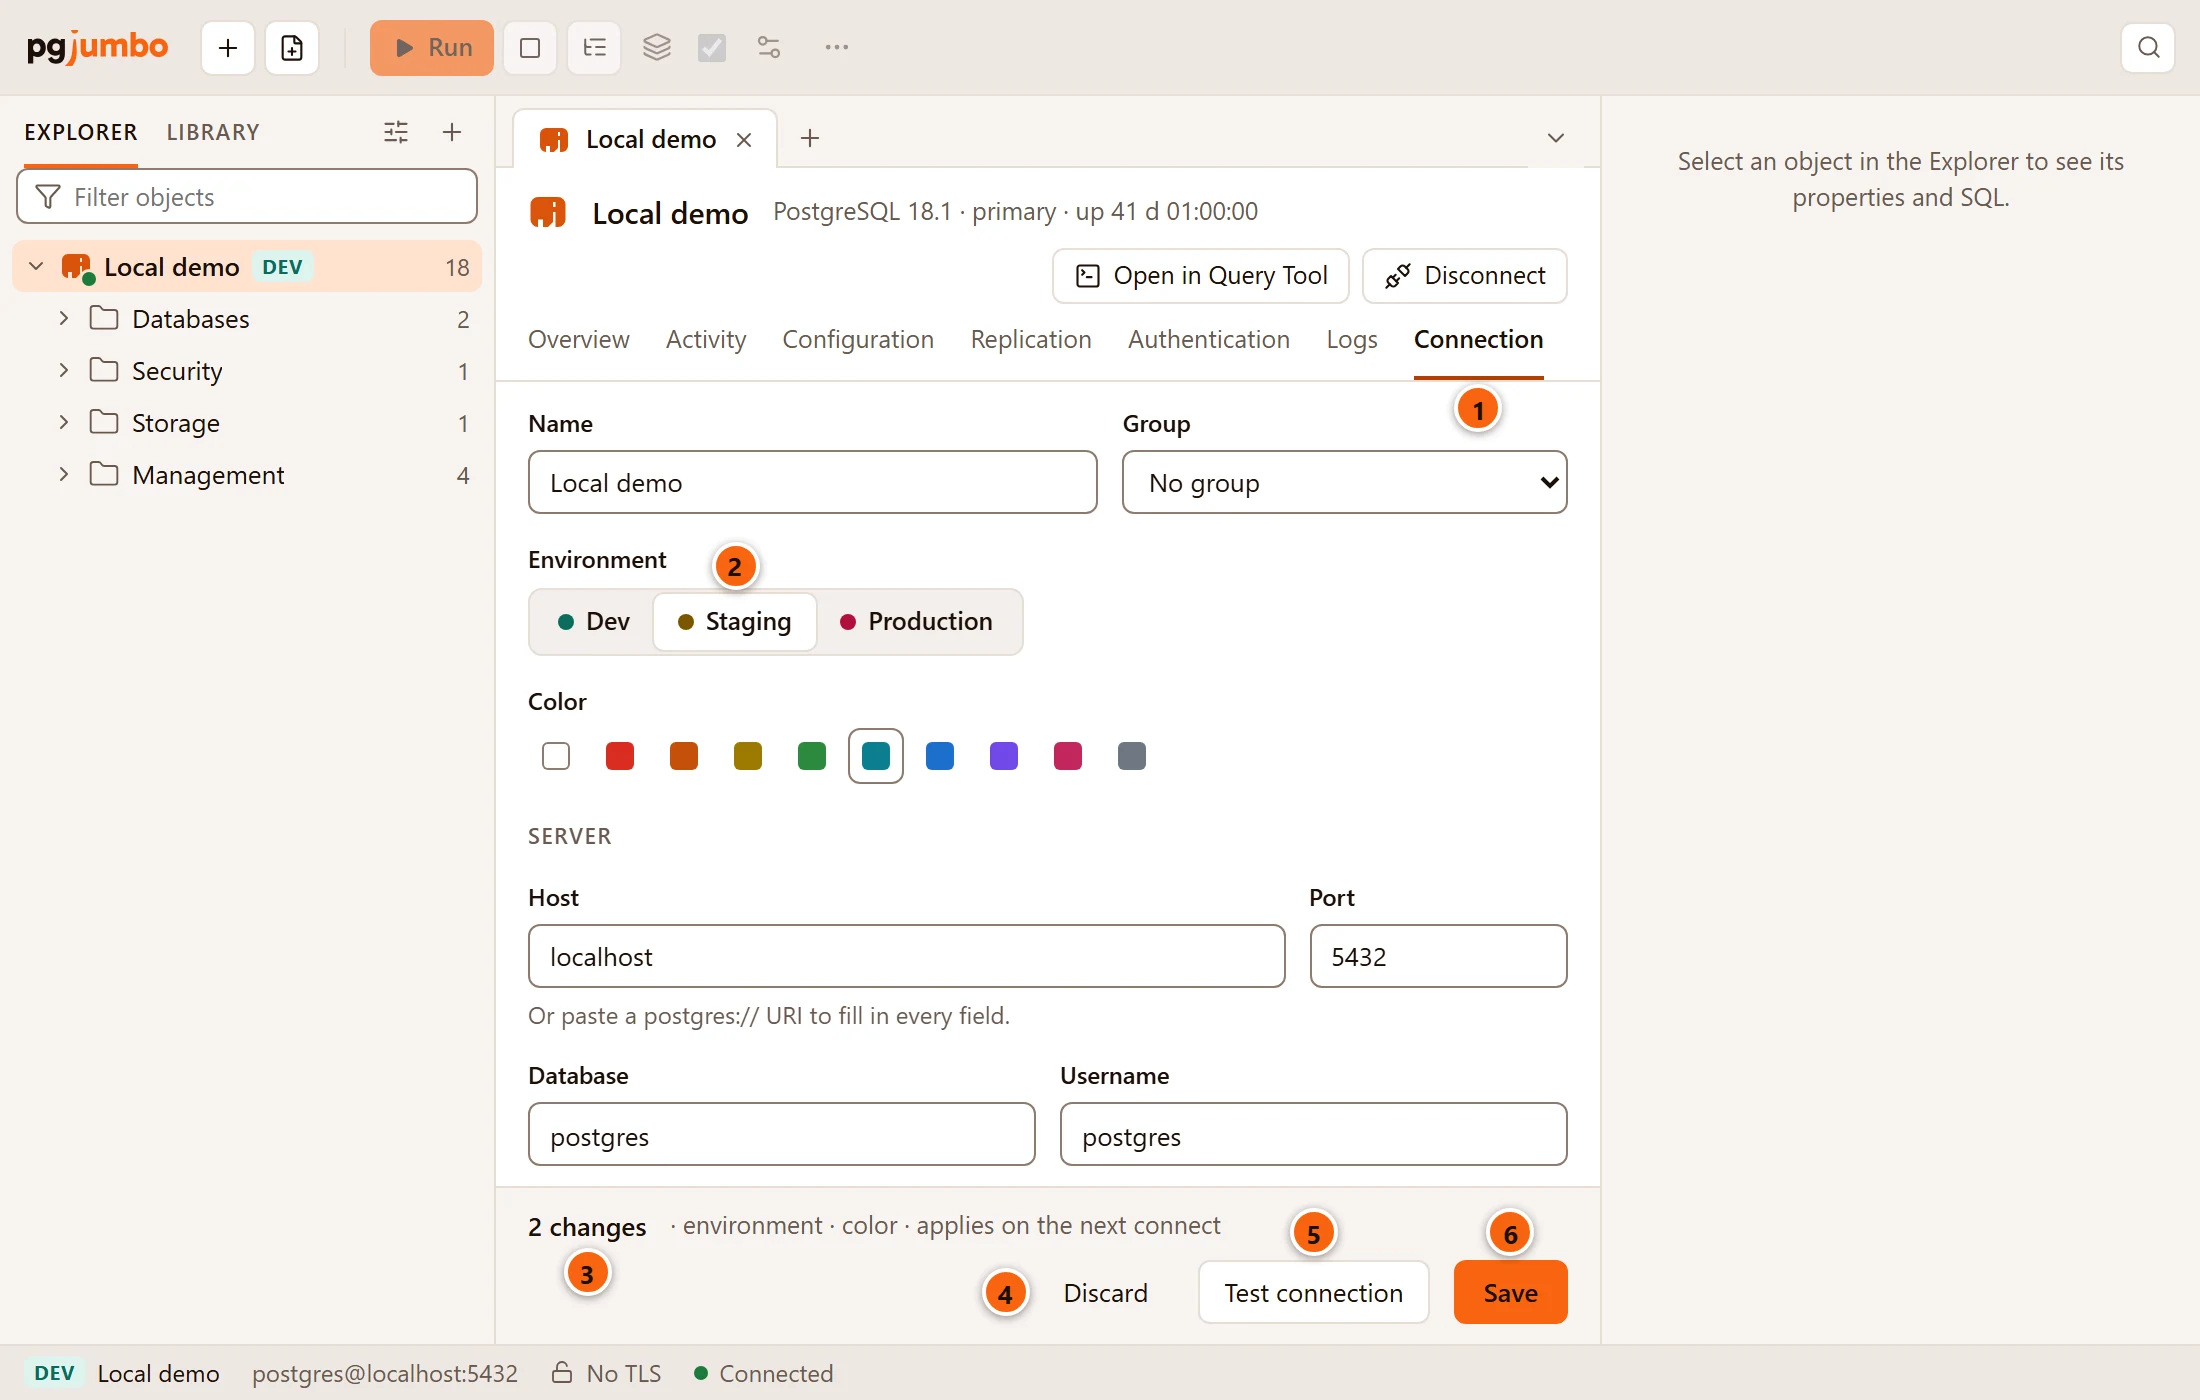
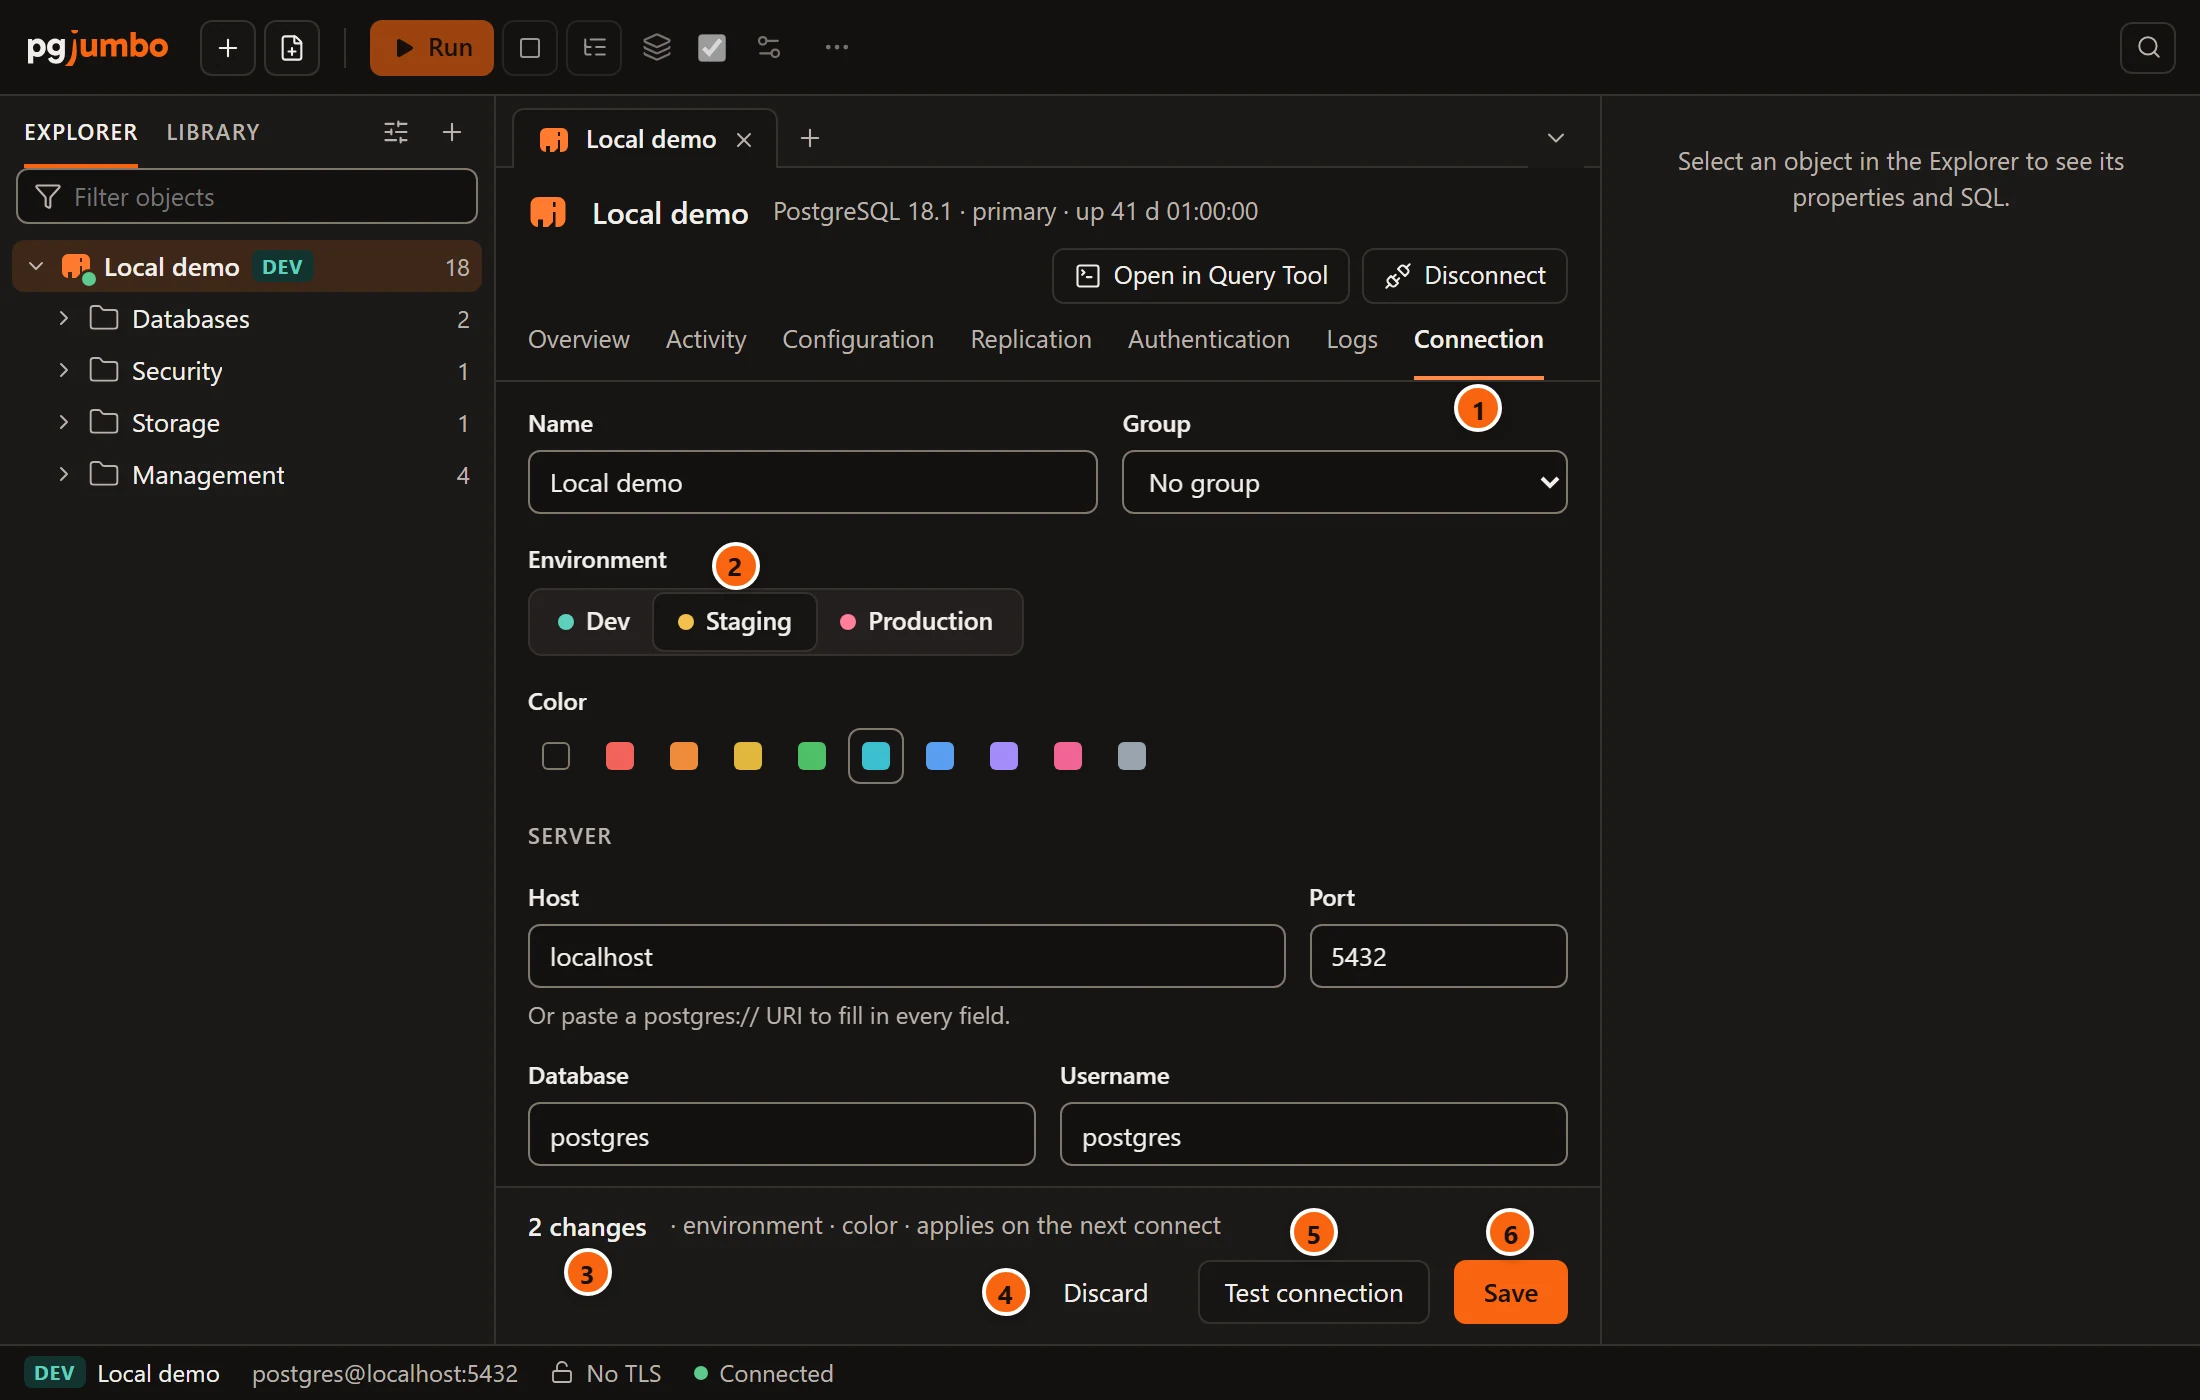
- 1 The Connection view.
- 2 Change any field as in the dialog.
- 3 Once something differs from the saved server, a bar counts the changes and names them, with applies on the next connect.
- 4 Discard starts the form again from the server as saved.
- 5 Test connection tries the settings as they are in the form.
- 6 Save keeps them on this computer. It runs nothing on the server.
Every field is explained on Connection settings, and editing a connected server under Change a saved server.
Ask the Assistant about a view
Section titled “Ask the Assistant about a view”While the Assistant is on and the server is connected, Ask the Assistant in the header opens the Assistant pane and sends a question about the view in front, with the tab as its context:
| View | The question sent |
|---|---|
| Overview | “Give me an overview of this server’s health: what stands out, and what should I look at first?” |
| Configuration | “Suggest settings for this server. Ask me first about its machine (memory, CPUs, disks) and its workload, then propose them for Configuration.” |
| Replication | “Explain this server’s replication: its replicas and slots, their lag, and anything at risk.” |
| Authentication | “Explain these pg_hba rules: who can connect to what, from where and how, and anything risky.” |
| Logs | “Explain the recent errors and failed connections in the log, and what to do about them.” |
Activity asks from its own toolbar (Activity); Connection has no question. The pane, its answers and what the Assistant may read are on Ask the Assistant.