
The Query Tool
The Query Tool is a tab with a SQL editor above and its results below. Each tab is connected to one database through
a connection of its own, so a long query in one tab never holds up another, and a transaction or a SET in one tab
never reaches the others. A Query Tool tab can also move to a window of its own, with its session as it was; see
Move a tab to its own window.
A first look
Section titled “A first look”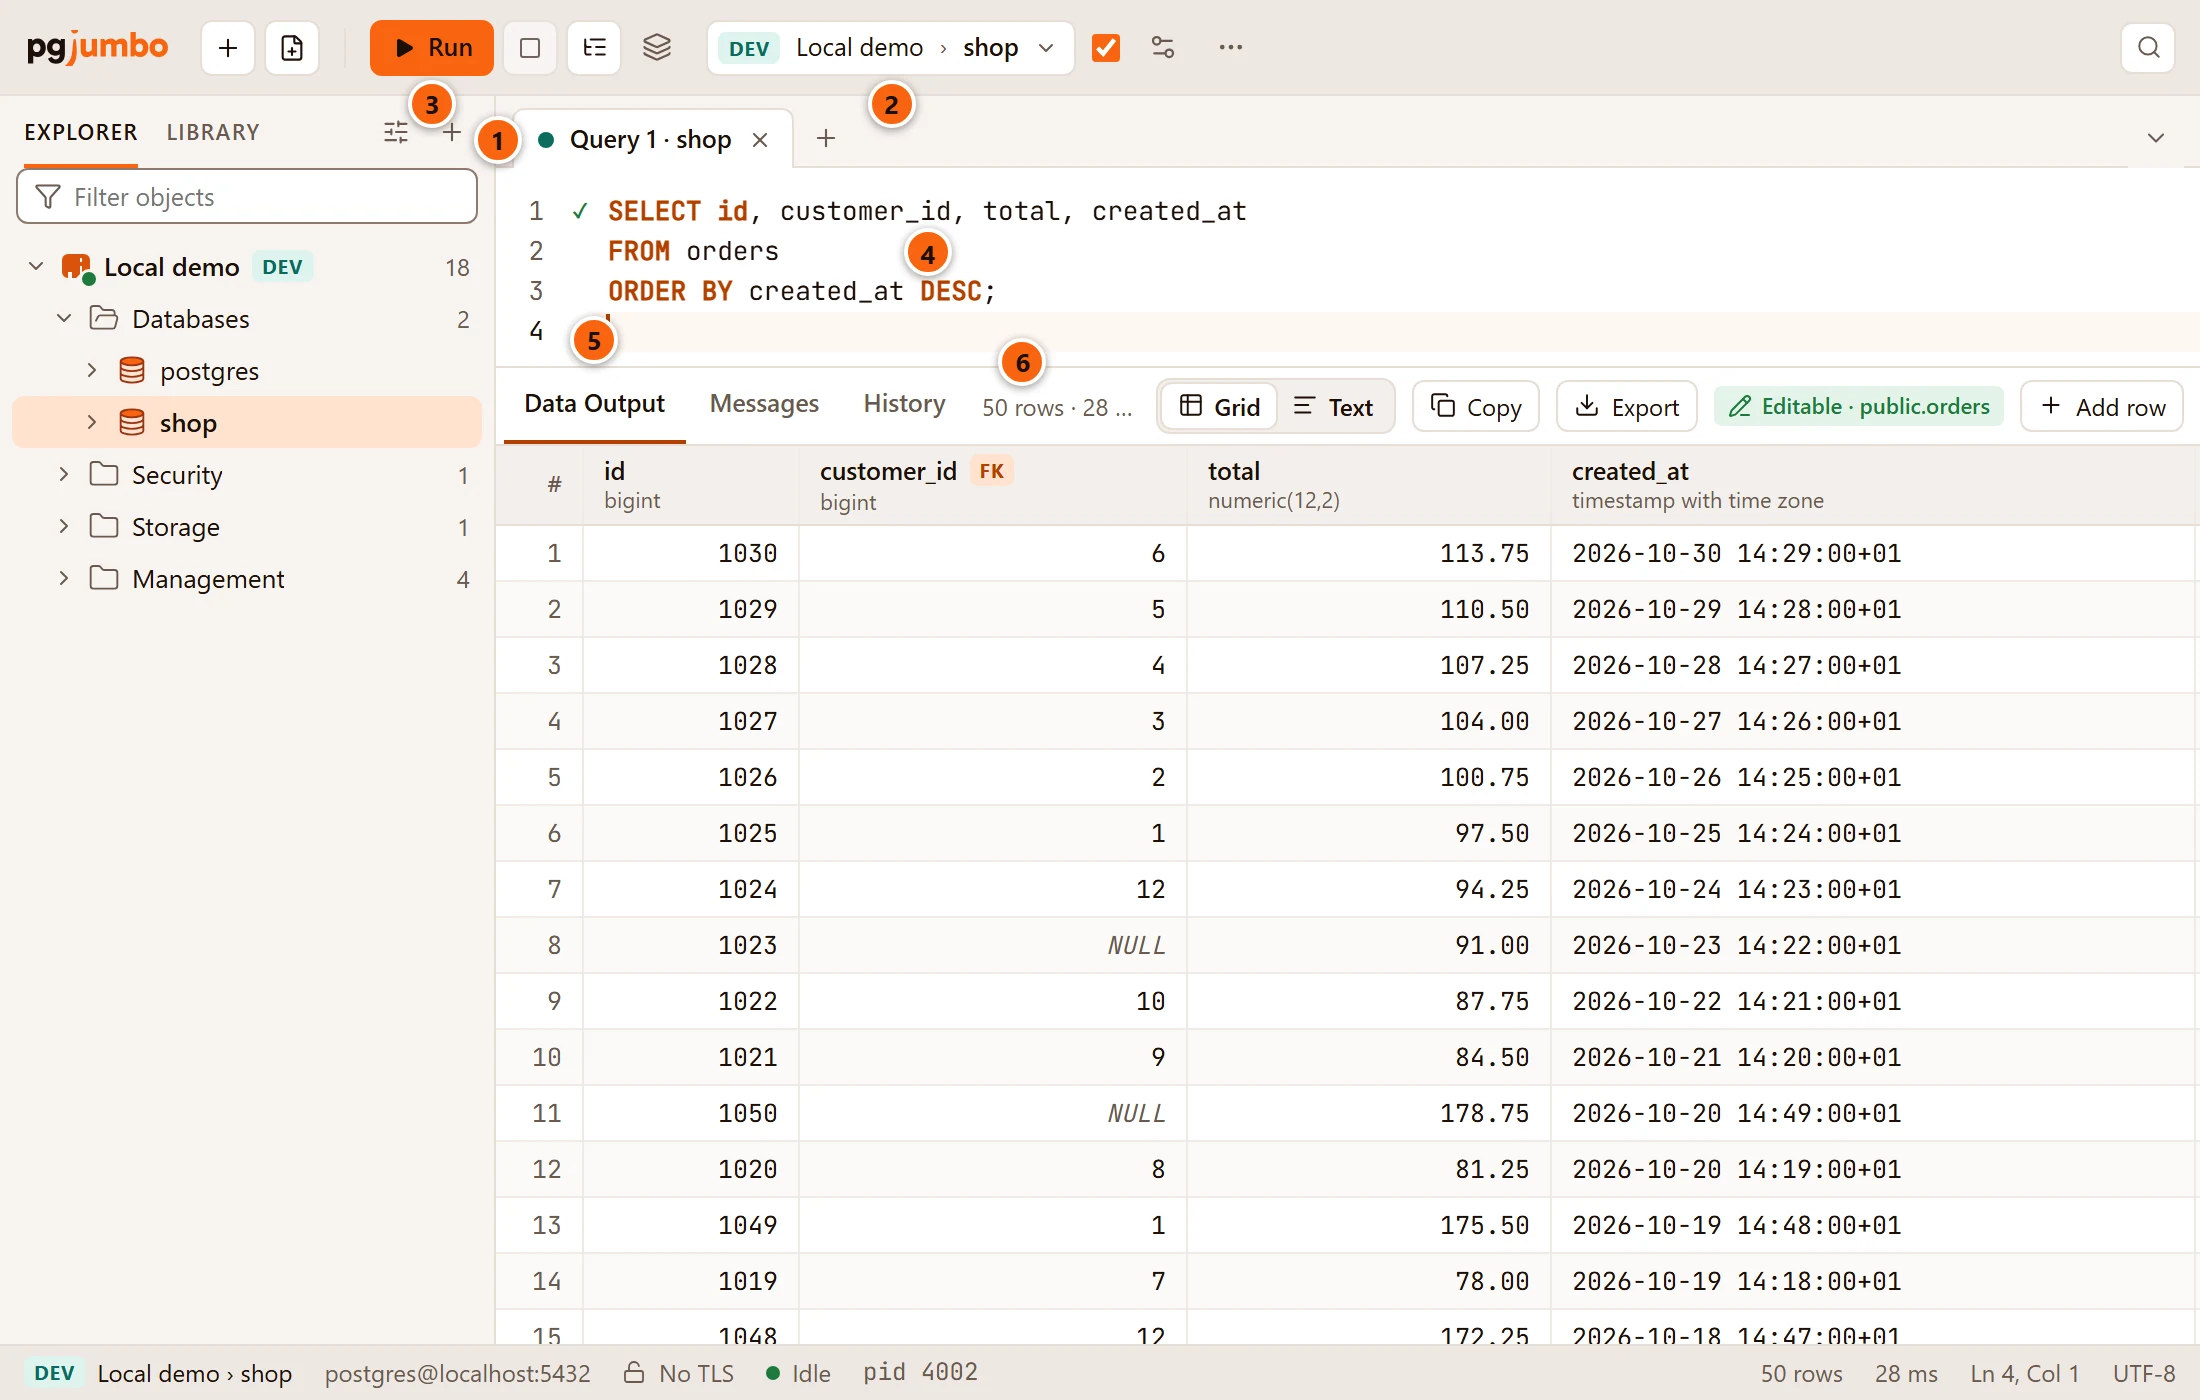
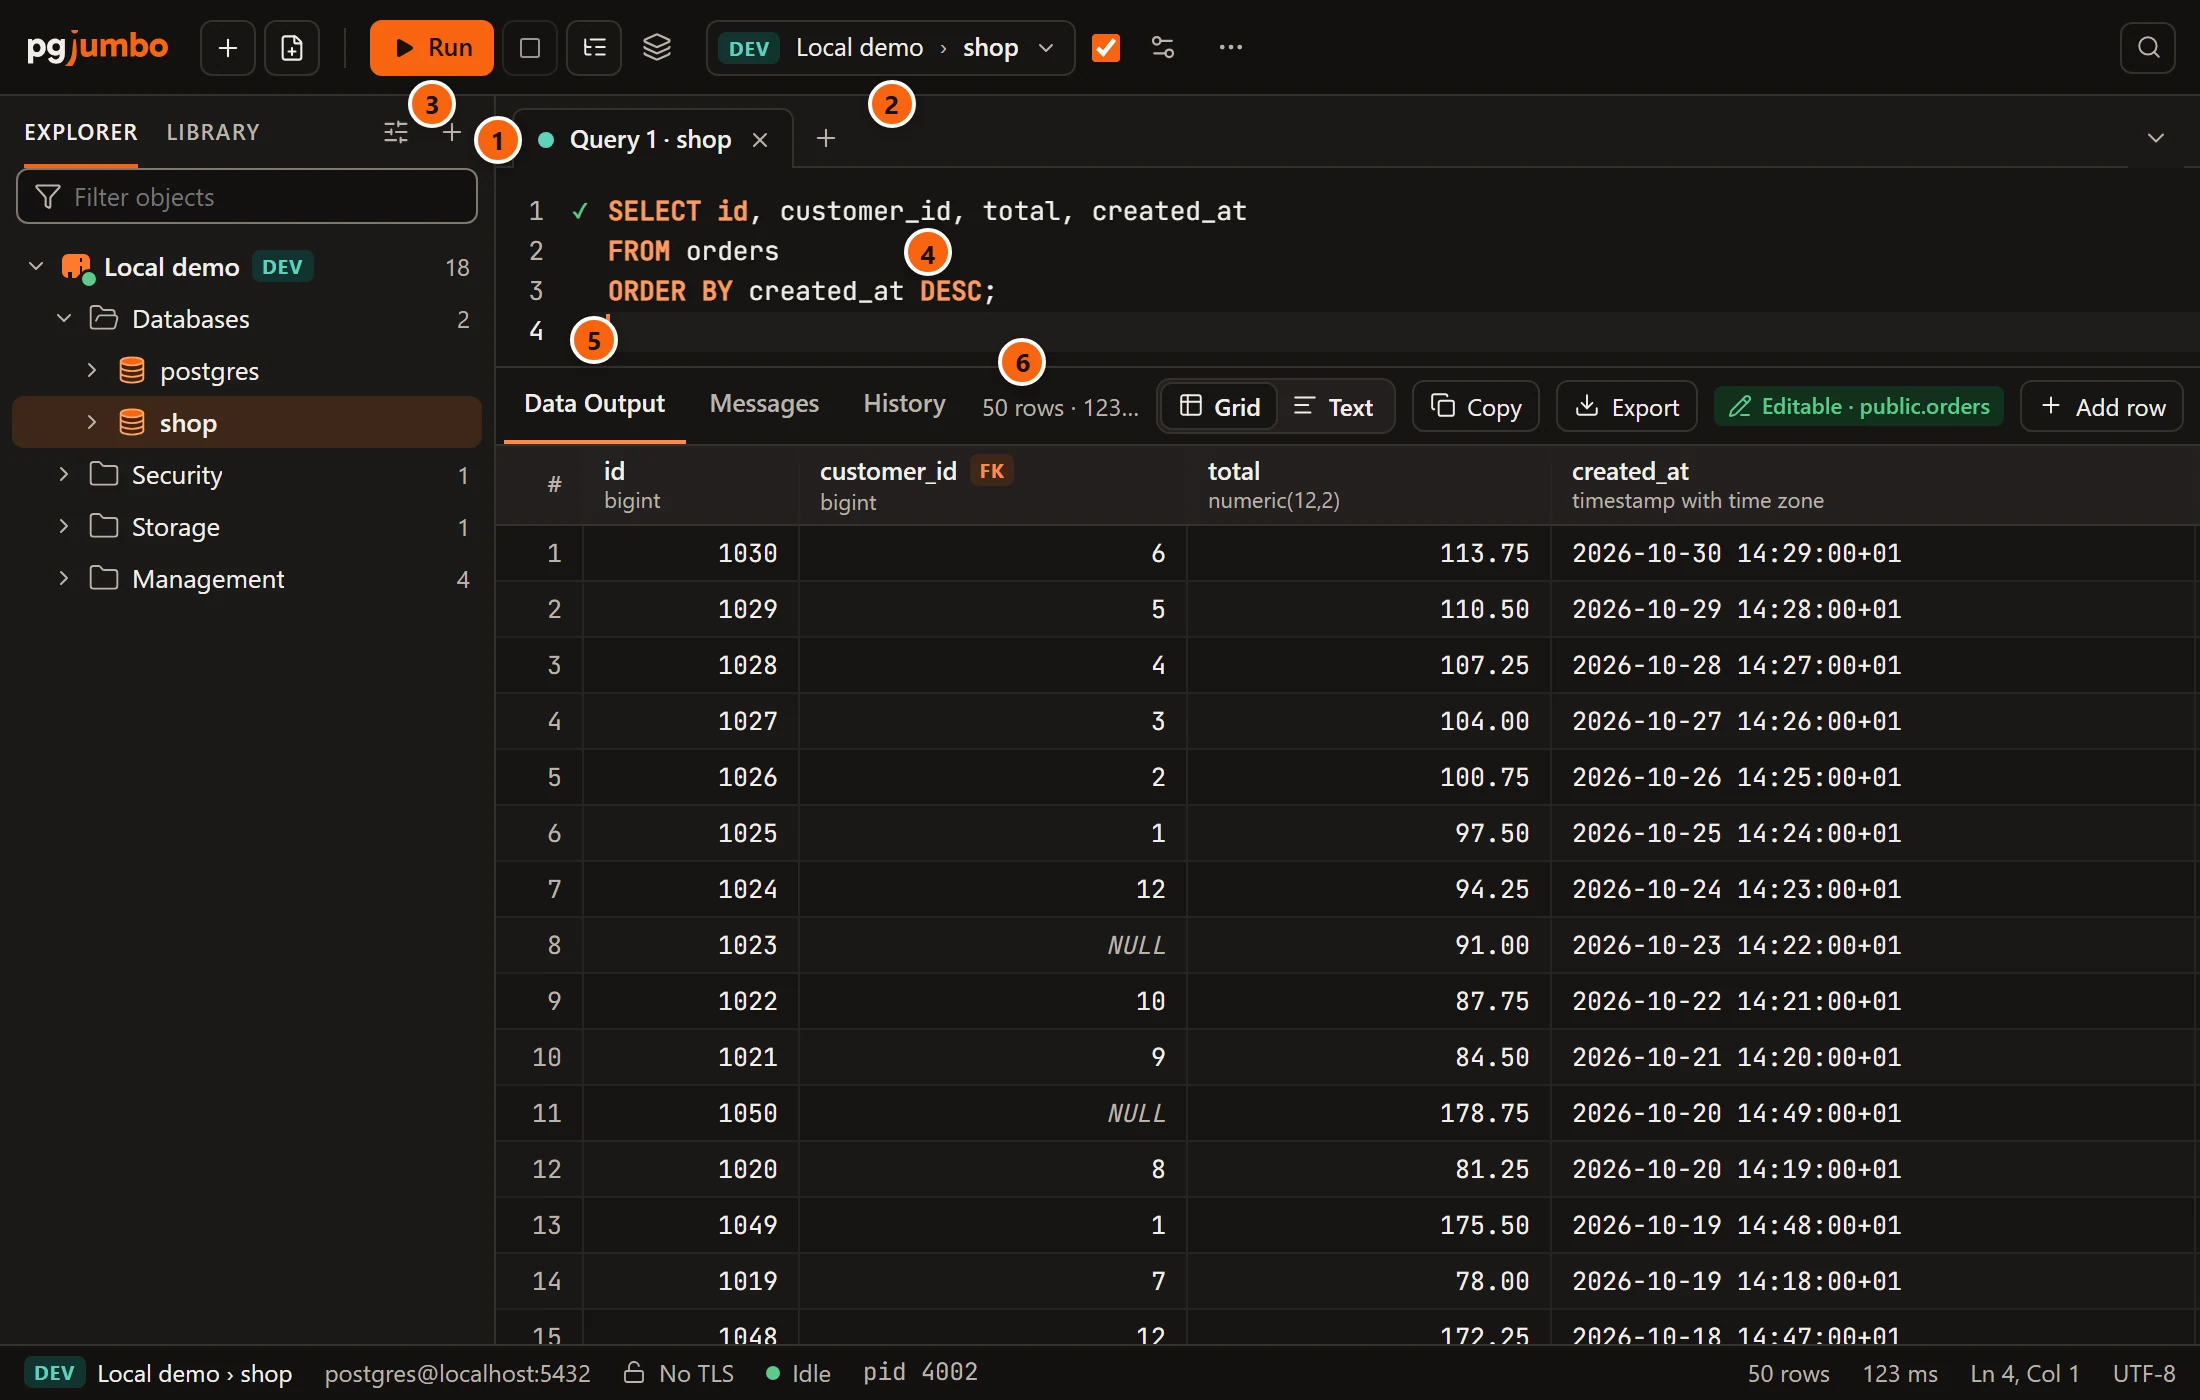
- 1 The tab’s name:
Query 1 · shopis query tab number 1, connected to the databaseshop. A new tab takes the lowest number no open query tab uses. A tab opened from a file shows the file’s name instead ofQuery 1, and a • after it while the text differs from the file (see Files, drafts and history). Hover the tab to see the database and server, the file’s path and the tab’s session (Session pid 4002 · Idle). The dot has the server’s environment colour, and a Production server’s tabs also carry a PROD tag. - 2 The tab’s connection: the environment tag, the server and the database. Click it to switch the tab to another database.
- 3 Run runs the selection, or the whole tab when nothing is selected.
- 4 The editor. Writing SQL explains suggestions, Quick Info, formatting and every key.
- 5 The result tabs: a Data Output tab for each result, then Messages and History. Results explains them.
- 6 How many rows the result in front holds and how long the run took. When statements failed, it also says
how many (
1 error). When the bar is short of room this note is cut off, as here; the status bar repeats the rows and the time.
The buttons at the right of the result bar (Grid, Text, Copy, Export, the Editable tag and Add row) are explained in Results and Edit data.
Before the first run, the result area says
No result set. Ctrl+Enter runs the selection, or the whole tab; Shift+Enter in the editor runs the statement at the cursor.
(with ⌘↩ on macOS).
Drag the bar between the editor and the results to give one of them more room. You can also press Tab until the bar has the focus and use ↑ and ↓; Home and End make the editor as small or as large as it goes. The results always keep room for their tab bar and a few rows. pgjumbo uses the same height for every query tab and keeps it for the next time you start it.
Open a Query Tool
Section titled “Open a Query Tool”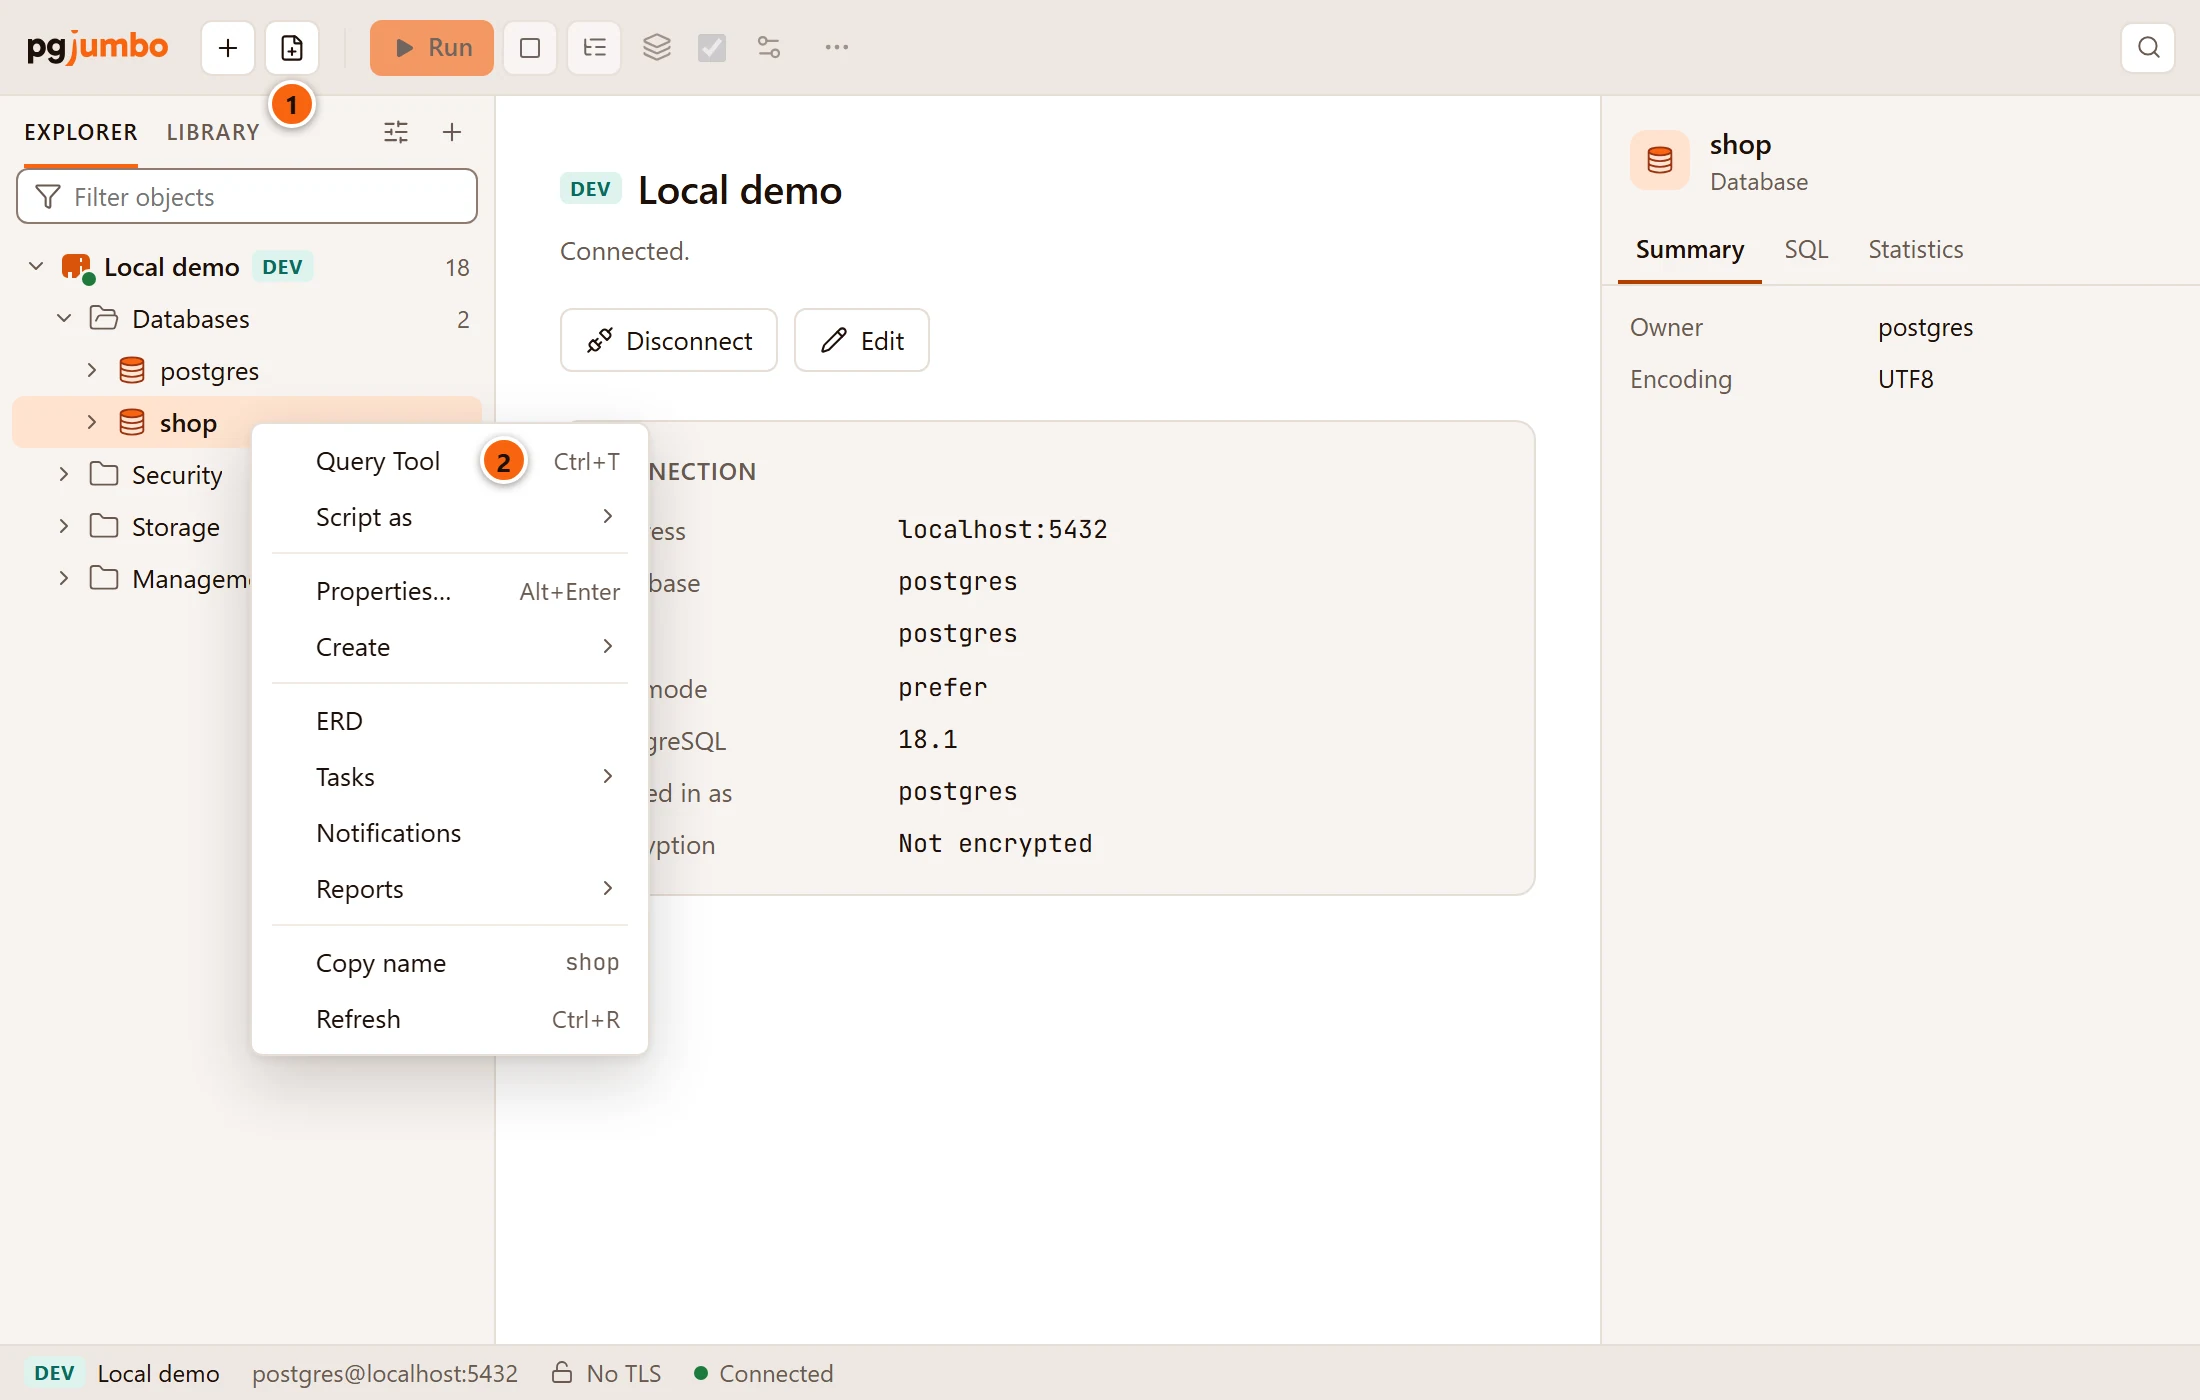
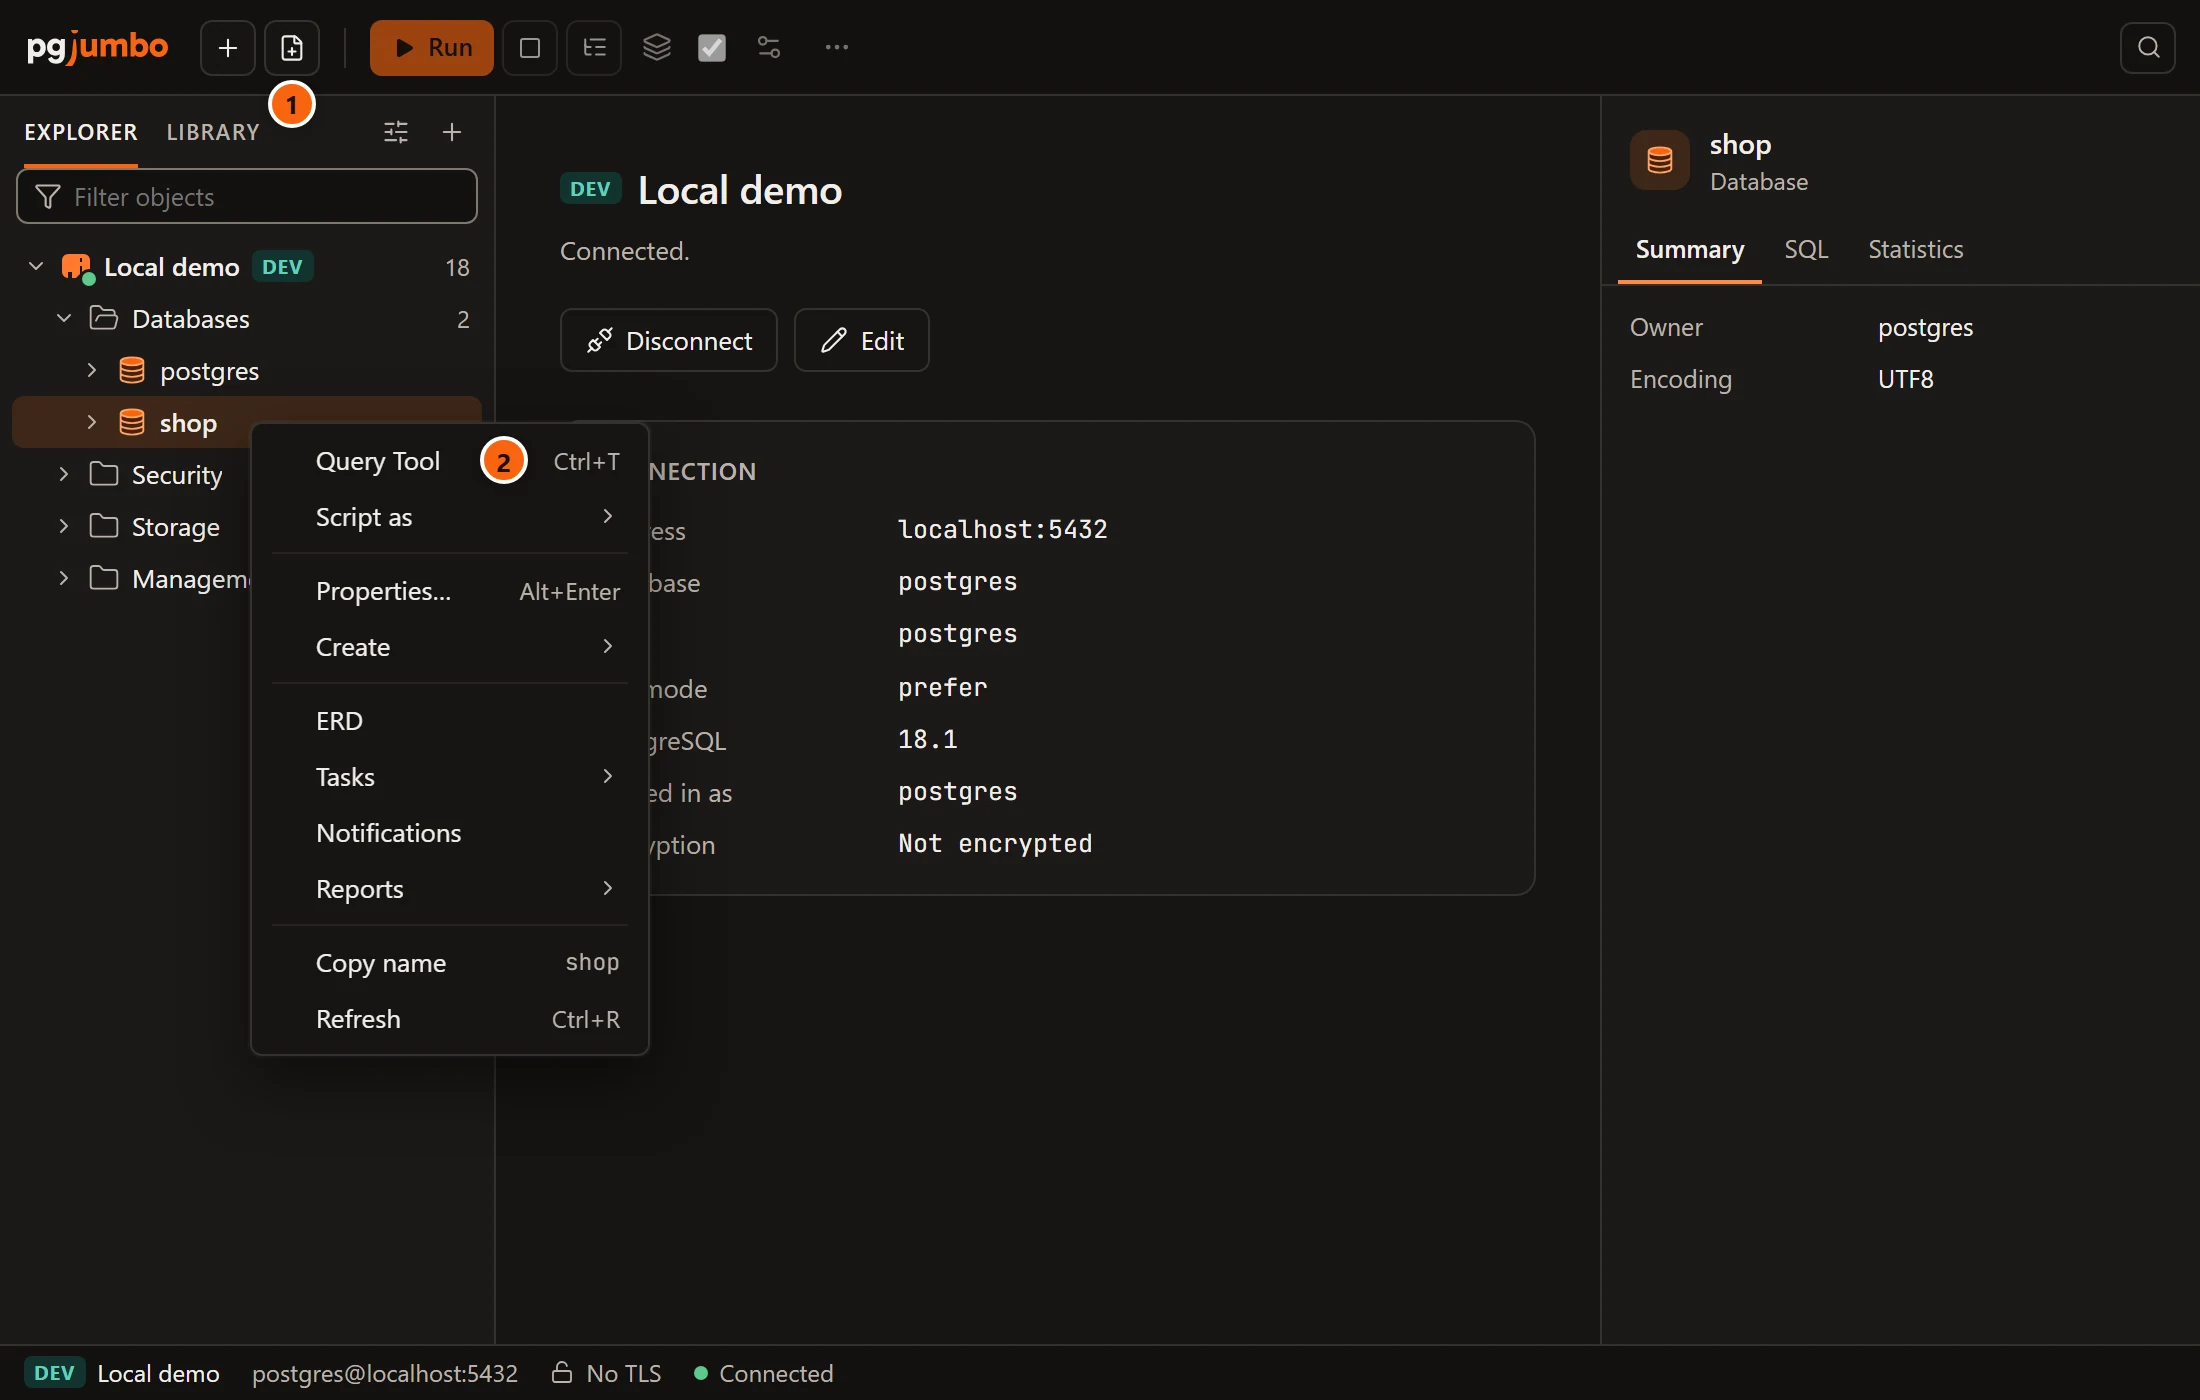
- 1 New query in the main toolbar (a page with a plus; the label shows only in a wide window). It opens an empty tab. It is greyed while no query tab is in front and no connected server is selected in the Explorer.
- 2 Query Tool on a right-click menu in the Explorer, with its keys. It is the first item on every row inside a connected server, except the tools under Management (their menu has only Open). On a server’s own row it comes second, after Disconnect, and only while the server is connected.
The other ways to open one:
| Where | What opens |
|---|---|
| FileNew Query Tool, ⌘ T (Ctrl+T on Windows and Linux) | An empty tab, on the database New query would pick (see below). |
| The + at the end of the tab strip (New query tab) | The same as New query. |
| Open in Query Tool on the Inspector’s SQL tab | A tab with the object’s CREATE script, on the object’s database. See The Inspector. |
| Open in Query Tool in the header of an object’s tab, or on its SQL view | The same, from the object’s tab. |
| Open in Query Tool in the header of the server’s tab | An empty tab on the database named in the server’s connection settings. |
| Open in Query Tool in a data tab’s bar | A tab with the data tab’s SELECT, on the same database. See View data. |
| Script as on a right-click menu, or Open in Query Tool in a Script menu, a report, a Health check fix and other places that write SQL for you | A tab with that SQL. Nothing runs until you run it. See Scripts. |
FileOpen… (a .sql file), a recent file on the start page |
A tab with the file’s text. See Files, drafts and history. |
| A template or a snippet in the Library | See The Library. |
A new tab connects at once. The status bar says Connecting…, then Idle with the tab’s process id. If the
connection cannot be opened, the tab shows Could not connect: and the reason, with a Reconnect button.
Which database a new tab uses
Section titled “Which database a new tab uses”| You start from | The tab opens on |
|---|---|
| A row inside a database in the Explorer: the database itself, a schema, a table, a folder… | That database. |
| A server’s row, its Databases folder, or an object of the whole server: a role, a tablespace, the Security, Storage or Management group | The database named in the server’s connection settings (its Database field). |
| New query or ⌘ T (Ctrl+T on Windows and Linux) while no connected server is selected in the Explorer | The server and database of the tab in front. When that server is not connected, the new tab waits for it. |
The Explorer’s selection comes first: while a row of a connected server is selected, New query opens there, whatever tab is in front.
Switch the tab’s database
Section titled “Switch the tab’s database”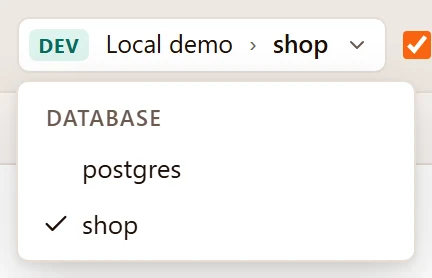
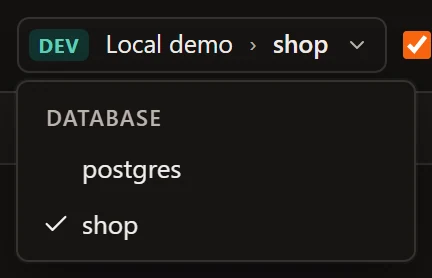
Click the connection button and choose a database. The list, under the label Database, has the server’s databases
as the Explorer lists them without system objects, with a check beside the one the tab uses. pgjumbo closes the tab’s
connection and opens a new one on the database you chose. The editor keeps its text; the results and messages of the
last run go. The new session starts with Auto-commit on and the server’s default settings, so anything you set
with Session settings or SET has to be set again.
The button’s tooltip is Switch database. It is greyed while a query runs, while a transaction is open with
Auto-commit off, and while changes to rows of a result are waiting to be saved; its tooltip then says
Finish the transaction, the query or the changes to the rows before switching databases. It is also greyed while
the tab has no open session (it is connecting, waiting for its server, or disconnected). A tab never moves to another
server: open a new tab there.
The toolbar
Section titled “The toolbar”The Query Tool’s buttons sit in the main toolbar and act on the tab in front. With no query tab in front they are greyed and the connection button is not there. Run, Explain, Auto-commit and the other buttons are also greyed while the tab has no open session.


- 1 Run, with its keys. See Run SQL.
- 2 Stop: greyed until something runs, then red, with its keys. See Stop a query.
- 3 Explain shows the plan of the selection or of the statement at the cursor. See Explain a query.
- 4 Run on several databases (the layers icon) runs the selection or the whole script on databases you choose. See Run on several databases.
- 5 The tab’s connection. See Switch the tab’s database.
- 6 Auto-commit. Untick it to work in a transaction; Commit and Rollback buttons then appear in front of it. See Transactions and sessions.
- 7 Session settings (the sliders icon): the search path, role, timeouts and
work_memof the tab’s session. See Session settings. - 8 More query actions (···). See The More menu.
The toolbar gives way as the window narrows (the widths are at 100 % zoom). In a window narrower than about 1,460 pixels the shortcut keys go, and Stop, Explain and New query lose their labels; narrower than about 1,120 pixels, Auto-commit loses its label too; narrower than about 920 pixels, the server’s name, Run on several databases and Session settings go (the More menu still has them). Hover a button for its name.
On a table’s tab, on its Data view, the same buttons act on the table’s rows: Run shows them again. See View data.
The More menu
Section titled “The More menu”The More query actions button (···) at the end opens the actions that have no button of their own. Each item does what the item of the same name in the Query menu does.
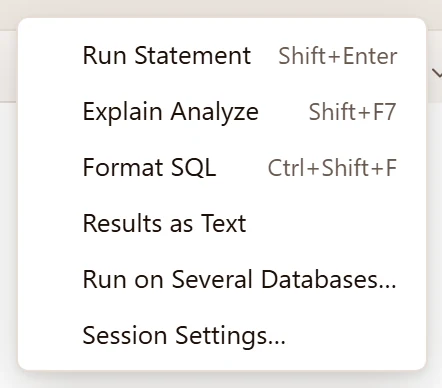
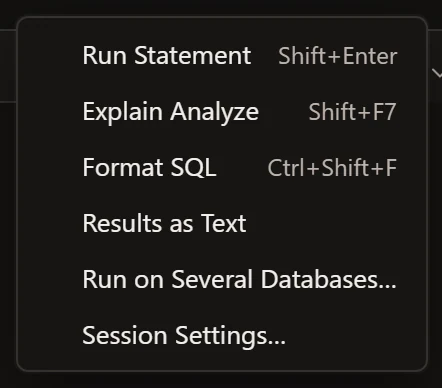
| Item | Keys | What it does |
|---|---|---|
| Run Statement | ⇧ ↩︎ (Shift+Enter on Windows and Linux) | Runs the selection, or the statement at the cursor. See Run SQL. |
| Explain Analyze | ⌥ ⌘ E (Shift+F7 on Windows and Linux) | Runs the statement and shows its plan with real times. See Explain a query. |
| Format SQL | ⇧ ⌘ F (Ctrl+Shift+F on Windows and Linux) | Lays out the selection or the whole tab. See Format SQL. |
| Results as Text | Shows results as psql prints them; a check shows while it is on. See Results. | |
| Run on Several Databases… | See Run on several databases. | |
| Session Settings… | See Session settings. |
The More button is greyed while something runs and while the tab has no session. In a data tab, which has no editor, Run Statement, Explain Analyze, Format SQL and Run on Several Databases… are greyed.
Run SQL
Section titled “Run SQL”There are three ways to run, and they differ only in what they take from the editor:
| Command | Keys | What runs |
|---|---|---|
| Run (toolbar, QueryRun) | ⌘ ↩︎ (Ctrl+Enter on Windows and Linux) | The selection, or the whole tab when nothing is selected. |
| Run Statement (QueryRun Statement, More) | ⇧ ↩︎ (Shift+Enter on Windows and Linux), in the editor only | The selection, or the statement the cursor is in. |
| Run Script (QueryRun Script) | ⇧ ⌘ ↩︎ (Ctrl+Shift+Enter on Windows and Linux), or F5 in the editor | The whole tab, even when something is selected. |
pgjumbo splits what it runs into statements and sends them one at a time, in order:
- A semicolon ends a statement, as in psql. So does a blank line, which psql does not do: statements written without semicolons, a blank line apart, run one by one.
- Neither counts inside a string, a quoted name, a dollar-quoted body, a comment, parentheses or a
BEGIN ATOMIC … ENDfunction body. - When the cursor sits between two statements, Run Statement takes the one before it; above the first statement, it takes the first.
- ⇧ ↩︎ (Shift+Enter on Windows and Linux) runs only from the editor. Anywhere else it does what it always does.
- Running an empty tab, or a selection of nothing but spaces, does nothing.
Each statement that returns rows gets a Data Output tab of its own, and a new run replaces the results of the last one. Every run also goes into the server’s query history. If you have changed rows of a result and not saved them, pgjumbo asks before a run drops them; see Edit data. With Auto-commit off, the run takes place in a transaction that stays open; see Transactions and sessions.
Two kinds of statement always fail in the Query Tool, and stop the script there:
- A statement that starts with a backslash, such as
\d orders, is a psql meta-command, not SQL; it runs to the end of its line. pgjumbo does not send it; it fails withpsql meta-commands such as \d are not SQL. Run the query they stand for, or use psql. COPY … FROM STDINandCOPY … TO STDOUTneed a file on your computer, which the Query Tool does not provide. pgjumbo ends the copy and the statement fails withCOPY … FROM STDIN and COPY … TO STDOUT need a file on this computer, which the Query Tool does not provide. Use COPY with a file on the server, or \copy in psql.To copy a table’s rows to or from a file on your computer, use Import and export table data.
For \d, \copy and psql’s other own commands, open a PSQL Tool on the database: it runs
PostgreSQL’s own psql in a tab.
When a statement fails
Section titled “When a statement fails”The script stops at the first statement that fails. The statements after it are not sent.
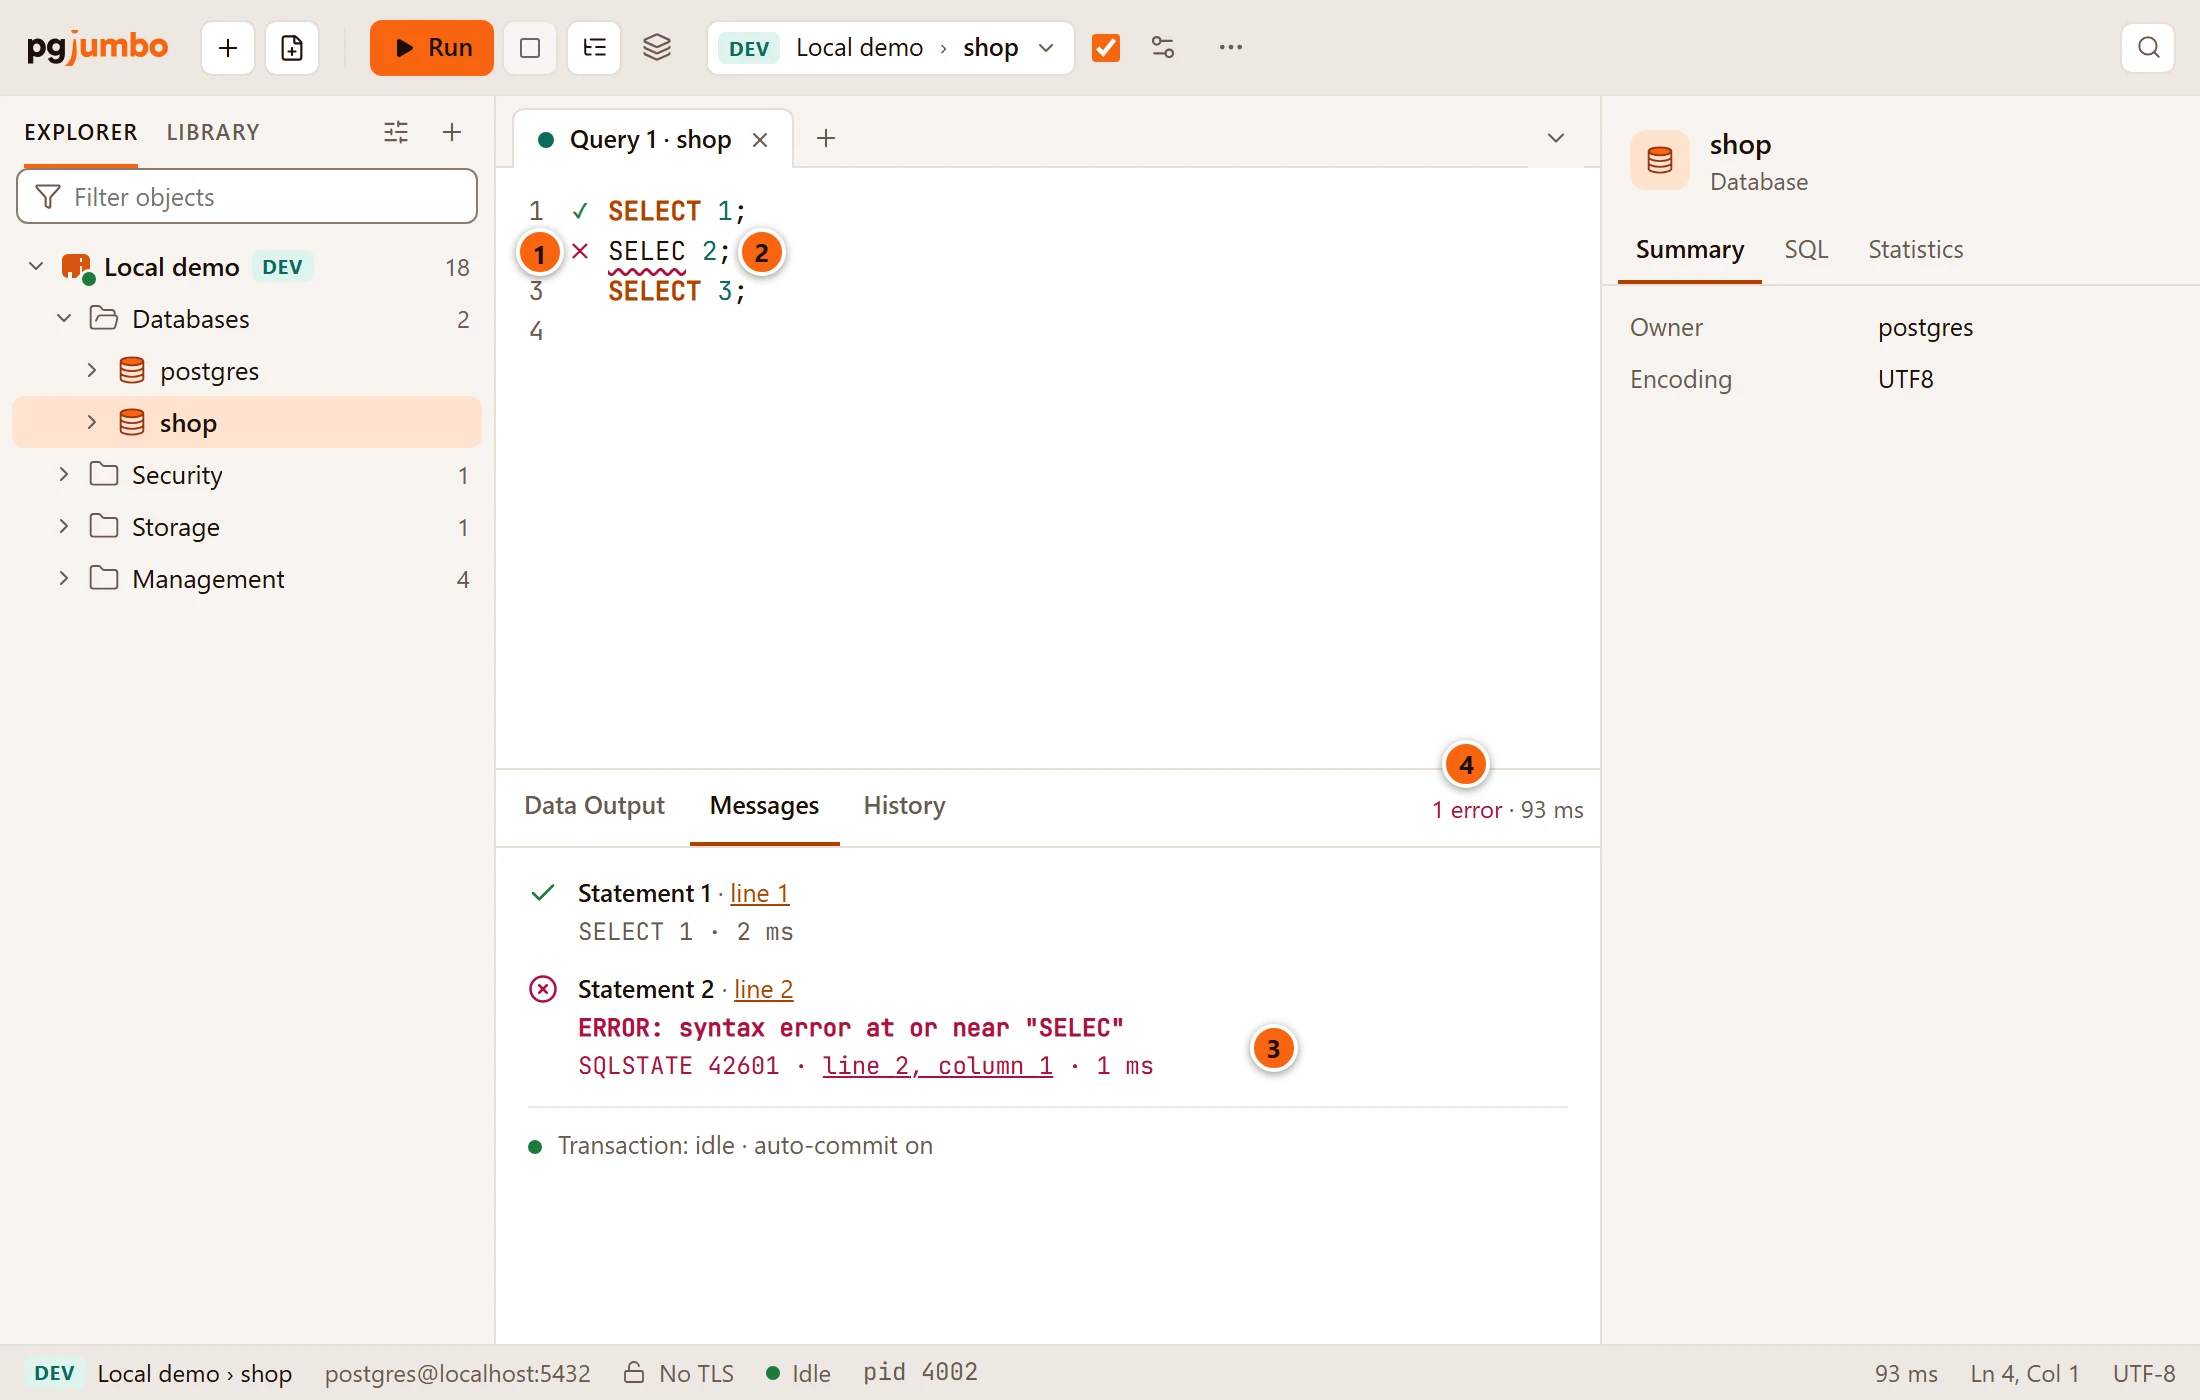
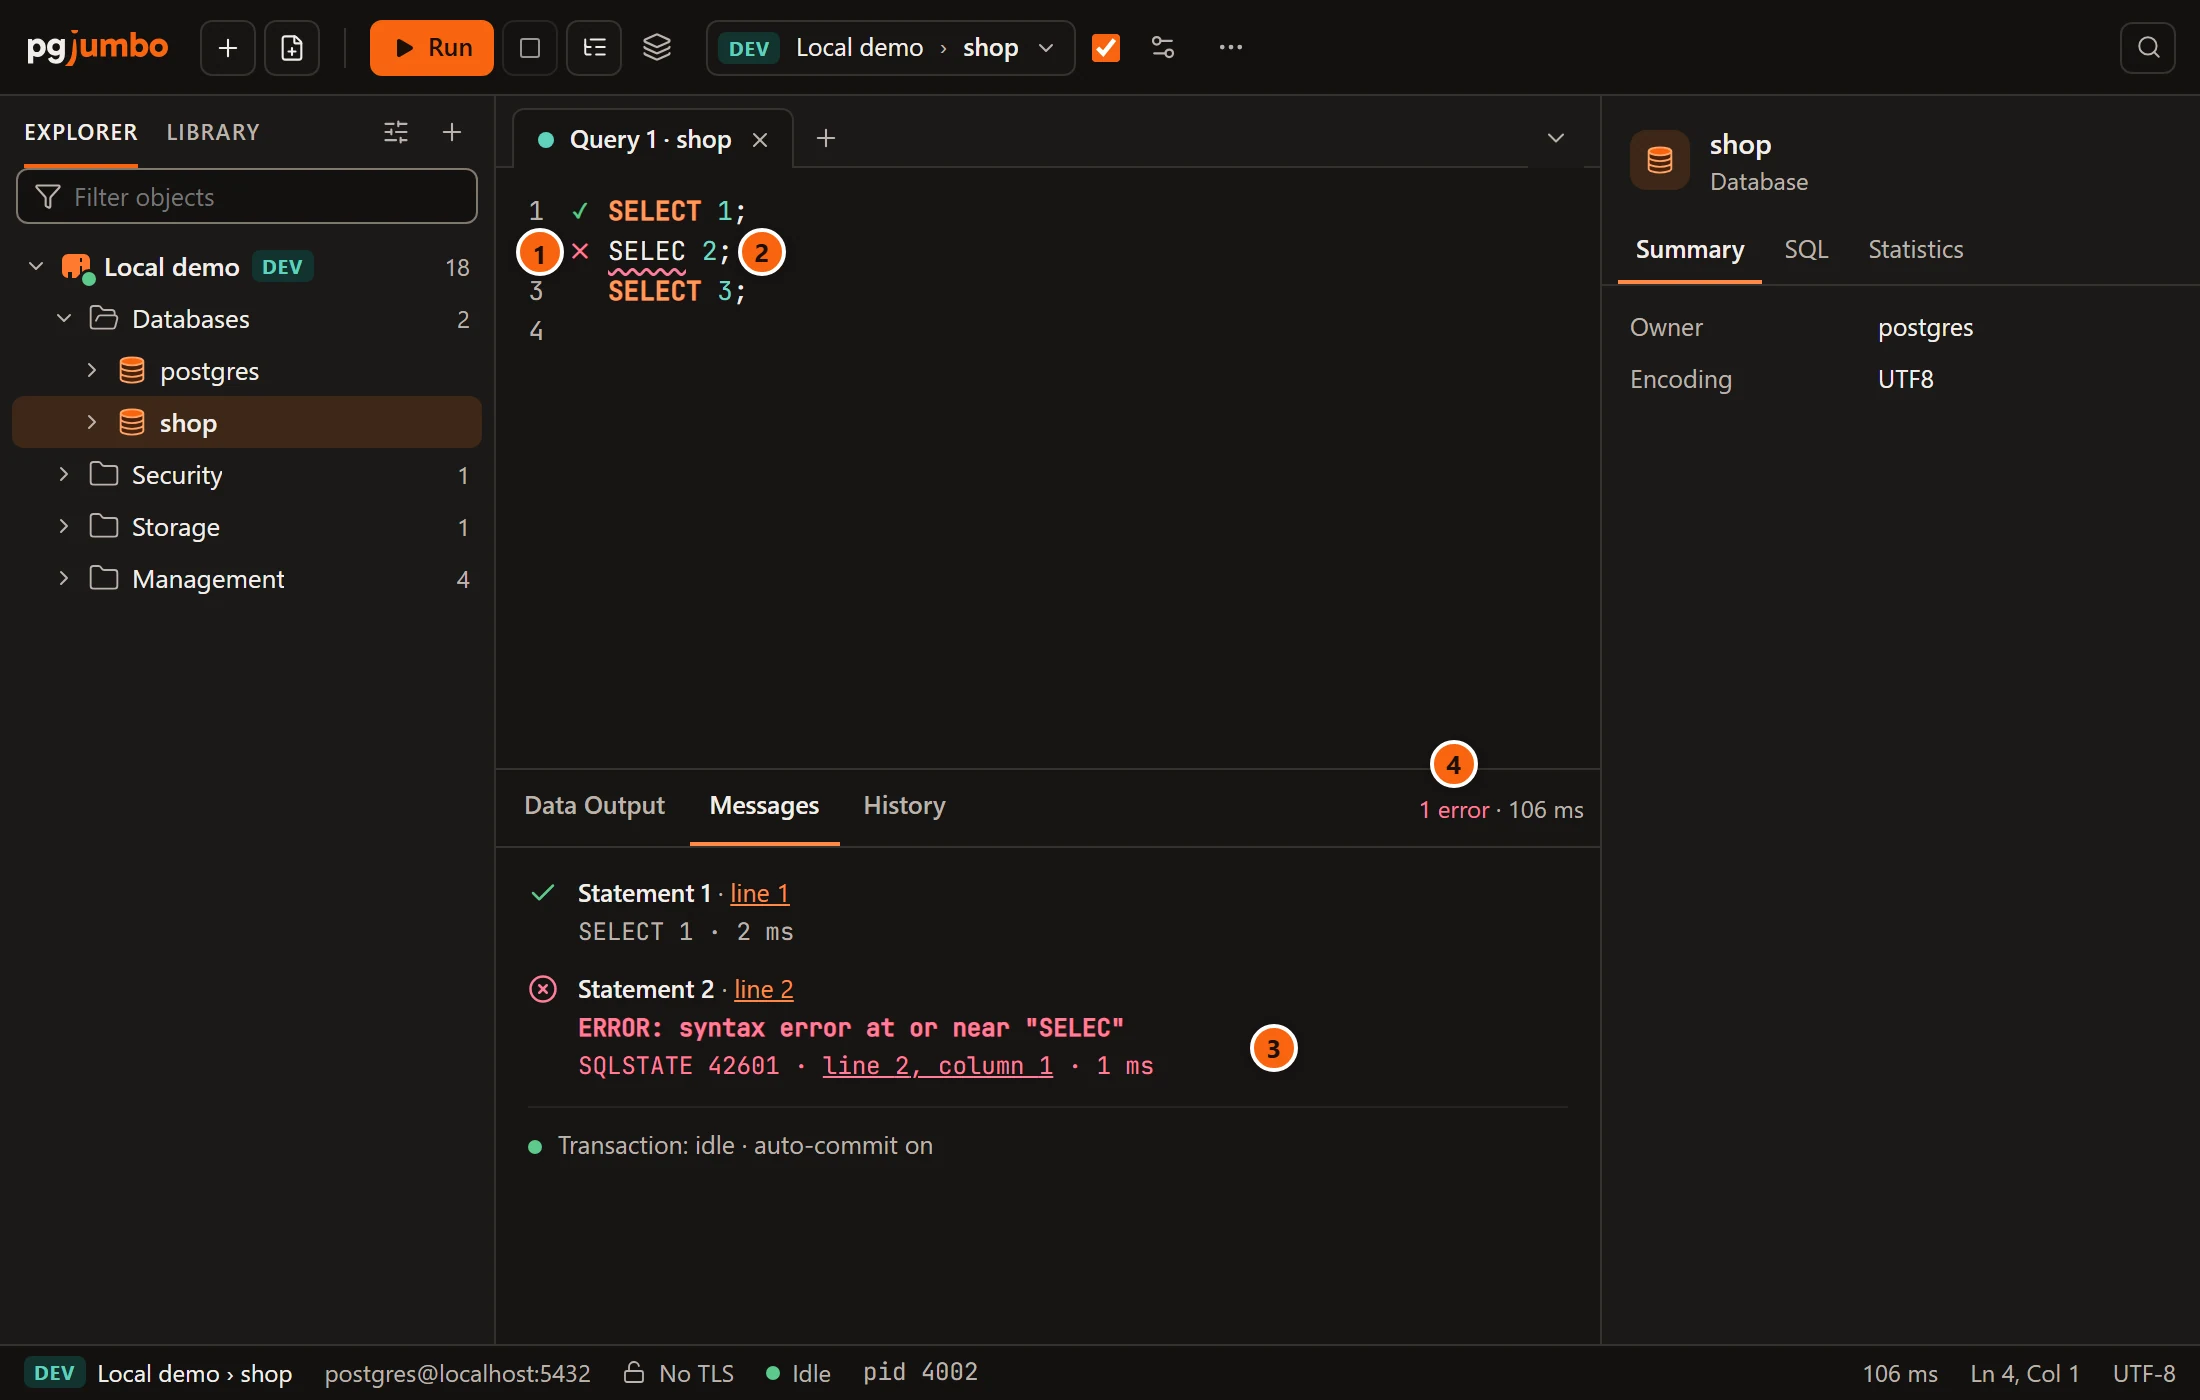
- 1 A cross beside the statement that failed. The first statement has a check; the third has no mark, because it never ran.
- 2 The place PostgreSQL reported is underlined. The underline goes as soon as you change the text.
- 3 Messages shows PostgreSQL’s error with its SQLSTATE and a link to its line and column. Results explains every part of it.
- 4 Beside the result tabs, how many statements failed.
Follow a running script
Section titled “Follow a running script”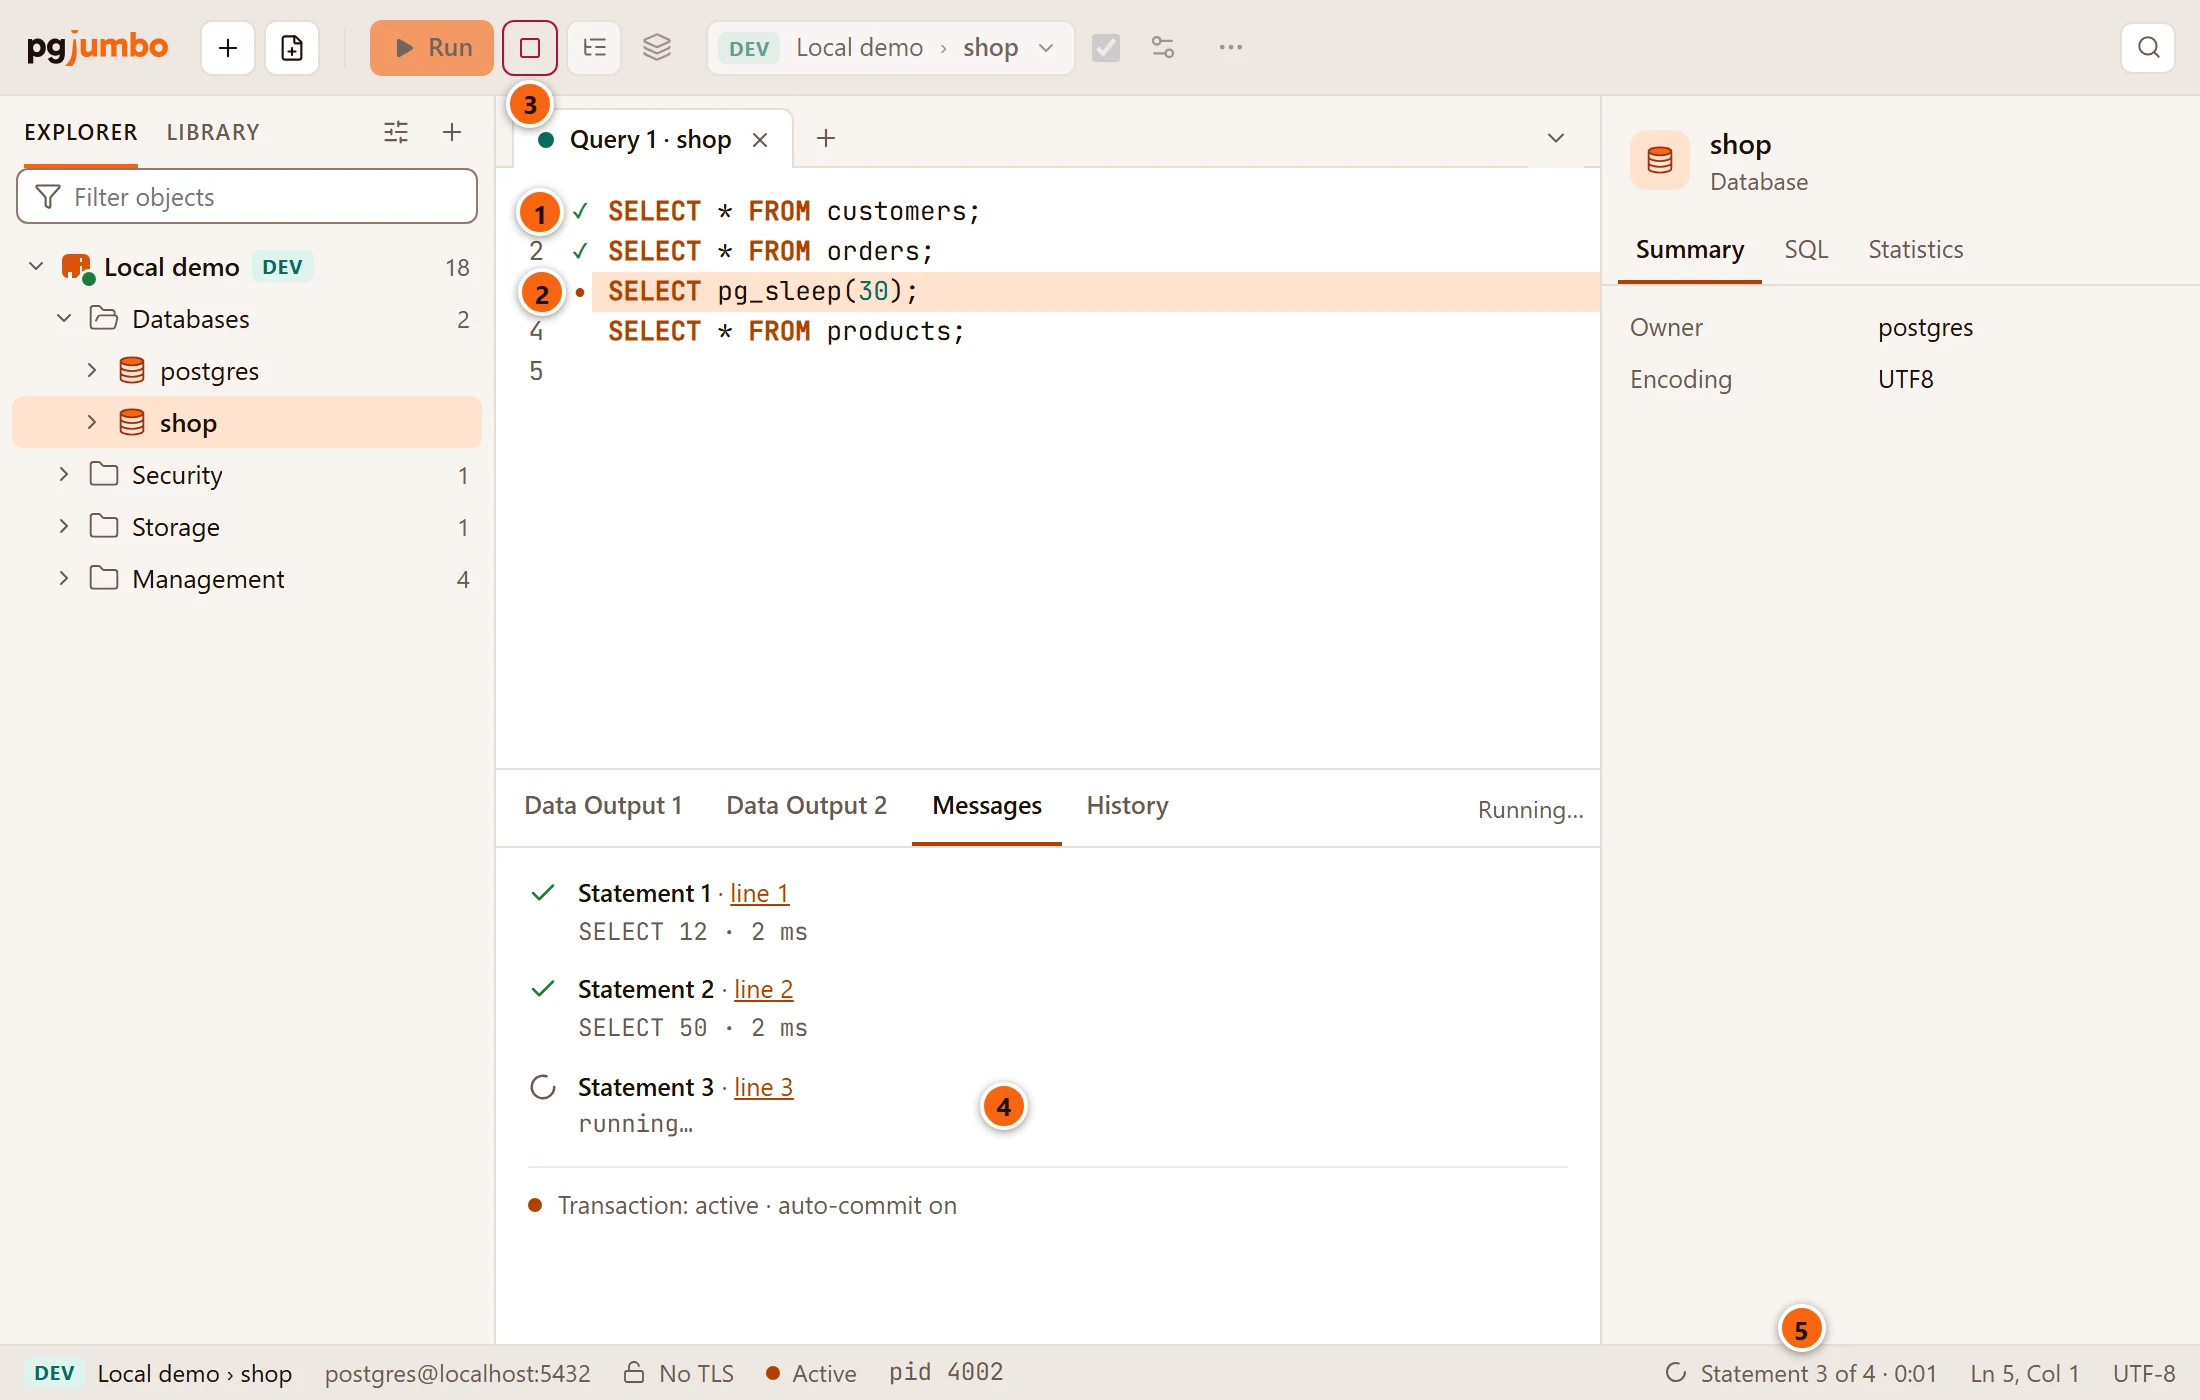
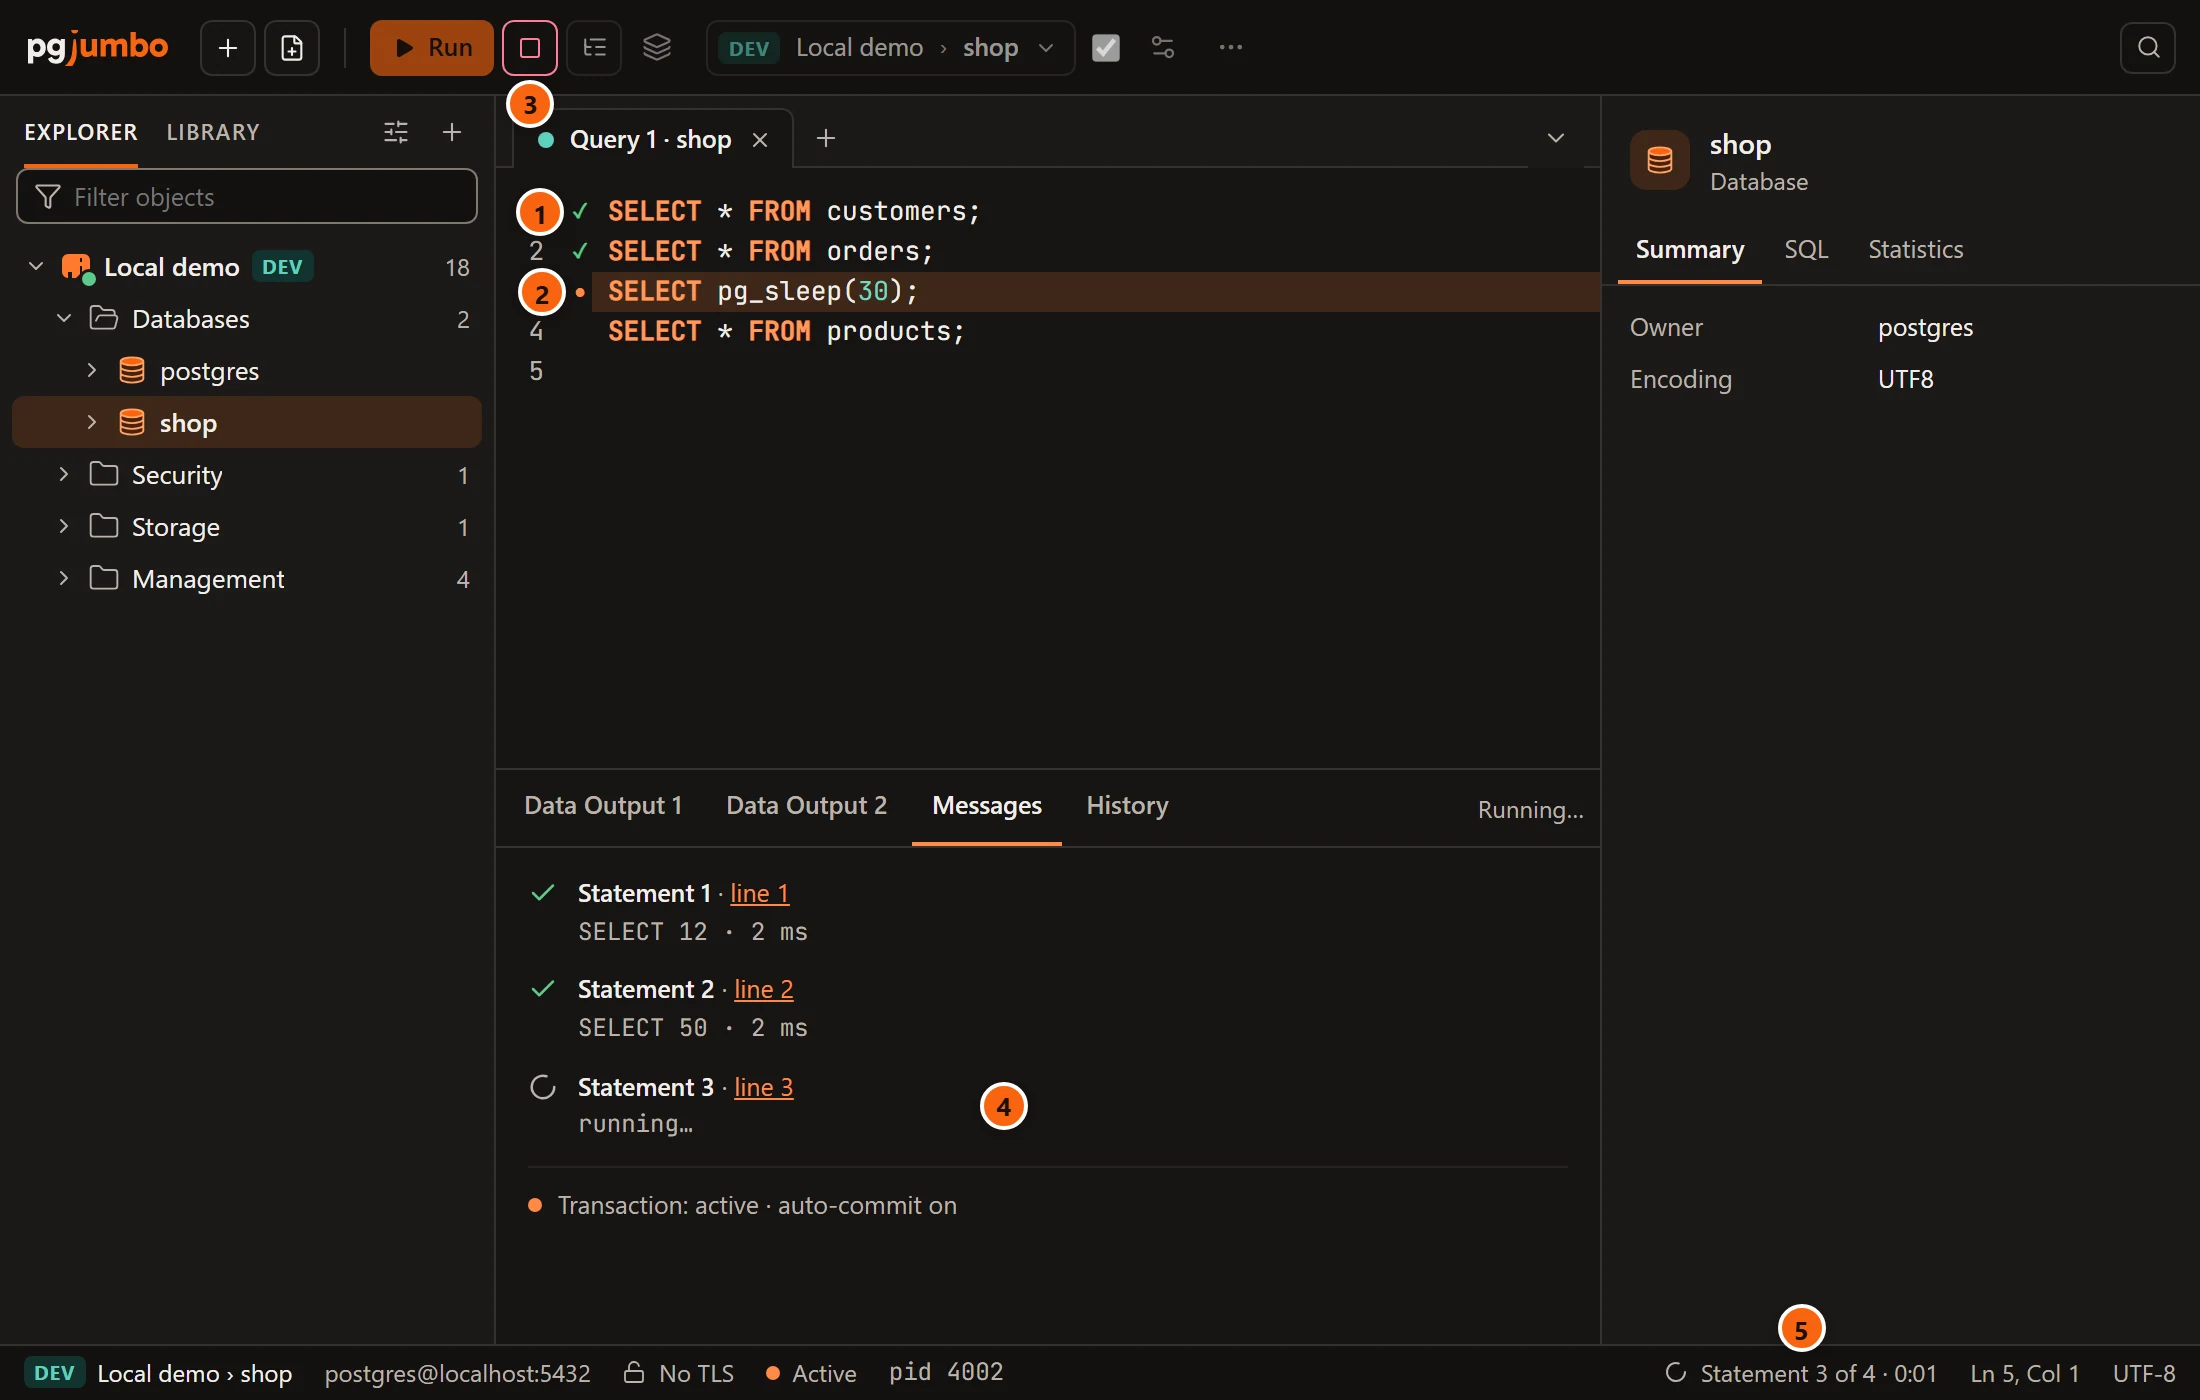
- 1 A check beside each statement that has finished. Hover it to see the statement’s number, its command
tag and its time, for example
Statement 1 · SELECT 12 · 2 ms. - 2 A dot beside the statement running now, whose lines are highlighted. A statement that failed gets a cross. When several statements share a line, the worst mark shows and its tooltip lists each of them.
- 3 Stop is red while something runs.
- 4 Messages lists the statements as they start and finish; the running one says
running…. - 5 The status bar shows which statement is running, out of how many, and for how long:
Statement 3 of 4 · 0:01.
The marks stay on their statements while you edit the text, and the next run replaces them. Beside the result tabs the run says Running… until it ends.
While a script runs, the editor scrolls to keep the running statement in view. To leave the editor where you put it, untick Follow the running statement while a script runs in SettingsEditor. See Settings.
For a statement that PostgreSQL reports progress for, the status bar also shows the command, its phase and how far it
is: a percentage and a bar when the total is known (for example CREATE INDEX · building index: scanning table · 42 %),
otherwise the blocks, tuples or bytes done so far. This works for CREATE INDEX, REINDEX, VACUUM, VACUUM FULL
and CLUSTER; for ANALYZE from PostgreSQL 13; and for COPY from PostgreSQL 14. pgjumbo reads it once a second.
When the tab is on the database named in the server’s connection settings, hovering it shows the table’s name.
Activity shows the same for every session of the server.
Stop a query
Section titled “Stop a query”Click Stop, choose QueryStop, or press ⌘ . (Ctrl+. on Windows and Linux). In the editor, Shift+F5 stops too.
pgjumbo sends PostgreSQL a cancel request for the tab’s session, the same request psql sends when you press Ctrl+C.
The running statement fails with canceling statement due to user request (SQLSTATE 57014), rows that had already
arrived stay in the grid, and the rest of the script does not run. With Auto-commit off the transaction is then
failed and has to be rolled back; see
When a statement fails inside a transaction.
Stop also stops an Explain and a run on several databases (every database at once). Closing a tab stops what it is running before its connection closes.
When a long query ends
Section titled “When a long query ends”When a run takes 10 seconds or more and pgjumbo is not the window in front as it ends, your system shows a
notification: Query finished or Query failed, with the tab’s name, how long the run took and, when it succeeded
and returned rows, how many (Query 1 · shop · 12.4 s · 1,204 rows). It never contains the SQL. A query you stopped
counts as failed. While pgjumbo is the window in front, nothing shows. A run on several databases notifies the same
way; Explain does not.
Choose when it shows in SettingsSafetyNotify when a query ends: Never, After 5 seconds, After 10 seconds (the default), After 30 seconds, After a minute or After 5 minutes. If no notification appears, check that your system allows notifications from pgjumbo.
Destructive statements on Production
Section titled “Destructive statements on Production”On a server tagged Production, pgjumbo asks before it runs a statement that removes objects or every row of a table. Nothing is sent to the server until you answer.
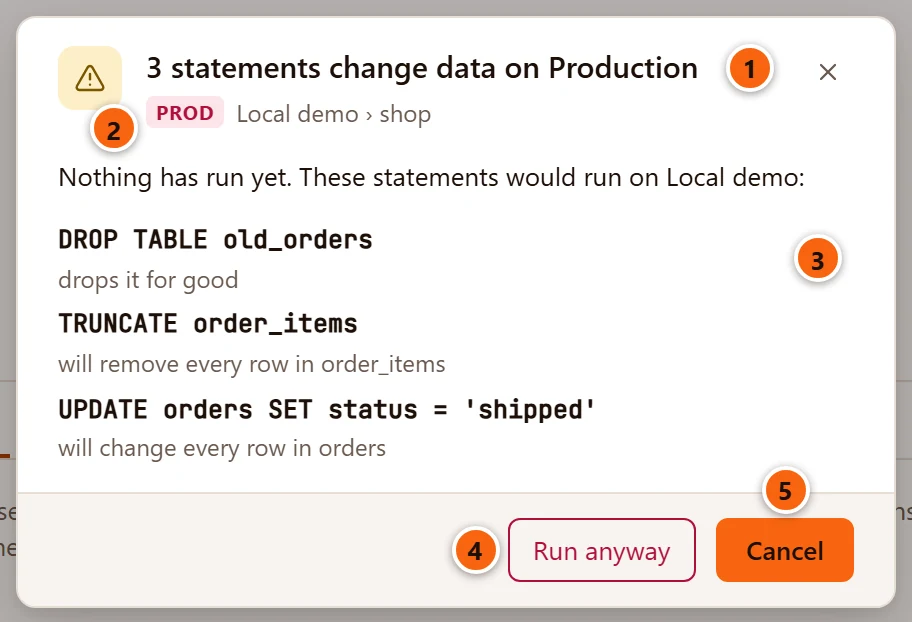
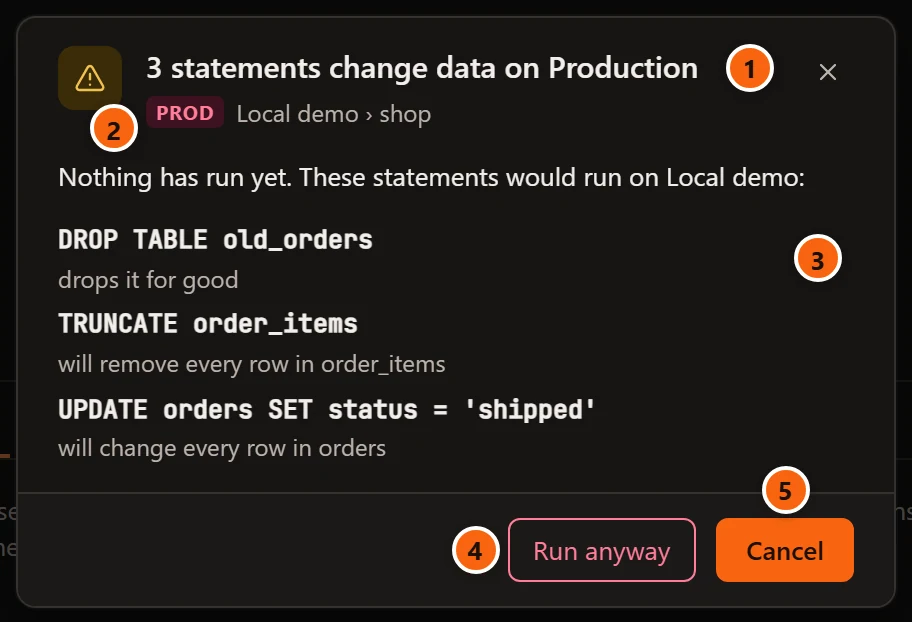
- 1 How many statements ask, and on what:
3 statements change data on Production(oron Staging). With only one such statement, the title names it instead (see the table below). - 2 The server’s environment tag, the server and the database it would run on.
- 3
Nothing has run yet. These statements would run on Local demo:, then each statement that asks, on one line (a long one is cut), with what it would do under it:drops it for good,will remove every row in order_items,will change every row in orders. With only one such statement the dialog says it in a sentence instead, such asTRUNCATE order_items will remove every row in order_items on Local demo.orDROP TABLE old_orders will drop it on Local demo. It cannot be undone. - 4 Run anyway runs the script as it is, from its first statement.
- 5 Cancel sends nothing. It is the default: Enter, Esc and the ×
cancel too.
Nothing was run.shows beside the result tabs for a few seconds.
| Statement | It asks when | The title when it is the only one |
|---|---|---|
DROP … |
Always, whatever it drops. | This DROP cannot be undone |
TRUNCATE … |
Always. | This TRUNCATE empties the table |
UPDATE … |
It has no WHERE at its own level. |
This UPDATE has no WHERE clause |
DELETE … |
It has no WHERE at its own level. |
This DELETE has no WHERE clause |
pgjumbo looks only at the words outside parentheses, strings and comments, so a WHERE that is only inside a
subquery does not count. After WITH, the statement’s own UPDATE or DELETE counts, not one inside a common table
expression. ALTER TABLE … DROP COLUMN does not ask: only a statement that starts with DROP does.
It asks for Run, Run Statement, Run Script and F5 alike, about the part that would run. A run on several databases asks once for all of them; see Run on several databases. It also asks for Explain Analyze, which really runs the statement. A plain Explain runs nothing and never asks.
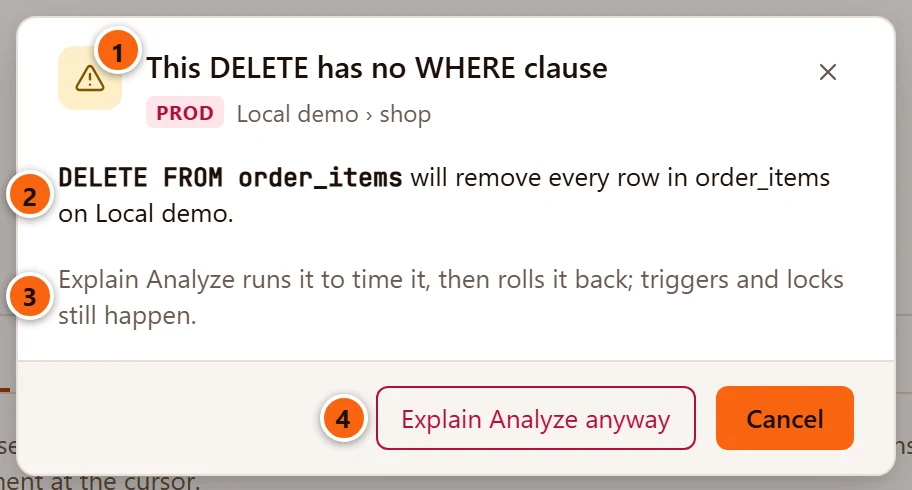
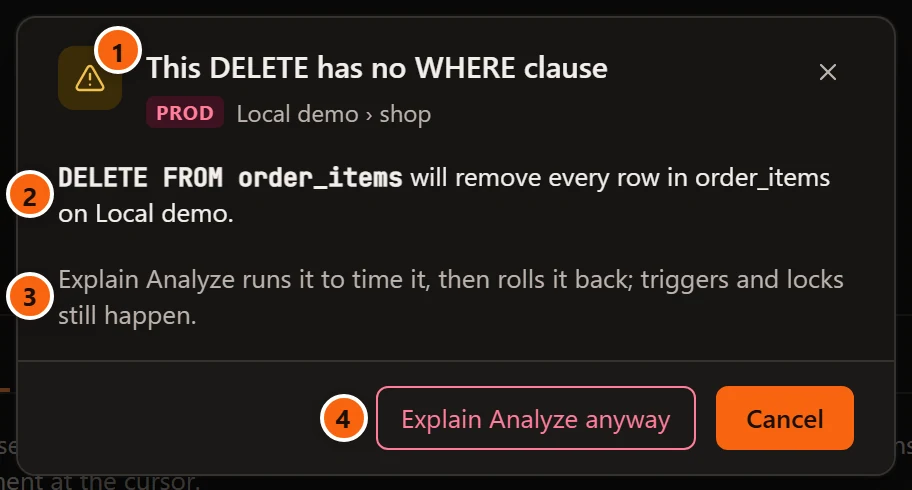
- 1 With one statement, the title names what it does.
- 2 The statement and what it would do, in one sentence.
- 3 For Explain Analyze only:
Explain Analyze runs it to time it, then rolls it back; triggers and locks still happen. - 4 Explain Analyze anyway takes the place of Run anyway. Cancel is still the default.
A server tagged Staging asks the same way when you tick SettingsSafetyStaging servers ask before destructive statements too. A Dev server never asks. pgjumbo’s engine also refuses such a script on a server that asks, unless you confirmed it, so no way of running it skips the question.
The Query menu
Section titled “The Query menu”Every Query Tool command is also in the Query menu of the menu bar. Its items act on the tab in front and are greyed when there is nothing for them to do. Menus lists every menu.
| Item | Keys | Where it is explained |
|---|---|---|
| Run | ⌘ ↩︎ (Ctrl+Enter on Windows and Linux) | Run SQL |
| Run Statement | ⇧ ↩︎ (Shift+Enter on Windows and Linux) in the editor | Run SQL |
| Run Script | ⇧ ⌘ ↩︎ (Ctrl+Shift+Enter on Windows and Linux) | Run SQL |
| Run on Several Databases… | Run on several databases | |
| Explain | ⌘ E (F7 on Windows and Linux) | Explain a query |
| Explain Analyze | ⌥ ⌘ E (Shift+F7 on Windows and Linux) | Explain a query |
| Stop | ⌘ . (Ctrl+. on Windows and Linux) | Stop a query |
| Format SQL | ⇧ ⌘ F (Ctrl+Shift+F on Windows and Linux) | Format SQL |
| Fill in Template Values… | ⇧ ⌘ M (Ctrl+Shift+M on Windows and Linux) | Fill in a template’s values |
| Commit, Rollback | Auto-commit | |
| Auto-commit | Auto-commit | |
| Results as Text | Results | |
| Session Settings… | Session settings | |
| Go to Definition | F12 | Go to Definition |
| Ask the Assistant… | ⌘ K (Ctrl+K on Windows and Linux) | SQL help in the editor (only while the Assistant is on) |
Run Statement shows no keys in the menu: ⇧ ↩︎ (Shift+Enter on Windows and Linux) works only in the editor, so that the key still starts a new line in every other text field.