

Footprint and tips
After a run, pgjumbo says for each statement what it cost the server: how much it read, how much of that came from the cache, what it wrote to temporary files and to the WAL. That line is the statement’s footprint. From a footprint, and from an Explain Analyze plan, pgjumbo also draws tips: one thing that happened, and one thing to try. Nothing is tried until you click.
Each statement’s footprint
Section titled “Each statement’s footprint”Run a script of up to 16 statements and open Messages. Under each statement that has one is its footprint.
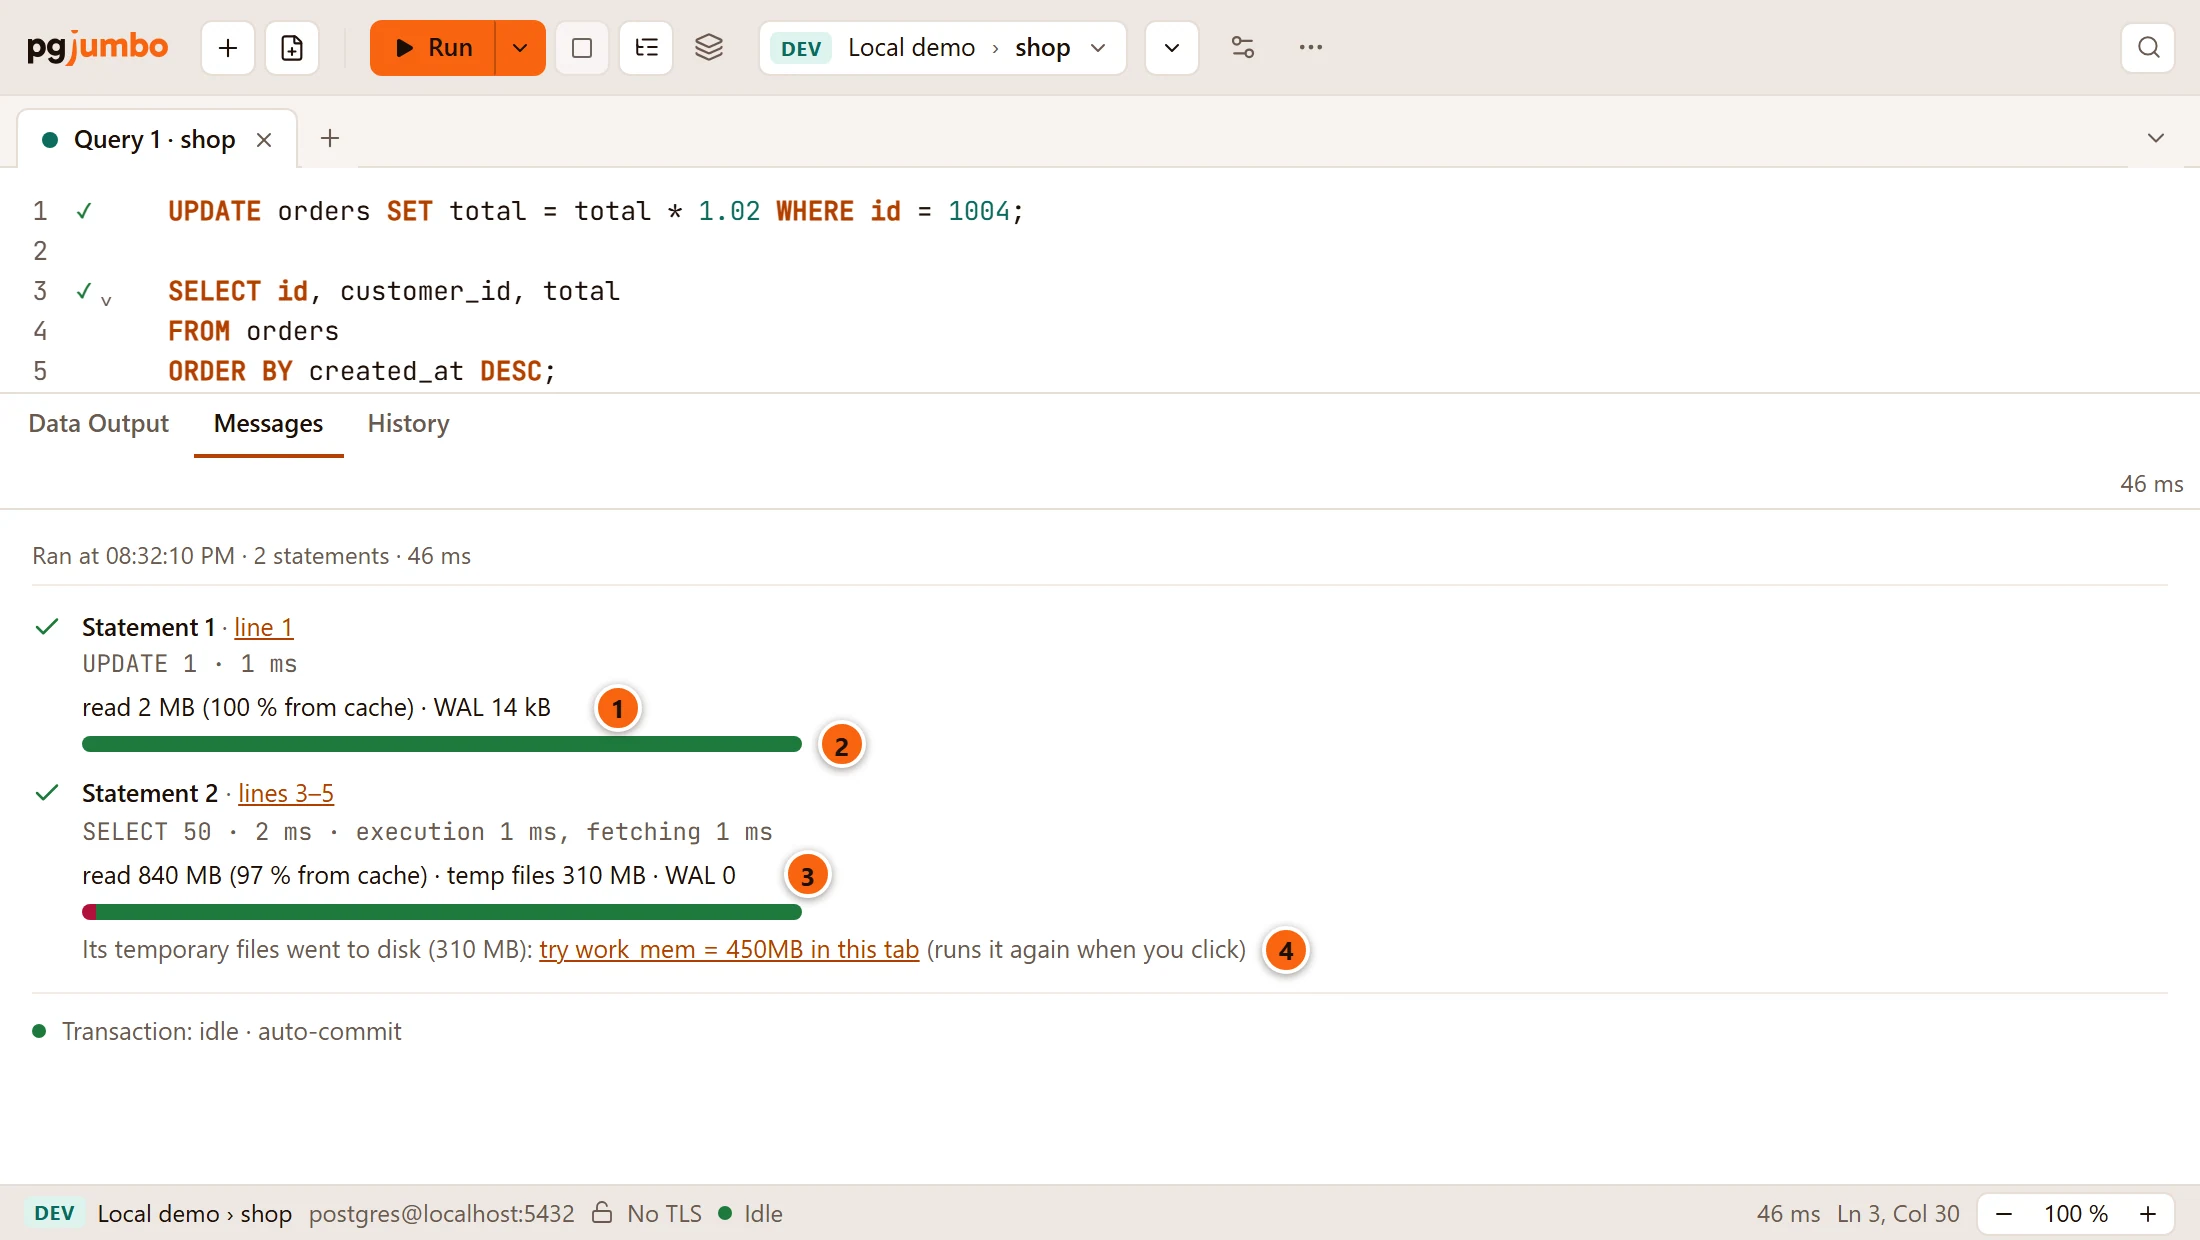
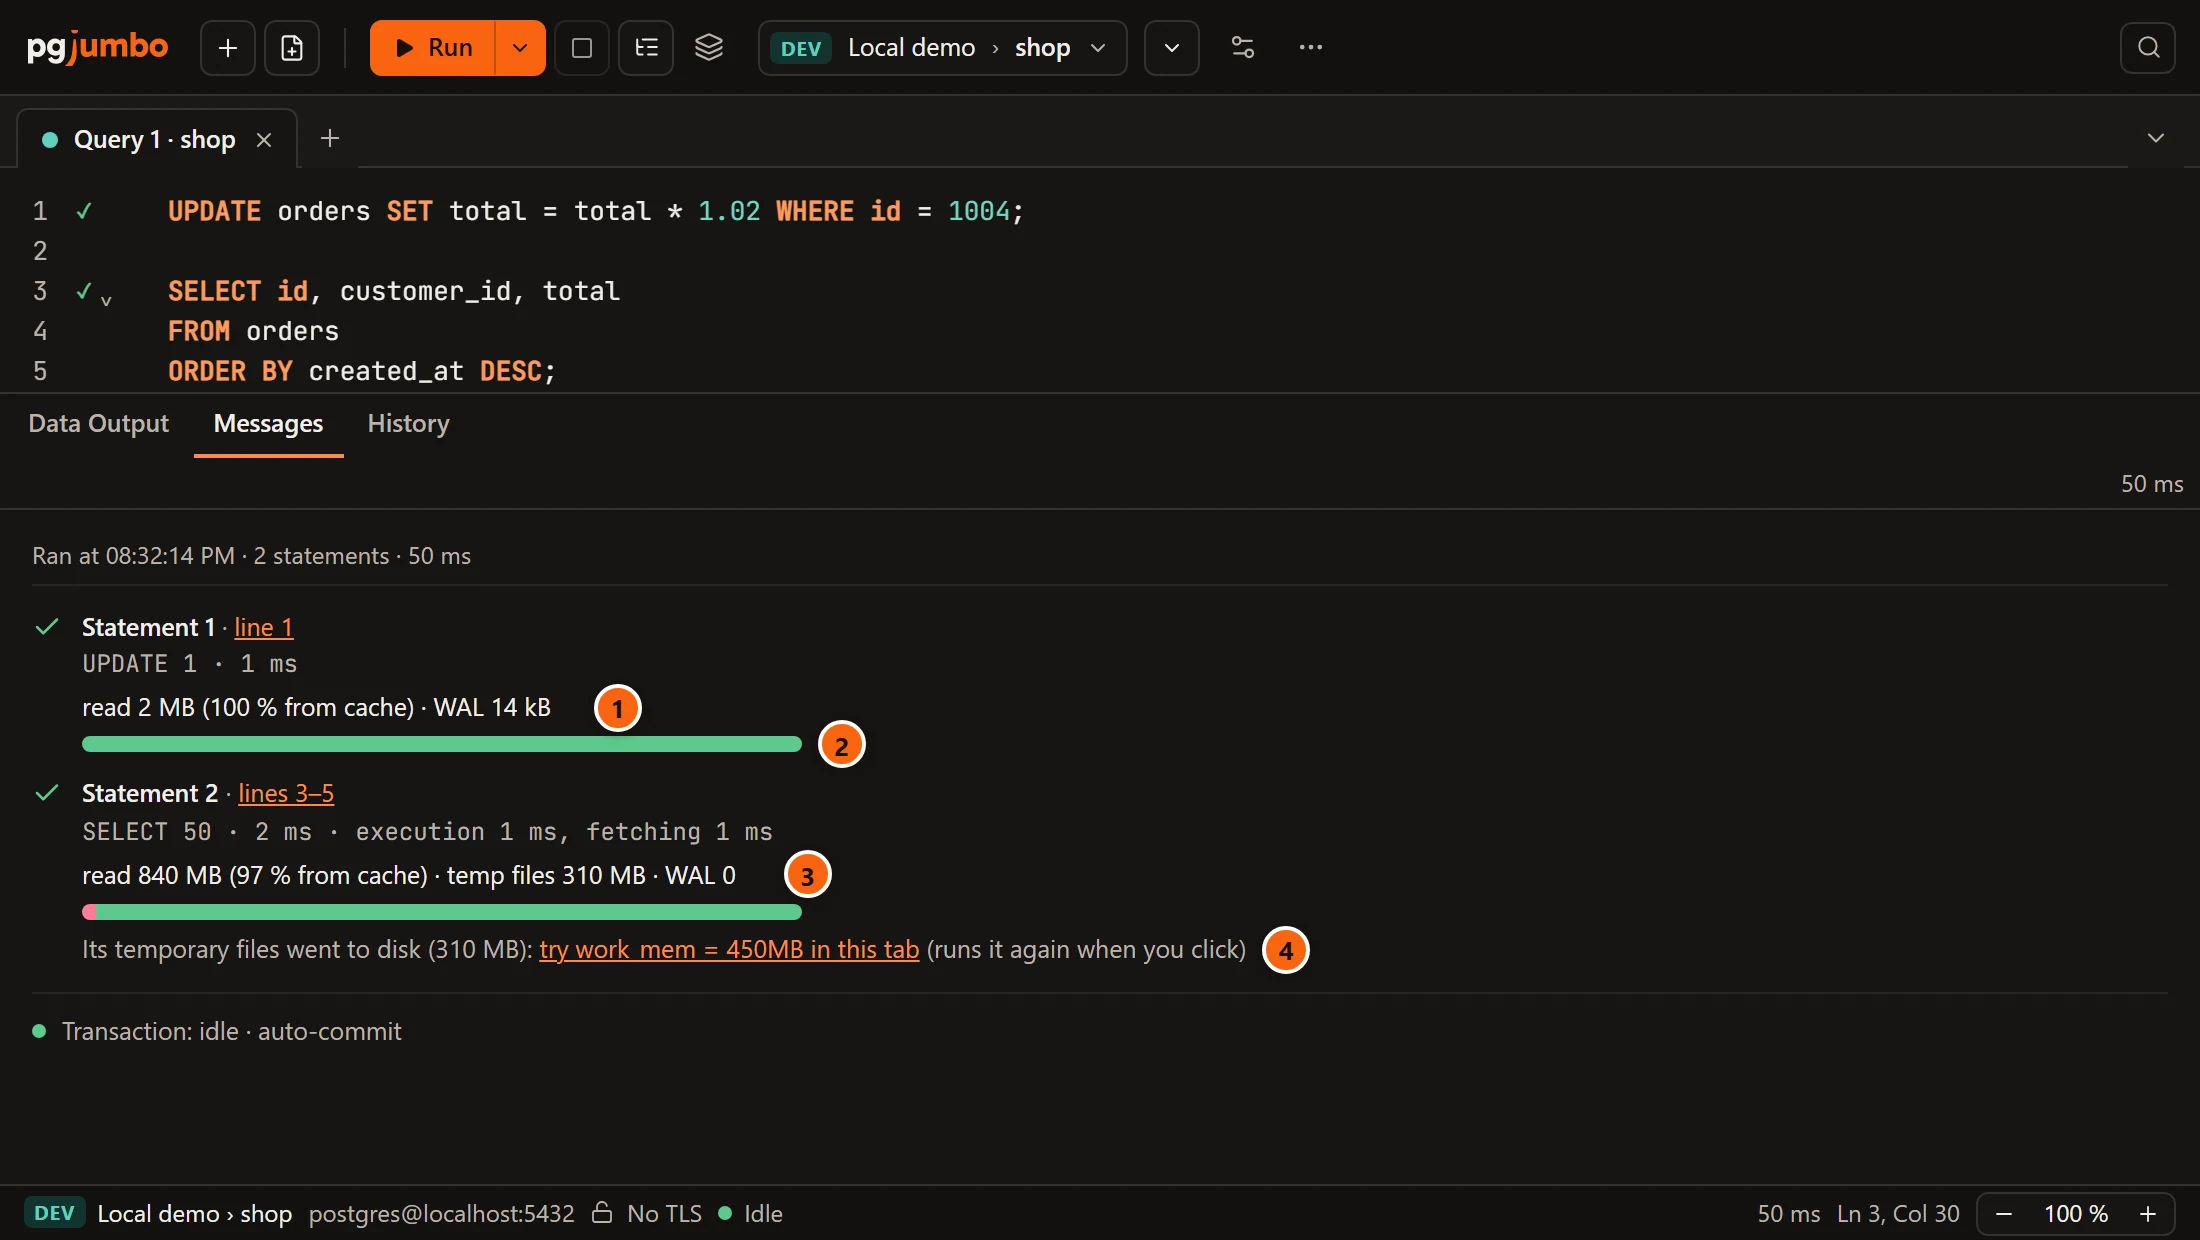
- 1 A write’s footprint: what it read, the share of that found in the cache, and the WAL it wrote.
- 2 The bar draws the same share: green for what was found in the cache, red for what had to be read in.
- 3 A read that sorted on disk:
temp filesand their size are in the line. - 4 A footprint with temporary files offers a tip: see Tips to try.
What the parts of the line mean:
| Part | What it says |
|---|---|
read 840 MB (97 % from cache) |
The data the statement went through: what it found in PostgreSQL’s buffers and what it had to read into them, together, and the share that was found. What is read in comes from the disk or from the operating system’s own cache. read nothing when it touched none. |
temp files 310 MB |
What it wrote to temporary files, as a sort or a hash does when it does not fit in work_mem. Left out when it wrote none. |
WAL 14 kB |
What it wrote to the write-ahead log. WAL 0 for a statement that changed nothing. Left out on PostgreSQL 12, whose pg_stat_statements does not count it. |
this session's own reads |
The numbers come from the second source below. |
No EXPLAIN ANALYZE is behind this, and the statement runs once, as you ran it. pgjumbo reads counters the server
already keeps, before the statement and after it, and shows the difference. Hover the line to see which counters
counted it.
The results grid covers the rest of the Messages tab.
Where the numbers come from
Section titled “Where the numbers come from”pgjumbo uses one of two sources, chosen once for a run:
pg_stat_statements, where the server loads it and the extension is created in the tab’s database. It counts the reads from the cache and from disk, temporary files and the WAL, a parallel query’s workers included, and inside a transaction too. pgjumbo shows a footprint only when the statement’s entry was called exactly once more between the two readings, so another session that ran the same query in that moment is never taken for yours.- The session’s own counters, on PostgreSQL 18 or later, when
pg_stat_statementsis not there. They are kept for statements outside a transaction only, and they leave out a parallel query’s workers and temporary files. The line endsthis session's own reads.
A server with neither gets no footprints.
When a statement has no line
Section titled “When a statement has no line”- The run had more than 16 statements.
- The statement has parameters.
- It ran inside a failed transaction, or it failed.
- With
pg_stat_statements: it is not aSELECT,INSERT,UPDATE,DELETEorMERGE. DDL,VACUUMand the like are not looked up there. - With
pg_stat_statements: another session ran the same statement at the same moment, or the server gives statements no query id (compute_query_idis off, or the server is older than PostgreSQL 14). A plainSELECTstill gets its line there. - With the session’s own counters: it ran inside a transaction.
A reading that fails leaves the run exactly as it was, without the line.
Turn the footprint off
Section titled “Turn the footprint off”SettingsRunning queriesWhile a script runsSay what each statement read and wrote is on when pgjumbo is new. Turned off, runs read no counters and Messages has no footprint lines. Short runs then also stop adding plans to a statement’s baseline: see Plans in production. The setting is described with the others in Settings.
Tips to try
Section titled “Tips to try”A tip has two halves: what the statement did, and a link with what to try. pgjumbo offers tips in two places.


- 1 The hint about the slowest step. It is part of every plan and offers nothing to click: Explain a query covers it.
- 2 A tip, under the hint: “The sort went to disk (310 MB):” and the link try work_mem = 450MB in this tab.
Under a plan, tips come only after Explain Analyze, since a plain Explain ran nothing to learn from. They show under the plan in each of its four views. A plan gets at most one tip of each kind, in the order of its steps.
Each tip
Section titled “Each tip”| What happened | The tip | What a click does |
|---|---|---|
| A sort, a hash or a hash aggregate did not fit in memory and went to disk. | “The sort went to disk (310 MB): try work_mem = 450MB in this tab”. The line starts “The hash” or “The hash aggregate” for those. | Sets work_mem for this tab, then asks for the plan again with Explain Analyze. |
| A scan returned 50 times more rows than the planner expected, or 50 times fewer. | “The planner expected 40 rows from orders and got 52,000: open ANALYZE for the table”, or, when the scan’s conditions name two or more columns, “open CREATE STATISTICS for its columns”. | Opens a script in a new Query Tool tab. It does not run. |
| A nested loop ran its inner side 10,000 times or more. | “A nested loop ran its inner side 12,400 times: try enable_nestloop = off in this tab, as a diagnosis (a diagnosis, not a fix)”. | Sets enable_nestloop = off for this tab, then asks for the plan again with Explain Analyze. |
| Under a footprint in Messages: the statement wrote temporary files. | “Its temporary files went to disk (310 MB): try work_mem = 450MB in this tab (runs it again when you click)”. | Sets work_mem for this tab, then runs that one statement again. |
The work_mem a tip offers is a third more than what went to disk, rounded up to the next 50 MB.
Try a setting
Section titled “Try a setting”

- 1 “work_mem = 450MB is set for this tab.” For the nested loop’s tip the line reads “enable_nestloop = off is set for this tab, as a diagnosis: set it back when you are done.”
A click on a setting’s tip does two things, in this order:
- It sets the value on this tab’s session, as a
SETtyped in the tab would. No other tab, no other session and no server setting changes. - It does the statement again, so you see what the setting changes. Under a plan, that is Explain Analyze again: the statement runs and is rolled back. Under a footprint, the statement itself runs again, through the same checks as Run.
The setting stays for the tab’s session after that. Put it back with RESET work_mem; or RESET enable_nestloop;,
or in the tab’s Session Settings.
enable_nestloop = off is a diagnosis. It tells you whether the planner’s choice of a nested loop is to blame for
the time; it is not a setting to keep. When the plan is much faster without nested loops, look for the estimate that
misled the planner, then set it back.
Open a script
Section titled “Open a script”The tip about a wrong estimate opens one of two scripts in a new Query Tool tab on the same database. The table is written with its schema, so the script also works outside the session’s search path.
When the scan’s conditions name one column, or none:
-- Fresh statistics for public.orders.ANALYZE public.orders;When they name two or more, the planner may have taken the columns for independent:
-- The planner thought these columns independent; extended statistics tell it how they go together.CREATE STATISTICS orders_region_status_stats (dependencies, ndistinct) ON region, status FROM public.orders;ANALYZE public.orders;Read the script and run it when you choose. Maintenance has ANALYZE as a dialog too.
What a tip never does
Section titled “What a tip never does”- Nothing is applied until you click the tip’s link.
- A tip sets only
work_memorenable_nestloop, and only for the tab’s own session. It never changes the server’s configuration. - A script never runs by itself.
- pgjumbo does not create an index from a tip. To try an index without building it, use What if.