

Limits
This page collects pgjumbo’s numbers: the limits it keeps to, the sizes and speeds it was measured at, and what you see when you go past them. The page that owns each topic explains its controls; this one says how far they go.
Limits at a glance
Section titled “Limits at a glance”These limits are fixed, unless the last column names a setting or a control that changes them.
| What | Limit | Change it |
|---|---|---|
| Rows a result reads | 100,000 rows. A plain SELECT stops there on the server, and Fetch more reads on; other statements that return rows count the rest without keeping it. See Large results. |
Rows per result (1,000 to 10,000,000) in SettingsResultsHow much a result keeps |
| Memory a result’s rows take | 200 MB. Rows past it go to a temporary file, up to ten times as much, then are counted, not kept. | Memory per result (16 to 4,096 MB), in the same place |
| A result shown as text | The first 10,000 rows | |
| A result shown on a map | 250,000 points | |
| A value in the cell viewer | Its first megabyte | |
| The Messages tab | The last 1,000 entries of a run | |
| A data tab | Starts with the first 1,000 rows | Rows to fetch in the data bar |
A .sql file |
16 MiB | |
| A tab’s draft | 16 MiB of SQL. A larger tab is not kept as a draft: save it to a file. | |
| Query history | The newest 10,000 runs per server. A script larger than 1 MiB is not kept. | |
| Syntax errors as you type | Tabs of up to 1 MB of text, at most 100 marks | SettingsEditorWhile you typeUnderline syntax errors turns it off |
| Open Quickly | 50 objects from each database, 100 in all | |
| One action in the grid | 100,000 cells; one paste, 10,000 rows | |
| Exact sizes in Object Details | Up to 5,000 tables, then estimates | |
| A diagram | 300 tables | |
| Generate Scripts’ preview | Follows your ticks up to 5,000 objects, then waits for Preview | |
| Each statement of a report | 30 seconds | |
| Locks listed in Activity | The first 1,000 | |
| Connecting | 10 seconds | |
| A change from an object’s tab | Waits 5 seconds for each lock | Give up waiting for a lock after (1 to 300 s) in Settings › Safety › Changing a table in its tab, or Wait for a lock at most in the review for one save |
| The Notifications tab | The newest 10,000 notifications, 64 channels | |
| A psql tab | The last 10,000 lines | |
| The window | At least 960 × 600 pixels |
How the numbers were measured
Section titled “How the numbers were measured”The sizes and times below were measured in November 2026 on one computer: an 8-core desktop PC (AMD Ryzen 7 5800X, 32 GB of memory, a SATA SSD) running Windows 11 Pro, with PostgreSQL 18.6 in Docker on the same PC. With the server on the same computer there is no network in the times, except under A slow or bad network. Your times depend on your server, your network and your data: read them as a scale, not a promise.
- Times for reading from a server were taken with a test build of pgjumbo that runs slower than the app you install, so the app is at least as fast. The server’s share of each time is the same.
- The window’s own speed (typing, scrolling, many tabs) was measured on the same PC with made-up data in place of a server, so those numbers leave out the server and the network.
- Hours of use was measured with the installed app on separate Windows and Linux test machines.
- The test databases held a catalog of 200 schemas with 50,000 tables, 10,000 views, 20,000 functions and 5,000
partitions; a table of 10 million rows; a table of 1,600 columns; a 100 MB text value and a 256 MB
byteavalue; and every built-in type with its edge values andNULLs.
Connecting
Section titled “Connecting”PostgreSQL versions
Section titled “PostgreSQL versions”pgjumbo works with PostgreSQL 14 to 18, and with 12 and 13 on a best-effort basis. An older server is refused when you
connect, with the reason, for example This server is PostgreSQL 11.22. pgjumbo works with PostgreSQL 12 and later.
Servers built on PostgreSQL
Section titled “Servers built on PostgreSQL”Each server below was taken through the same tour: the Explorer from the server down with every object’s properties and script, a Query Tool, View Data, a table’s and a schema’s tabs, Statistics, Dependencies, Object Details, a diagram, Generate Scripts, the editor’s suggestions, every pane of Activity, the server tab’s Overview, Configuration, Authentication, Replication and Logs, the eight reports and the Health check.
| Server | What works |
|---|---|
| Citus 13.0 on PostgreSQL 17, with a distributed table | Everything on the tour. |
| TimescaleDB 2.31 on PostgreSQL 17, with a hypertable | Everything on the tour. |
| YugabyteDB 2026.1 (PostgreSQL 15) | Everything but replication. A single-node YugabyteDB makes its replication view wait about two minutes, so the Replication and slots report stops at its 30-second limit and says so, and the Overview shows without standbys and says why. The server tab’s Replication view says YugabyteDB does not have pg_current_wal_lsn() yet. |
| CockroachDB 25.2 | Refused when you connect: This server is CockroachDB … CockroachDB answers PostgreSQL’s protocol but has only part of PostgreSQL’s catalog and functions, so pgjumbo cannot browse or manage it. |
| Amazon RDS and Aurora | PostgreSQL to pgjumbo, with IAM sign-in and reader endpoints. See Amazon RDS and Aurora. |
Connection poolers
Section titled “Connection poolers”Every Query Tool tab has a session of its own, so a pooler in front of the server must give each client connection a server connection of its own too. This was measured with PgBouncer 1.24 in front of PostgreSQL 18.
| Pool mode | What happens |
|---|---|
session |
Everything works, read-only sessions included, with two exceptions that come from the pooler. PostgreSQL refuses to rename or copy a database while the pooler keeps a connection to it (database "…" is being accessed by other users). A connection pgjumbo closed stays in the server’s Activity, because the pooler keeps it for its next client. |
transaction |
Refused when you connect: This server is reached through a connection pooler in transaction mode (PgBouncer’s pool_mode = transaction). pgjumbo needs a session of its own for each tab: there its settings (read-only, a Query Tool’s SET, temporary tables, LISTEN) would not hold, and could reach the pooler’s other clients. Connect through the pooler’s session-mode port, or to PostgreSQL directly. |
Encryption and sign-in
Section titled “Encryption and sign-in”Each case below connects, or fails with the reason in its message. The messages come from libpq and PostgreSQL.
| What was tried | Result |
|---|---|
A SCRAM password with SSL mode disable, allow, prefer and require |
Connects; encrypted from prefer on. |
md5 and trust |
Connect. |
| A wrong password, or none | password authentication failed, and the password prompt. |
| A role the server lets in only over TLS, connecting without it | pg_hba.conf rejects connection … no encryption |
verify-ca and verify-full with the authority that signed the server’s certificate |
Connect. verify-full works with a host name and with an IP address, when the certificate names it. |
verify-ca and verify-full with another authority |
certificate verify failed, with the usual causes named. |
| An expired server certificate | Refused by verify-ca and verify-full. require connects, because it does not check the certificate. |
| A certificate made out to another host | verify-full refuses: server certificate for "…" does not match host name. verify-ca connects. |
| A client certificate from the server’s authority; none; one from another authority | Connects; connection requires a valid client certificate; tlsv1 alert unknown ca. |
| SSH keys: RSA 3072, RSA in PEM, ECDSA P-256 and P-384 with a passphrase, ed25519 | Each signs in and reaches the database. |
| The SSH agent | Signs in with the agent’s key. |
| An AWS IAM token the server refuses | PAM authentication failed, with the usual causes named: the IAM policy, the rds_iam role, and this computer’s clock. |
A role with few rights
Section titled “A role with few rights”A role with LOGIN and nothing else (no superuser, no pg_monitor, pg_read_all_settings or pg_read_all_stats)
gets through 85 of the tour’s 90 steps. Where it may not read something, pgjumbo says so instead of failing the whole
view.
| Where | What the role sees |
|---|---|
| A Query Tool | PostgreSQL’s own answers: row-level security leaves SELECT 0, and a table it may not read says permission denied for table …. |
| Activity | Other users’ sessions with their user and process id only. PostgreSQL hides their query and state from such a role. |
| Logs, Top queries | What the role may not read, such as Listing the log files needs a superuser, or a member of pg_monitor. |
A database where pg_proc is closed to it |
The schema opens with its folders uncounted. Functions, procedures, Dependencies, Generate Scripts and suggestions say permission denied for table pg_proc; tables, views, their tabs, View Data and the Query Tool work. |
| A database it may not connect to | Listed. Opening it says permission denied for database … no CONNECT privilege, and the server stays connected. |
Encodings and session settings
Section titled “Encodings and session settings”| What was tried | Result |
|---|---|
A role with unusual settings: DateStyle German, IntervalStyle postgres_verbose, TimeZone +14:00, bytea_output escape, standard_conforming_strings off, a search_path of "weird $chema", extra_float_digits -15 |
Everything works as with the defaults, and values show as psql shows them, such as 29.03.2026 14:59:59 +14 and @ 1 day 2 hours 3.5 secs. |
Scripts with standard_conforming_strings off |
Text with backslashes and quotes is written as E'…' and makes the same objects again. |
| A LATIN1 database | Everything works; Größe, café and Maß show as they should. A character LATIN1 does not have, such as €, is refused by the server in its own words. The database’s CREATE script makes a LATIN1 database again. |
| A SQL_ASCII database holding bytes that are not UTF-8 | Everything works; such a byte shows as �, in names and in values. A row whose key holds one cannot be edited, and pgjumbo says so. |
| ICU | ICU collations, nondeterministic ones too, and a database whose default collation is ICU’s are scripted with their provider and locale, and come back the same. |
The Explorer
Section titled “The Explorer”The catalog of 50,000 tables, read from the server:
| What | Size | Time |
|---|---|---|
| Open a Tables folder | 40,000 tables | 0.7 s |
| Open a Views folder | 5,000 views | 90 ms |
| Open a Functions folder | 20,000 functions | 0.4 s |
| Open a Partitions folder | 5,000 partitions | 160 ms |
| Object Details of a Tables folder | 40,000 tables | 2.4 s |
| Open Quickly finds a name | Among 60,000 tables, views and other relations | 70 ms |
| The editor’s suggestions read a database’s names | 60,000 relations and 10,000 function names | 0.4 s, in the background |
Drawing is separate from reading. The window opens a folder of 50,000 tables in about a quarter of a second and scrolls it at 60 frames a second, as it draws only the rows you can see.
Large catalogs
Section titled “Large catalogs”Object Details works out exact sizes for a Tables folder of up to 5,000 tables,
and for a database’s Schemas folder while the whole database has up to 5,000 tables. An exact size reads the files
of each table, its TOAST and its indexes: for 40,000 tables that took the server 2 to 5 seconds on its own, and 11 to 16
seconds for a database of 55,000. Past 5,000 tables, the Size column shows the catalog’s estimate instead, dimmed
and written with a ~, such as ~16 kB: the pages each table had at its last VACUUM, ANALYZE or CREATE INDEX.
Point at one for About 16 kB, from the pages the catalog counted at the last VACUUM or ANALYZE.
The tools that read a whole database or schema, on a database of 52,000 objects whose largest schema holds 27,000:
| Tool | Time | Past the edge |
|---|---|---|
| A diagram of the largest schema | 50 ms | It draws the first 300 tables by name and says the first 300 shown. |
| Compare Schema… of the largest schema against an empty one, so every object is new | 41 s (1.8 s for a schema of 2,300 objects) | The schema’s tree stays usable meanwhile and reads in 0.3 s. Compare says Comparing… and shows no progress. |
| Generate Scripts…: the dialog’s list | 1.8 s | |
| Generate Scripts… of every object in the database | 19 s, 11 MB of SQL (1.5 s for a database of 4,400 objects) | About 0.3 ms an object, most of it the server’s work. The dialog says Generating… and shows no progress. Past 5,000 ticked objects the preview waits for Preview. |
| Reports: Disk usage by table, Index usage, Table health | 3.8 s, 0.4 s, 0.2 s | Each statement of a report stops after 30 seconds and says so. |
| Health check | 1.3 s |
The Query Tool
Section titled “The Query Tool”Scripts
Section titled “Scripts”| What | Size | Time |
|---|---|---|
A script of INSERTs with Auto-commit on |
10,000 statements | 30 s, as long as psql takes |
A script of SELECTs |
1,000 statements and results | 0.6 s |
| One statement | 1 MB of SQL | 75 ms |
| Notices from one statement | 10,000 | 0.1 s; every one arrives |
With Auto-commit on, the server commits each INSERT on its own, and that is most of the time: the same script in
one transaction took under 6 seconds.
The Messages tab shows the last 1,000 entries of a run. Above them, a line says how many it leaves out, for example The first 9,001 of 10,001 messages are not shown; these are the last 1,000. A statement that failed is always among those shown, because a script stops there.
pgjumbo’s own work on your SQL takes little time next to the server’s:
| What | Size | Time |
|---|---|---|
| Finding the statements of a script | 10,000 statements | 6 ms; 62 ms when they are written without semicolons, one per line |
| The check for destructive statements on Production | The same script | 13 ms |
| Checking the syntax | 1,000 statements | 2 ms |
| Reading an Explain plan | 200 joins deep | 1.5 ms |
| A result as text | 10,000 rows of 10 columns | 56 ms |
Results
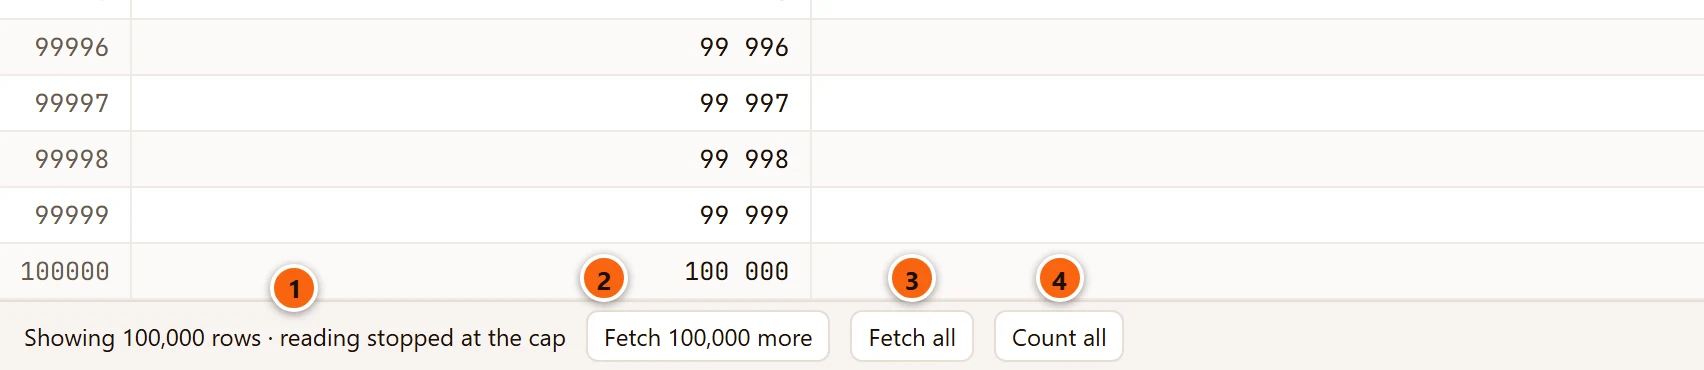
Section titled “Results”pgjumbo keeps a result’s rows in its engine, not in the window, within two limits: Rows per result (100,000 unless
you change it) and Memory per result (200 MB). A plain SELECT stops on the server at the row limit, and a line
under the grid offers to read on:
- 1
Showing 100,000 rows · reading stopped at the cap: the result holds the first 100,000 rows, and the rest wait on the server. - 2 Fetch 100,000 more reads as many rows again.
- 3 Fetch all reads every row that is left.
- 4 Count all counts the rest without reading them.
Rows past Memory per result go to a temporary file of pgjumbo’s own, up to ten times the setting, and the grid, Copy and Export read them from there. To keep more, raise either limit in SettingsResultsHow much a result keeps and run the query again. See Large results.
| What | Result |
|---|---|
| Every row of a 10,000,000-row table, 2.2 GB as text, with the limits raised | All kept. The first rows show after 0.15 s, and all of them have arrived after 24 s. |
| A result of 1,000,000 rows in the grid | The first page shows in 80 ms, and the grid scrolls at 60 frames a second. |
| 1,600 columns | 150 ms |
| A 100 MB text value | The cell viewer shows its first megabyte, and its size line adds “showing the first megabyte”. |
Every built-in type, with edge values and NULLs |
Each value as psql shows it. |
To write more rows than a result keeps, choose All rows: runs the query again with COPY (read-only queries, CSV) in the Export dialog: it runs a read-only query again and writes every row as it arrives. See Save results to a file.
Stop a query
Section titled “Stop a query”Stop was pressed at 100 random moments while scripts ran. Each time the tab’s session was left in the right state, and the slowest stop took 19 ms from Stop to the end of the run. See Stop a query.
PostgreSQL acts on a cancel only between the messages it sends, so Stop cannot stop a statement that is still sending rows over a slow line: they keep coming. Close the tab instead; it ends the statement about 2 seconds later. The same goes for a server that has gone silent; see A slow or bad network.
When the server enforces statement_timeout or idle_in_transaction_session_timeout, Messages shows PostgreSQL’s
own message and the script stops. A transaction the server ends for being idle is rolled back by the server.
Auto-commit cannot be chosen while a transaction is open in Smart commit or Manual commit: it is greyed out in the toolbar’s Transaction menu and in the Query menu until you commit or roll back. See The Transaction menu.
When the connection drops
Section titled “When the connection drops”pgjumbo never opens a new connection for a tab behind your back, and never runs anything again by itself. When the server closes a tab’s connection during a run, Messages shows PostgreSQL’s message, and the tab says The server closed this tab’s connection; Messages say why. Reconnect opens a new one and runs nothing again. Anything sent to a closed connection is refused with This tab’s connection to the server is closed, so nothing was sent. Reconnect to open a new one.
| What happens on the server | What you see |
|---|---|
| An administrator ends the tab’s session | PostgreSQL’s FATAL in Messages. The tab offers Reconnect and opens no connection by itself. |
| The server restarts during a query | The run ends after about a second with the FATAL. The tab waits for you; the Explorer reads the tree again by itself. |
| The server process is killed, as by the system’s out-of-memory killer | The run ends in under a second with server closed the connection unexpectedly, and the tab offers Reconnect. The Explorer is back in about 2 seconds and says the database system is in recovery mode meanwhile. |
| The connection is reset in the middle of a result | Said in under 2 seconds. The statement before it ran once, and nothing runs until you click Reconnect. |
| An administrator ends pgjumbo’s own Explorer and Activity connections | They read again without a word, and the server is not marked failed. |
| The disk fills | could not extend file … No space left on device. The same tab goes on working, so you can free the space from it. |
| A standby is promoted under an open tab | Before: cannot execute CREATE TABLE in a read-only transaction. After: the Overview says primary, and the same tab writes without reconnecting. |
Reconnect opens a new session; whatever was not committed has been rolled back by the server. See When the session is lost.
Many sessions at once
Section titled “Many sessions at once”20 Query Tool tabs ran at once while the Explorer read the tree 20 times, Activity polled the server and an export ran. Everything was done in 0.15 s; the slowest run took 130 ms.
Each tab has its own connection, so tabs count towards the server’s max_connections and the role’s CONNECTION LIMIT.
At the limit, the next tab is refused in PostgreSQL’s words, such as too many connections for role "…", as a connection
error rather than a failed sign-in. The tabs already open go on, and once one closes, a new one can open.
Edit data and change tables
Section titled “Edit data and change tables”In a data tab or an editable result, one action covers at most 100,000 cells, and one paste at most 10,000 rows. See Edit data.
Review before Save was checked on a table of 10 million rows, 1 GB with its indexes: 22 changes, each run as Save runs it. Every claim held. The lock each statement took is the lock the review names, the table is written again exactly when the review says it rewrites it, and a change it calls instant took at most 2 ms.
| Change | As planned | The safer way |
|---|---|---|
Rename, add or drop a column; set or drop a default; drop NOT NULL |
1 to 2 ms, ACCESS EXCLUSIVE | |
A longer varchar, varchar to text, numeric(12,2) to numeric(14,2) |
1 to 2 ms, ACCESS EXCLUSIVE | |
| Add a column with a default that differs per row | 48 s, rewrites the table, ACCESS EXCLUSIVE | Steps to run by hand |
integer to bigint, numeric(12,2) to numeric(12,4) |
30 s, rewrites the table, ACCESS EXCLUSIVE | Steps to run by hand |
SET NOT NULL |
0.6 s reading every row, ACCESS EXCLUSIVE | 2 ms, then 0.5 s under SHARE UPDATE EXCLUSIVE, then 1 ms |
| A check constraint | 0.7 s reading every row, ACCESS EXCLUSIVE | 1 ms, then 0.8 s under SHARE UPDATE EXCLUSIVE |
| A foreign key | 0.8 s reading every row, SHARE ROW EXCLUSIVE on both tables | 1 ms, then 0.8 s under SHARE UPDATE EXCLUSIVE |
| A unique constraint | 6.3 s building its index, ACCESS EXCLUSIVE | |
| An index | 4.2 s building it, SHARE | CONCURRENTLY (not timed) |
| Drop an index | 1 ms, ACCESS EXCLUSIVE | DROP INDEX CONCURRENTLY |
| Rename the table | 1 ms, ACCESS EXCLUSIVE | |
| Rename an index | 1 ms, no lock on the table | |
| A comment | 1 ms, SHARE UPDATE EXCLUSIVE |
These times are on a quiet table. On a busy one each statement first waits for its lock, at most as long as the review’s Wait for a lock at most allows, which starts at SettingsSafetyChanging a table in its tabGive up waiting for a lock after (see Wait for a lock). The steps to run by hand are in The way out of a rewrite, and the safer ways in Safer ways.
| What | Size | Result |
|---|---|---|
| A table exported to CSV with Import/Export Data… | 1,000,000 rows | 2.7 s, a 213 MB file. The rows go straight to the file and are not kept in memory. |
| A result saved to CSV or JSON from the rows pgjumbo holds | 100,000 rows of 10 columns | 60 ms to CSV, 110 ms to JSON |
| A CSV file imported, then cancelled after a second | 512 MB | Stopped within 30 ms; no row added. |
| A CSV file previewed for Import File into New Table… | 3,000 files of random bytes | None made it fail without a reason: bad input gives the line and what is wrong with it. |
pgjumbo writes a file it saves (a .sql file, an export, a backup) under another name first and gives it the name you
chose only when it is complete. A full disk or a failed save leaves your file as it was, and pgjumbo says your system’s
reason. When another program holds the file, such as an antivirus or the search indexer, pgjumbo waits up to a second
for it, then says your system’s reason; no half-written file stays behind.
Encodings: a .sql file opens when it is UTF-8 or UTF-16 with a byte order mark (see
What pgjumbo can open). Import and export of table data take
any encoding the server knows (see Options), and a saved result UTF8, LATIN1 or
WIN1252 (see Encodings).
Backup, restore and copy
Section titled “Backup, restore and copy”A database of 1,000,000 rows of about 1 KB each, 1.1 GB on disk, with PostgreSQL 18’s client programs:
| What | Result |
|---|---|
| Back up in the custom format | 48 s, a 561 MB archive |
| Cancel once 4 MB were written | Stopped in 0.2 s; nothing left behind |
| Restore into an empty database, in one transaction | 85 s, every row back |
| Copy Database… on the same server | 85 s, every row there |
Times grow with the data. A backup is written beside the file you chose, under its name with .partial added (such as
shop.dump.partial for shop.dump), and takes the name you chose only when it is complete. When the backup is
cancelled or fails, the partial file is removed, and an earlier backup of the same name stays as it was. Cancel job
stops pg_dump, pg_restore and psql wherever they are, even when the server has gone silent. See
Back up and restore.
A slow or bad network
Section titled “A slow or bad network”These were measured through a proxy that slows, cuts and breaks the connection on purpose, in front of PostgreSQL 18.
| Fault | What happens |
|---|---|
| 300 ms each way, with 50 ms of jitter | The tree and a new tab are ready in 2.4 s, and two statements run in 0.6 s. |
| Data in slices of about 12 bytes, as a lossy line hands it over | Every row arrives, in order. |
| 56 kbit/s, a 2 MB result | Stop cannot stop rows already on their way, as PostgreSQL acts on a cancel only between messages, so the result keeps coming in. Closing the tab ends it 2 seconds later. |
| The connection is reset in the middle of a result | Said in under 2 seconds (server closed the connection unexpectedly). The tab offers Reconnect; the Explorer reconnects by itself. |
| The server goes silent without closing the connection | Stop says timeout expired after 10 seconds. Closing the tab ends the statement 2 seconds later. A request from the Explorer waits until you disconnect the server, which lets it go 2 seconds later. |
| A host name that does not resolve | Said at once, with the name. |
| Nothing answers when connecting | Timed out after 10 s. Is the host reachable, and is the port right? |
Once you disconnect a server, pgjumbo opens no connection to it again until you connect it.
Notifications and the PSQL Tool
Section titled “Notifications and the PSQL Tool”| What | Result |
|---|---|
| 1,000,000 notifications sent in one commit | The last arrives 0.7 s after the commit, all of them in order. |
| 10,000 notifications a second for 3 seconds | The tab keeps up: the last has arrived when the last is sent. |
psql printing 1,000,000 lines (9 MB) while its tab is resized 400 times |
All of it arrives, nothing hangs, and the prompt comes back at once. On Windows it took about 4 minutes. |
On Windows, psql’s output reaches the tab through the system’s console a line at a time, about 4,000 lines a second.
macOS and Linux pass it much faster. For a long result in a psql tab, \o to a file or the Query Tool is the faster
way. See PSQL Tool and Notifications.
This computer
Section titled “This computer”| What goes wrong | What pgjumbo does |
|---|---|
Its data file, app.db, is damaged |
It starts. The damaged file is kept as app.db.damaged- followed by a number, a new one is started, and the window says pgjumbo’s data file could not be read, so it was kept as … and a new one was started: servers, settings, query history and drafts start empty. Saved passwords are still in the credential store, and a server list exported earlier comes back with File › Import Servers…. |
app.db is read-only, or another program holds it |
It starts with this session in memory and says why. Nothing you change in this session is kept. |
| The credential store refuses, because it is locked or you denied its prompt | Saving a server with Save password in … ticked says This computer’s credential store would not save the password (…). Untick “Save password” and pgjumbo will ask for it when connecting. Untick it and save: the server is saved without the password, and connecting asks for it. A server without a saved password saves as usual. |
| The network is off when pgjumbo starts | It starts: nothing at start needs the network. |
When pgjumbo is killed
Section titled “When pgjumbo is killed”| pgjumbo is killed while | Afterwards |
|---|---|
| It saves drafts | app.db is whole, and every tab comes back with its SQL, at most one save behind. Drafts are saved half a second after each change. |
| An object’s Save runs, or its connection is cut while it waits for a lock | Nothing of the change stays, not even a column already added: PostgreSQL rolls the whole transaction back. |
| A backup writes its file | The file still ends in .partial: it never takes the name you chose unfinished. |
pg_dump, pg_restore or psql runs for a job |
On Windows and Linux the program ends with pgjumbo. On macOS it runs on to its end, as macOS does not end a program with the one that started it. |
The password file a backup, a restore or a psql tab reads is kept in a folder inside pgjumbo’s data folder, which each start empties, so a crash leaves no password behind. See Where pgjumbo keeps your data.
Hours of use
Section titled “Hours of use”The installed app ran for 2 and for 4 hours on a Windows and a Linux test machine: one server’s Activity open, five Query Tool tabs each running a query every minute, the Explorer refreshed every minute and the Assistant’s pane open.
| What | Result |
|---|---|
| Memory, after a warm-up of 15 to 30 minutes | Stays level: it grew less than 4 % in every run. |
| Handles and open files | Stay level. |
| After quitting | Nothing is left running: no psql, pg_dump or pg_restore, and no Claude Code. |
The window
Section titled “The window”| What | Result |
|---|---|
| 200 tabs open | Switching between them never pauses longer than 50 ms. |
| 500 tabs opened and closed one after another | The window’s memory ends where it started. |
| 10 MB pasted into the editor | 0.4 s, and you can type again at once. |
| Typing in an editor of 10 lines | Under 1 ms a key, 7 ms at worst. |
| Typing in an editor of 100,000 lines (6.5 MB) | 8 ms a key, 41 ms at worst. |
| Zooming in and out 50 times | The layout comes back as it was. |
| Each splitter dragged to both ends in the smallest window | Nothing overlaps, and the window never scrolls. |
The window is at least 960 × 600 pixels. At that size the middle keeps 360 pixels, and the side panes give way down to their own smallest widths. However many tabs are open, the tab in front scrolls into view in the tab strip, and the Open tabs button lists them all. See Tabs and Show, hide and resize the panes.