

Plans in production
A query you write on a test server already has a life in production. pgjumbo puts that life in a line above the statement: how often it has been called, its mean time, and where it ranks. It also remembers the plans it has seen for the statement, says when the plan changed or the statement got slower, and shows the two plans side by side.
The line above a statement
Section titled “The line above a statement”Rest the cursor in a SELECT, INSERT, UPDATE, DELETE or MERGE for a moment. When pgjumbo has something to say
about it, a line appears above its first line.


- 1 In production when the numbers come from a server tagged Production, On this server when they come from the tab’s own server.
- 2 How often the statement has been called, its mean time, and its rank by total time among the statements
of that database, with the server’s name:
1.2 M calls · mean 45 ms · #3 by total time on prod-eu-1. - 3 What its baseline adds, in red: how many times slower the last run was than its fastest earlier one, or that its plan changed, and since when.
- 4 Compare plans opens the Plans tab.
Hover the line to read where the numbers come from: the server and the database, that they count from the last reset
of pg_stat_statements, and how many statements the rank is among, as “#3 of 412 statements by total time”. Hover the
red part to read what changed: “Seq Scan on orders where it was Index Scan using orders_status_idx on orders.”, or
“The same plan, slower than its fastest earlier run.”
The line needs the tab connected and not running anything. It goes when you edit the statement and comes back when the cursor rests again.
Where the numbers come from
Section titled “Where the numbers come from”- pgjumbo reads
pg_stat_statementson every connected server tagged Production, in the database with the same name as the tab’s. Among those that have run the statement, the line shows the one that called it most. - When no Production server has run it, the tab’s own server is read instead, and the line starts On this server.
- The statement is matched by PostgreSQL’s fingerprint of it, which leaves its values and its spacing aside. So
WHERE status = 'paid'typed on a test server finds the same query run in production with any status. pgjumbo fingerprints the 1,000 statements with the most total time on each server; one that ranks below them is not found. - The calls and the time are summed over the roles that ran the statement, since the server’s statistics were last reset.
- Each server is read on a connection of pgjumbo’s own, never on the tab’s session, and a reading is used for a minute before pgjumbo asks again.
The whole list, with every statement and its numbers, is the Top queries report: see Reports.
When there is no line
Section titled “When there is no line”Nothing shows when no connected server can be read (it does not have pg_stat_statements in that database, or your
role may not read it), or none has run the statement, and no baseline says anything yet. A statement PostgreSQL does
not plan, such as CREATE TABLE, never gets one.
The line is one of the lines pgjumbo writes in the editor before you run. SettingsSafetyBefore a writeShow what a write or a table change will do turns it off, with the others; see Before a statement runs for those, and Settings for the setting.
A statement’s baseline
Section titled “A statement’s baseline”pgjumbo keeps, on this computer, the shape of each plan it sees for a statement. A shape is the plan’s steps in order, each with the table or index it reads and how it joins or groups. It holds no costs, no rows, no SQL and no values, so the same plan always reads the same.
Plans are kept from two places:
- The Explain tab. Every plan it shows is kept. After Explain Analyze, its execution time is kept with it.
- Short runs. A run of up to 16 statements on a server with
pg_stat_statementskeeps each statement’s plan and how long it took, while SettingsRunning queriesWhile a script runsSay what each statement read and wrote is on. Footprint and tips says what else such a run reads.
A plain SELECT is the exception among runs: its plan is kept from a run only once pgjumbo already holds one plan of
it. Explain it once, and from then on each short run of it adds its plan, so a plan that flips is noticed. A SELECT
you never explained costs the server no extra question.
Plans are kept for each server and database apart, the last 50 of a statement, matched by the same fingerprint as the line.
The baseline is the fastest earlier run among them (the oldest plan, when none has a time). Against it, the line says one of two things:
| The line says | When |
|---|---|
3× slower than its baseline on Tuesday |
The latest run took at least twice the baseline’s time. |
its plan changed since 3 Nov |
The plan’s shape differs from the baseline’s, and it is not twice as slow. |
A day within the last week is written as its weekday, an older one as its date. With a baseline and no numbers from
pg_stat_statements, the line starts Its plan in place of In production. Nothing is said until two plans are
kept, nor while the plan is the same and less than twice as slow.
Compare the two plans
Section titled “Compare the two plans”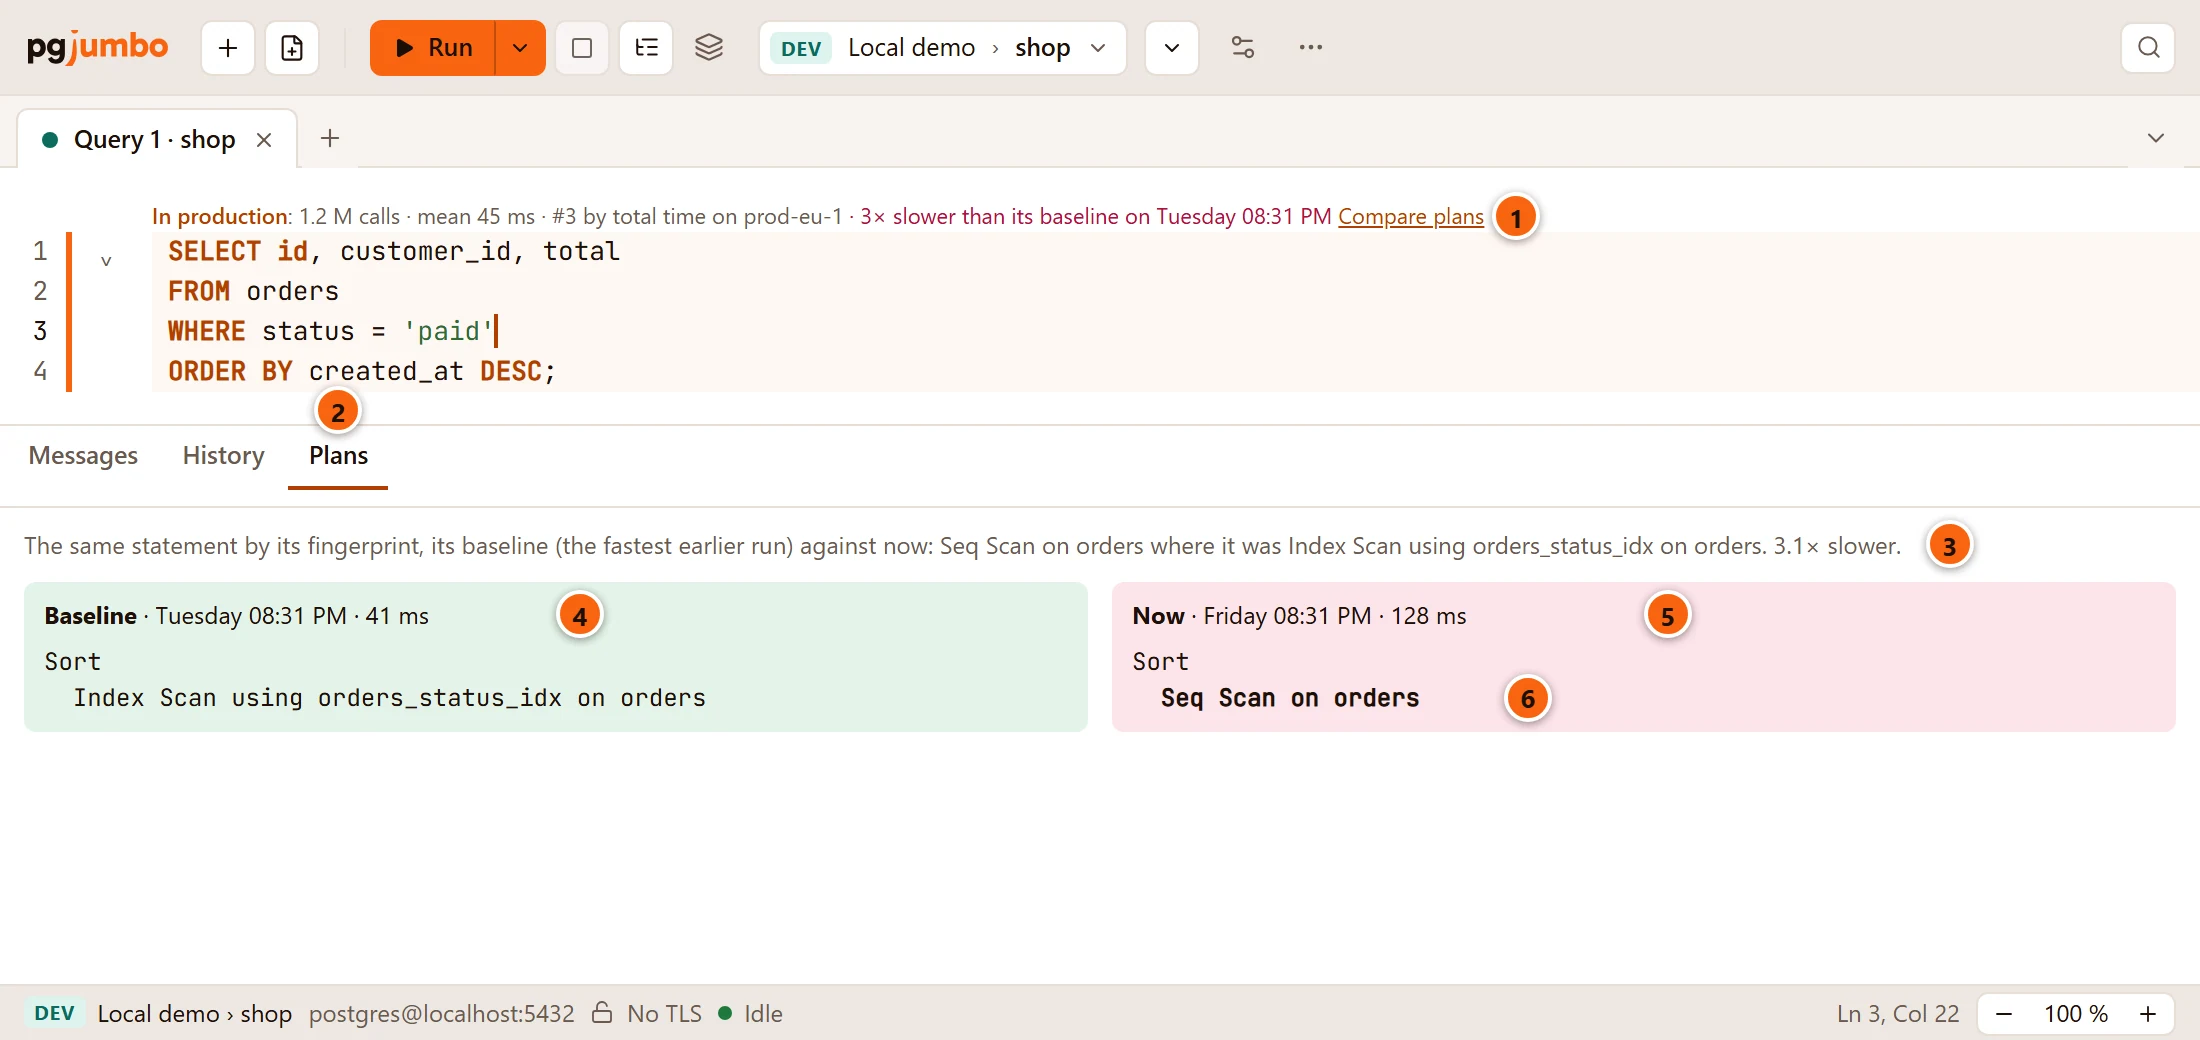
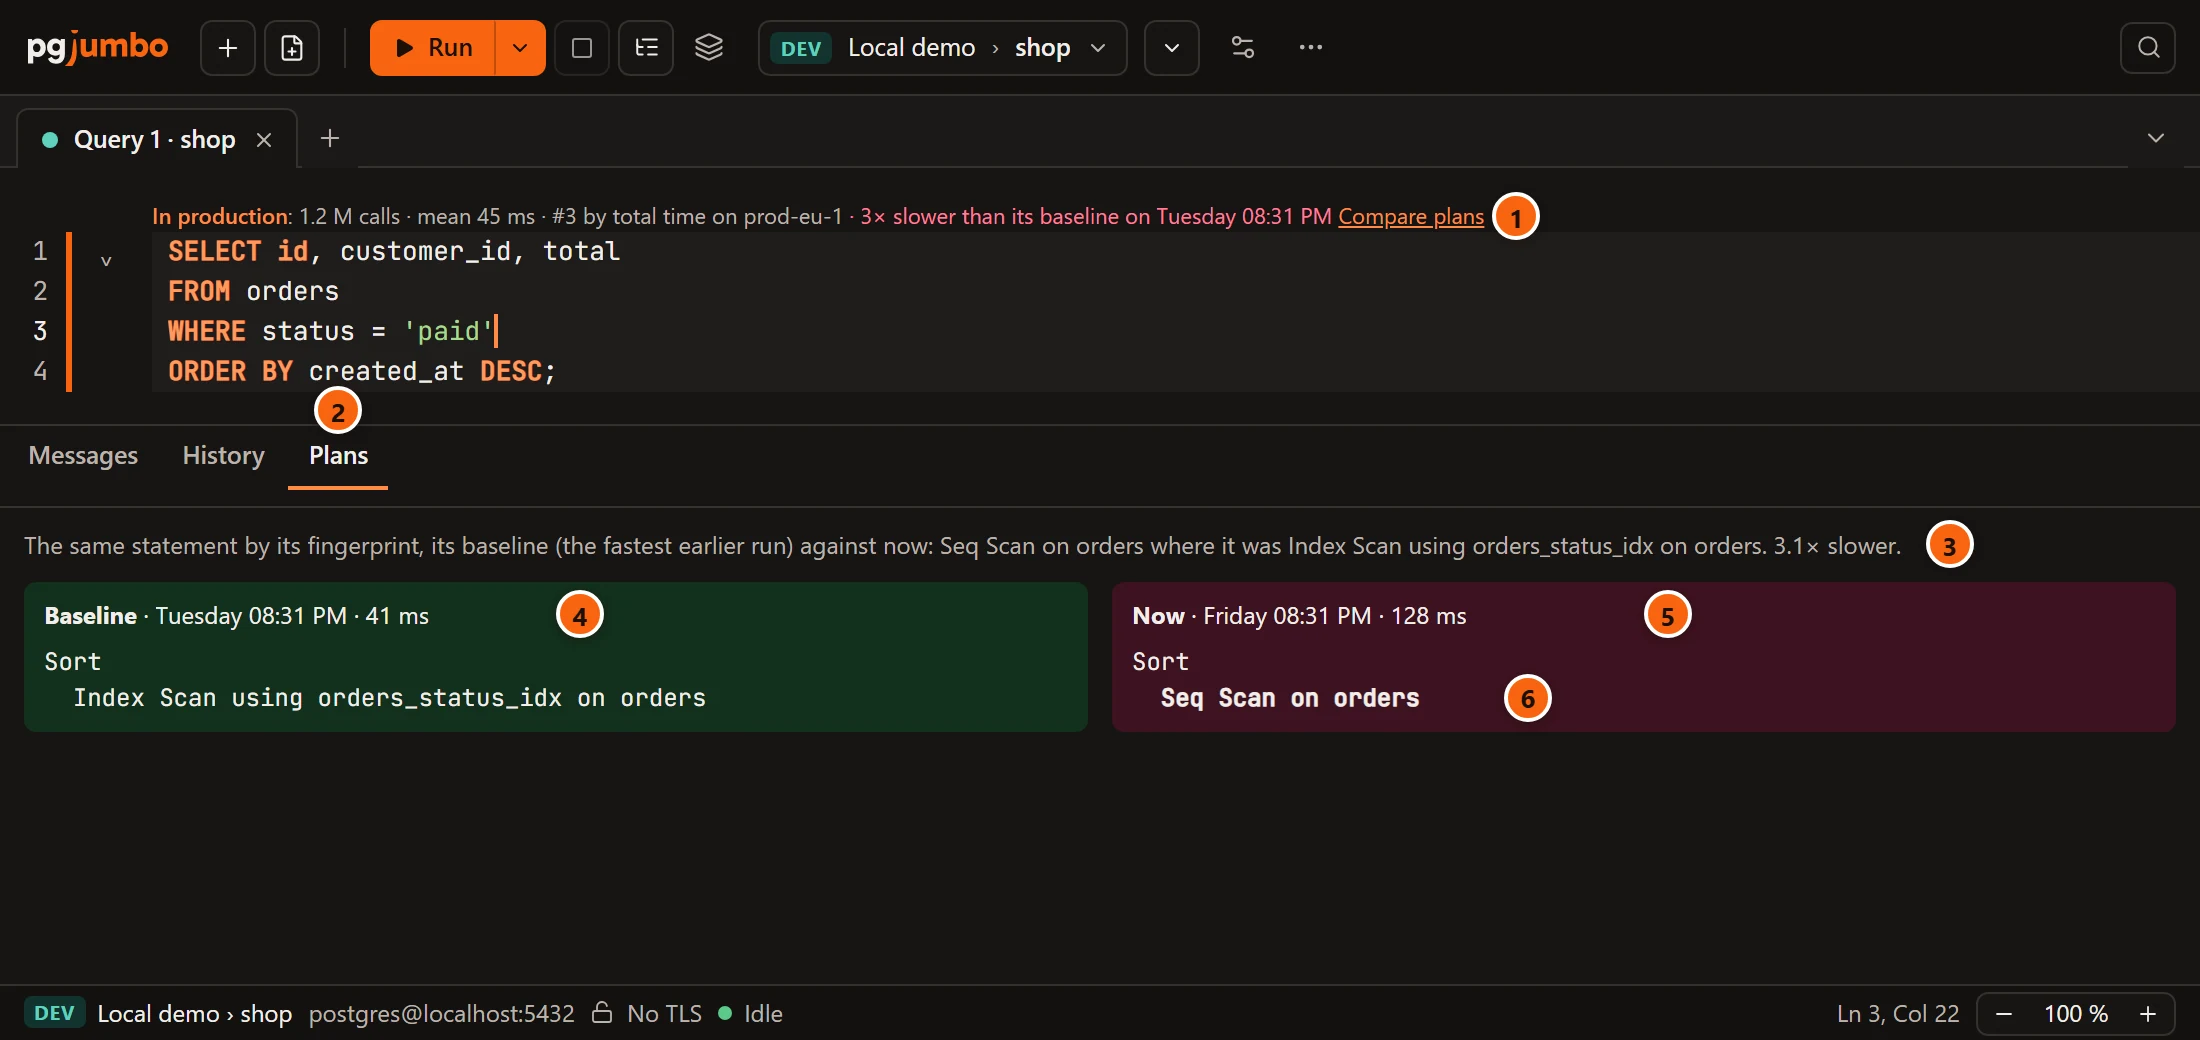
- 1 Compare plans, at the end of the line above the statement.
- 2 The Plans tab opens beside the other result tabs, and stays there.
- 3 What is compared, and the difference in a sentence: the step as it is now, where it was what, and how many times slower the latest run was.
- 4 Baseline: when that plan was seen and how long the statement took, then its steps, one a line, indented under the step they feed.
- 5 Now: the latest plan, the same way.
- 6 The first step that changed is in bold.
The two sides show steps only. For the times and rows of each step as the statement runs today, use Explain Analyze; to try the index the old plan used, or a setting, use What if.
Plan flips for parameter values
Section titled “Plan flips for parameter values”A plan flip is one statement getting different plans for different values of a parameter. It happens when the parameter is compared with a column whose values are uneven: for a status most rows share, reading the whole table is cheapest; for a rare one, an index is. A query that is fast in your test with one value can be slow in production with another.
pgjumbo shows the flip where you give the values: in the Values for this query dialog that Run and Explain open for a statement with parameters. Parameters covers the dialog itself.
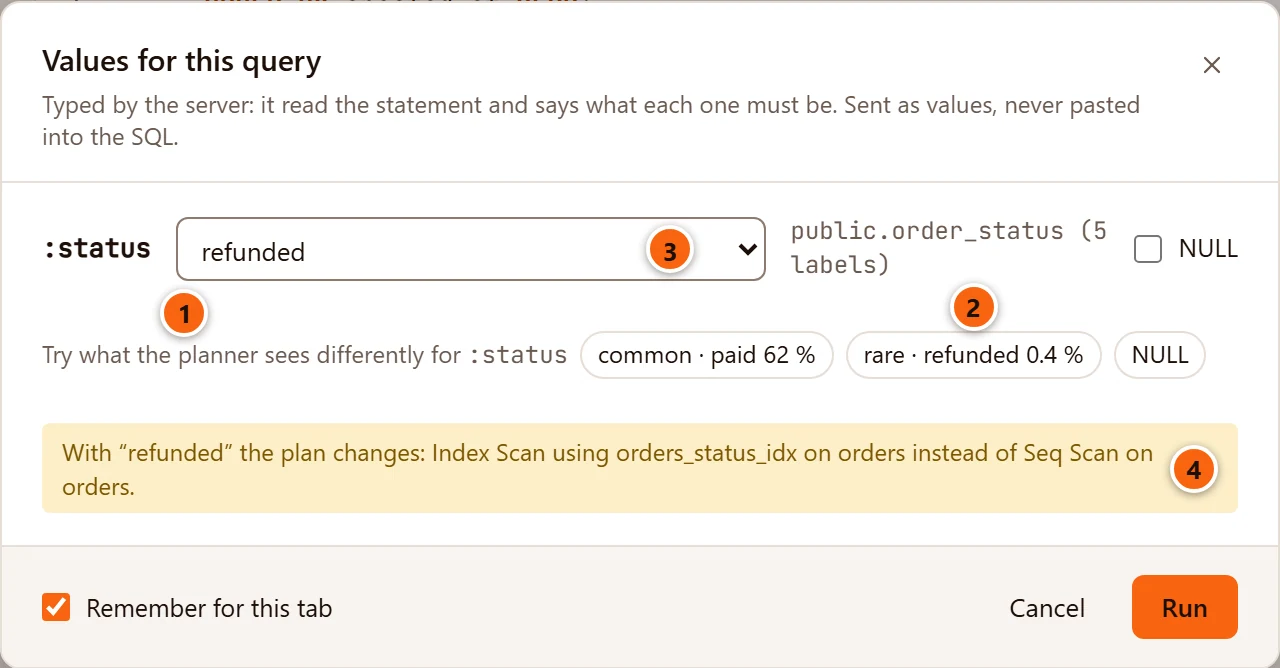
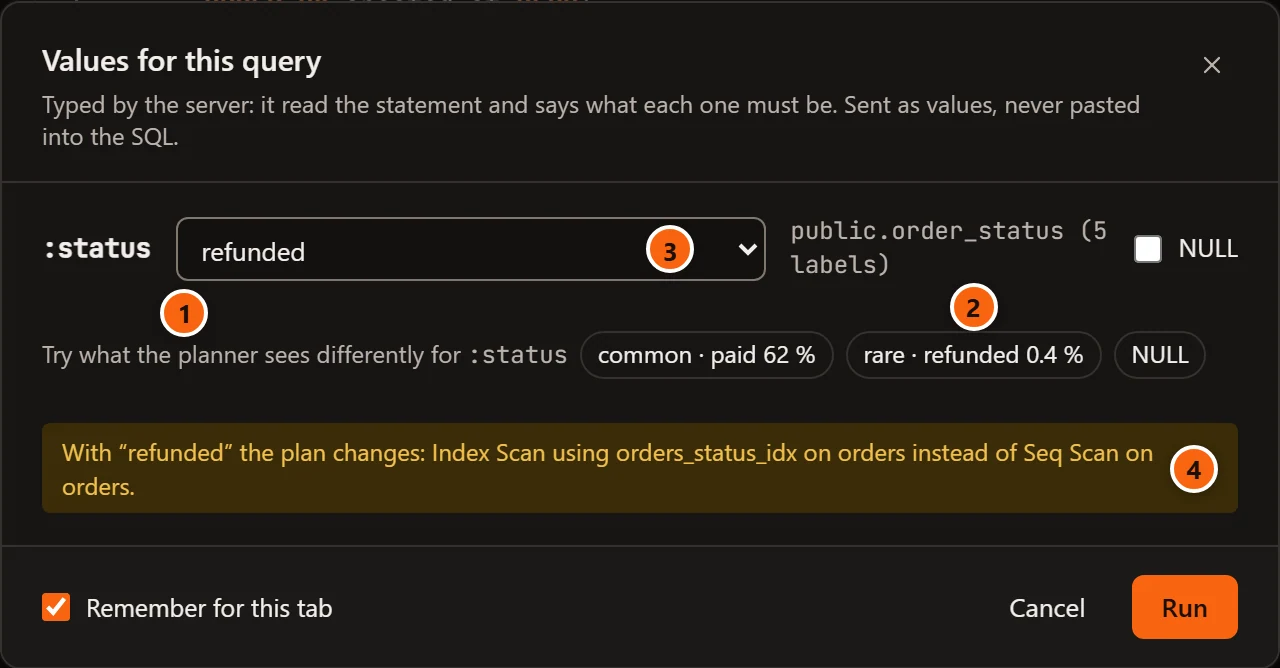
- 1 “Try what the planner sees differently for”, and the parameter’s name. The line shows only for a parameter worth trying.
- 2 The values to try, one chip each: the column’s most common value with the share of rows that hold it
(
common · paid 62 %), a rare one (rare · refunded 0.4 %) and NULL. - 3 Click a chip to put its value in the field. The NULL chip ticks the parameter’s NULL box.
- 4 When a value changes the plan: “With “refunded” the plan changes:”, then the step it uses instead of the common value’s. The line names the first value whose plan differs.
On PostgreSQL 16 or later a second line can follow: “With no value, as a prepared statement’s generic plan:”, and the step that differs. That is the plan a prepared statement may switch to, the one made without knowing the value. It shows only when it differs from the common value’s plan.
How pgjumbo finds this out:
- The column a parameter is compared with is read from the statement by PostgreSQL’s own parser.
- The common and the rare values come from the column’s statistics in
pg_stats. - Each plan is a plain
EXPLAINwith the value bound, on the tab’s session. Nothing runs. The other parameters are taken as you have typed them so far; an empty one takes its own column’s common value. The plans are asked for again when you pause typing.
Nothing is offered for a parameter that is not compared with a column, or for a column whose statistics list no common
values: its values are spread evenly, or the table has no statistics yet (ANALYZE gathers them). A rare value is
offered only when it is at least ten times rarer than the most common one. When the server refuses a value, hovering
its chip says why.