

Explain a query
Explain shows the plan PostgreSQL would use for a statement, from the planner’s estimates, without running it. Explain Analyze runs the statement, rolls it back, and shows the real time and rows of every step. Both open in the Explain tab of the Query Tool, beside Data Output and Messages. The plan is tied to your SQL: point at a step to see where it comes from, and read under the plan what each name in the statement resolves to.
Explain a statement
Section titled “Explain a statement”Put the cursor in the statement, or select it, then:
| To get | Toolbar | Menu | Mac | Windows and Linux |
|---|---|---|---|---|
| The plan with the planner’s estimates | Explain | QueryExplain | ⌘ E | F7 |
| The plan with real times and rows | More query actions (…) › Explain Analyze | QueryExplain Analyze | ⌥ ⌘ E | Shift+F7 |
The editor’s right-click menu has Explain and Explain Analyze too. The keys are the ones pgjumbo starts with; Change the shortcuts says how to give them others.
pgjumbo explains one statement: the selection if there is one, else the statement the cursor is in, or the one the cursor’s line ends or starts with. On a blank line, or on a comment line of its own, the cursor is in no statement: nothing is explained, and the result bar says “No statement at the cursor: put the cursor in one, or select what to run.” Run SQL says where pgjumbo takes one statement to end and the next to begin.
pgjumbo sends your statement to the server behind EXPLAIN (VERBOSE, FORMAT JSON), or
EXPLAIN (VERBOSE, FORMAT JSON, ANALYZE, BUFFERS) for Explain Analyze, on the tab’s own connection, so
the tab’s session applies: its search path, its role, its work_mem. There are no other
options. For SETTINGS, WAL or GENERIC_PLAN, type the EXPLAIN yourself and run it: its plan comes back as rows
in Data Output.
A statement with parameters (:name, $1) asks for their values first, in the Values for this query dialog,
whose button then reads Explain or Explain Analyze. The plan is the plan for those values. See
Parameters.
Explain is greyed out while the tab is not connected, while it runs something, and in a data tab. Stop in the toolbar (⌘ . (Ctrl+. on Windows and Linux)) cancels an Explain that takes too long, as it cancels a query.
While the plan is on its way, the result bar says Explaining… or Explain Analyze…, and the tab says “Asking the
planner…” or “Running the statement for its plan (it is rolled back)…”. The result bar then says Explain or
Explain Analyze and how long it took. The Explain tab keeps the last plan until you explain again; running the
script does not clear it.
What Explain Analyze changes
Section titled “What Explain Analyze changes”Explain Analyze really runs the statement, so it takes the time, the locks and the server’s resources the statement
takes, and its triggers fire. pgjumbo runs it inside BEGIN and ROLLBACK, so an INSERT, UPDATE or DELETE
leaves the data as it was. When the tab has a transaction open, pgjumbo uses a savepoint instead and rolls back only to
it, so your transaction stays as it was. Work that a rollback cannot undo still happens, for example values taken from
a sequence.
If the tab’s transaction has failed, Explain Analyze says “This tab’s transaction failed. Roll it back before explaining.” Roll back first (see Transactions).
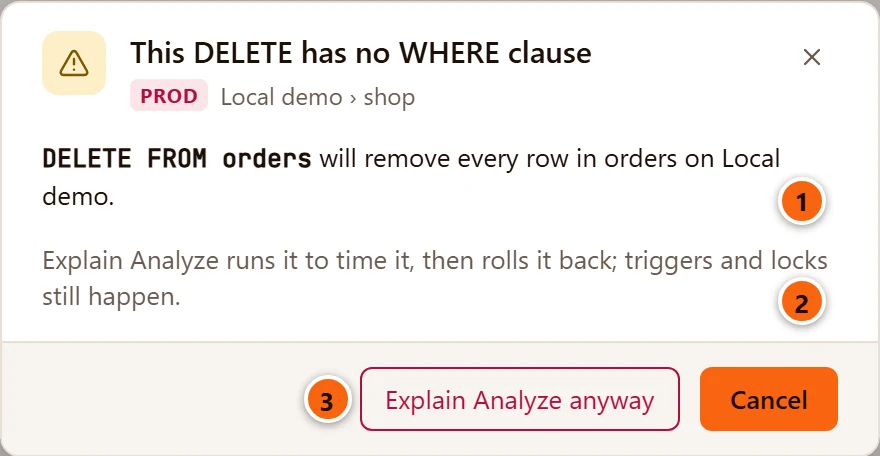
- 1 The statement, and what it will do on this server.
- 2 “Explain Analyze runs it to time it, then rolls it back; triggers and locks still happen.”
- 3 Explain Analyze anyway runs it for its plan. Cancel, which Enter and Esc choose, runs nothing: the result bar says “Nothing was run.”
Read the plan as a table
Section titled “Read the plan as a table”The Table view is where the Explain tab opens. Each step of the plan is a row, indented under the step it feeds.
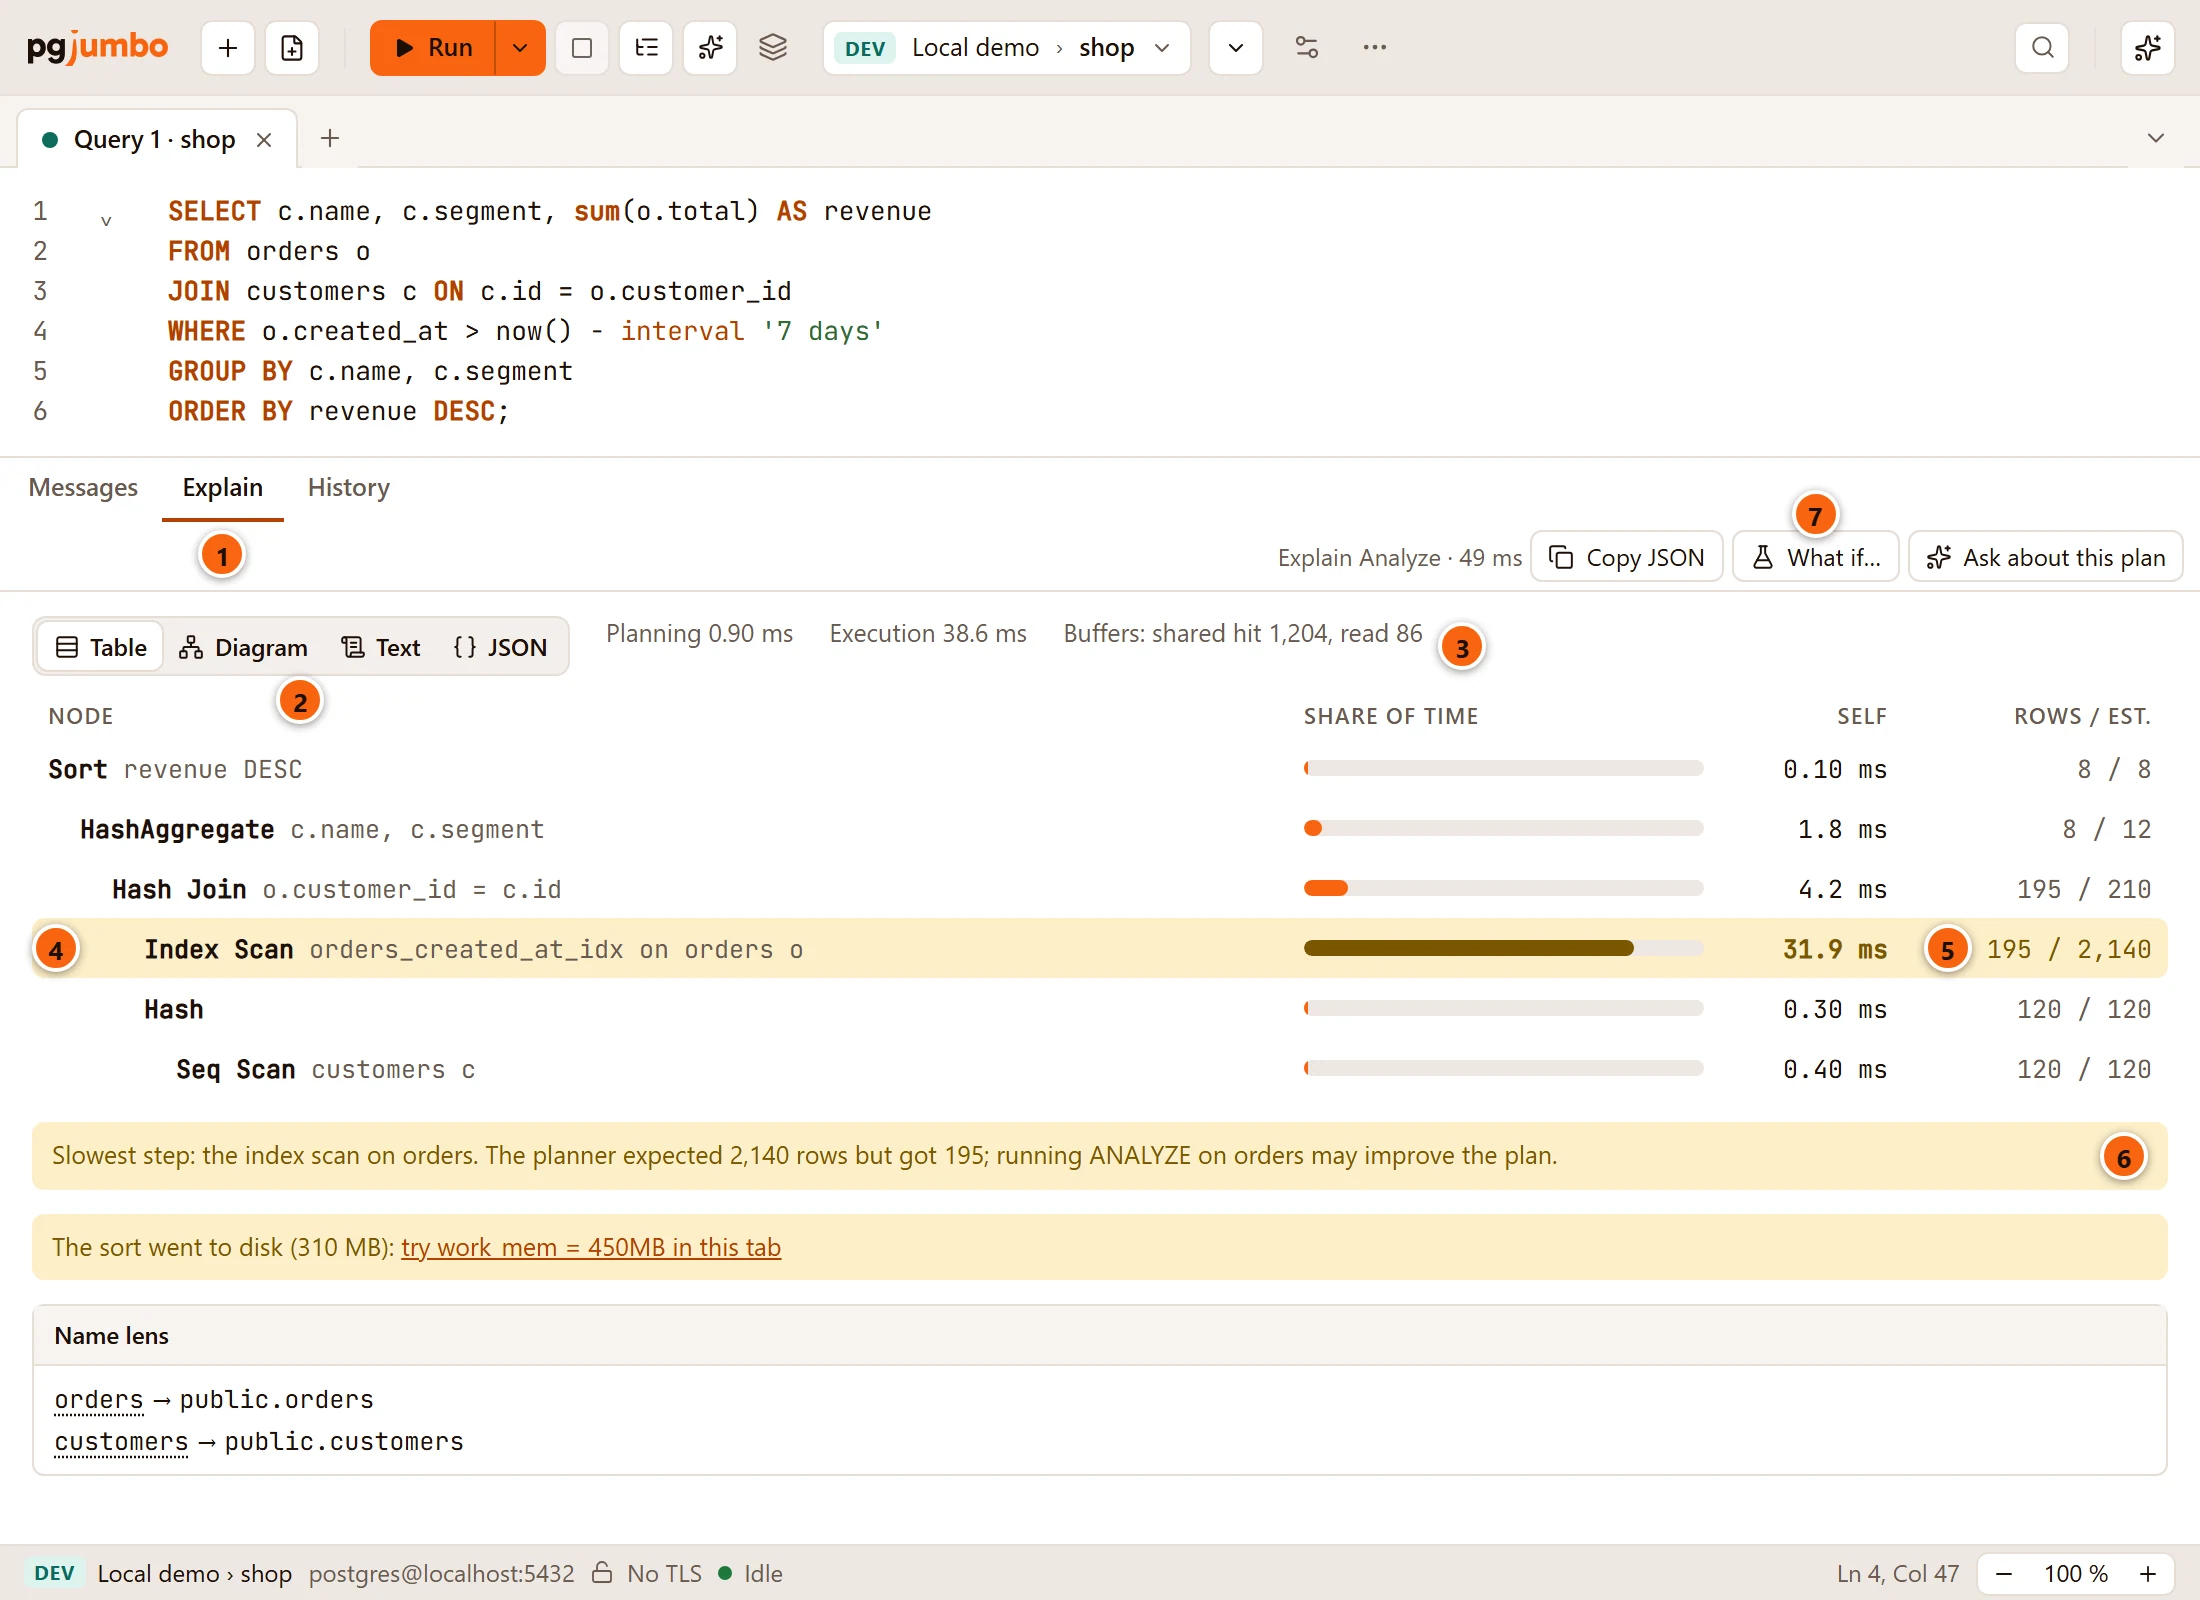
- 1 The Explain tab.
- 2 How to show the plan: Table, Diagram, Text or JSON. Each query tab keeps its choice.
- 3 For Explain Analyze, the plan’s planning time, its execution time and its shared buffers (
hitwere found in memory,readcame from disk or the operating system’s cache). - 4 The slowest step is highlighted: the one with the most time of its own (or, without Analyze, the most cost of its own).
- 5 Rows the step returned against the rows the planner expected. With Explain Analyze, pgjumbo marks the number in another colour when the two differ more than ten times either way (and one of them is at least 10): the table’s statistics may be out of date.
- 6 The hint names the slowest step and, where it can, says what to try.
- 7 The buttons for this plan. Copy JSON copies the plan as the server wrote it. What if… shows the same statement’s plan with an index that does not exist, or a setting changed: see What if. Ask about this plan, which shows only while the Assistant is turned on, puts the question “Why is this query slow, and what would make it faster? Use its plan.” in the Assistant’s box, for you to send; see SQL help in the editor.
Under the hint, an Explain Analyze plan can list tips to try, such as the larger work_mem in the picture.
Footprint and tips says what each tip is and what a click on it does. Under
them is the Name lens.
pgjumbo also keeps the shape of every plan this tab shows, on this computer, so that it can tell you later when the statement’s plan has changed: see Plans in production.
The table’s columns:
| Column | With Explain Analyze | With Explain |
|---|---|---|
| Node | The step as EXPLAIN names it (Hash Join, Index Scan, HashAggregate) and what it works on: a table and its alias, an index, a join condition, a sort key. Hover over it to read all of it, with its filter, the rows its filter removed and its loops. |
The same. |
| Share of time / Share of cost | A bar for the step’s own time as a share of the whole plan. | A bar for its own cost as a share of the whole plan. |
| Self / Cost | The step’s own time over all its loops: its total time less the time of the steps under it. | Its own cost: its total cost less that of the steps under it. |
| Rows / est. / Rows (est.) | Rows returned, over all its loops, against the estimate. | The rows the planner expects. |
The hint under the table says one of these:
- “Slowest step: the index scan on orders, 82 % of the time.” (of the cost, without Analyze)
- When the slowest step was badly estimated: “Slowest step: the index scan on orders. The planner expected 2,140 rows but got 195; running ANALYZE on orders may improve the plan.”
- With Explain Analyze, when the slowest step reads a table and its filter threw away at least 1,000 rows and more than ten times the rows it kept: “Slowest step: the seq scan on orders (82 % of the time). Its filter threw away 98,000 rows to keep 120; an index on the filtered columns may help.”
Copy JSON in the result bar copies the plan as the server wrote it, for tools that draw plans. In the Text view the button is Copy text and copies the plan as text. The result bar then says “Copied the plan”. The bar’s buttons drop their words in a narrow results pane.
In a results pane too short for the whole plan, the table keeps its headings and its first four steps and scrolls for the rest; the pane scrolls for what is under the table.
Without Analyze
Section titled “Without Analyze”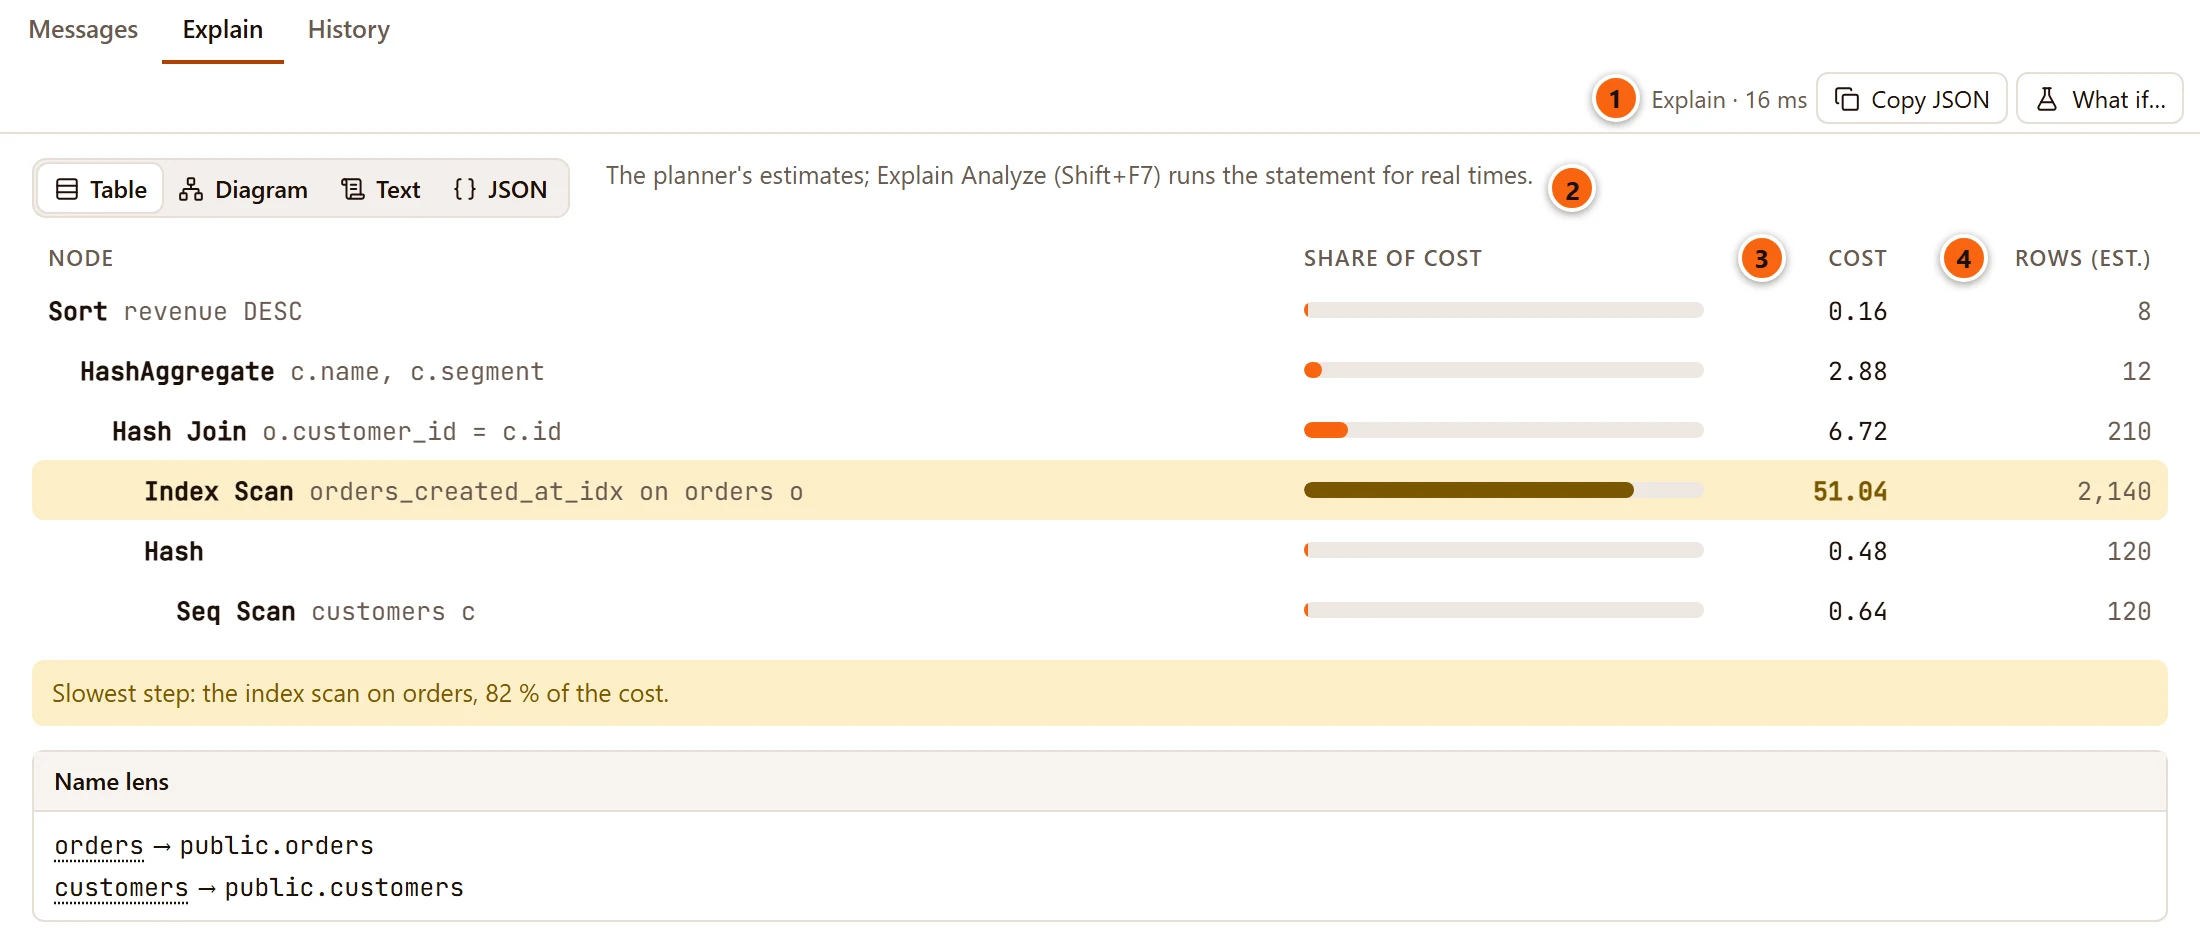
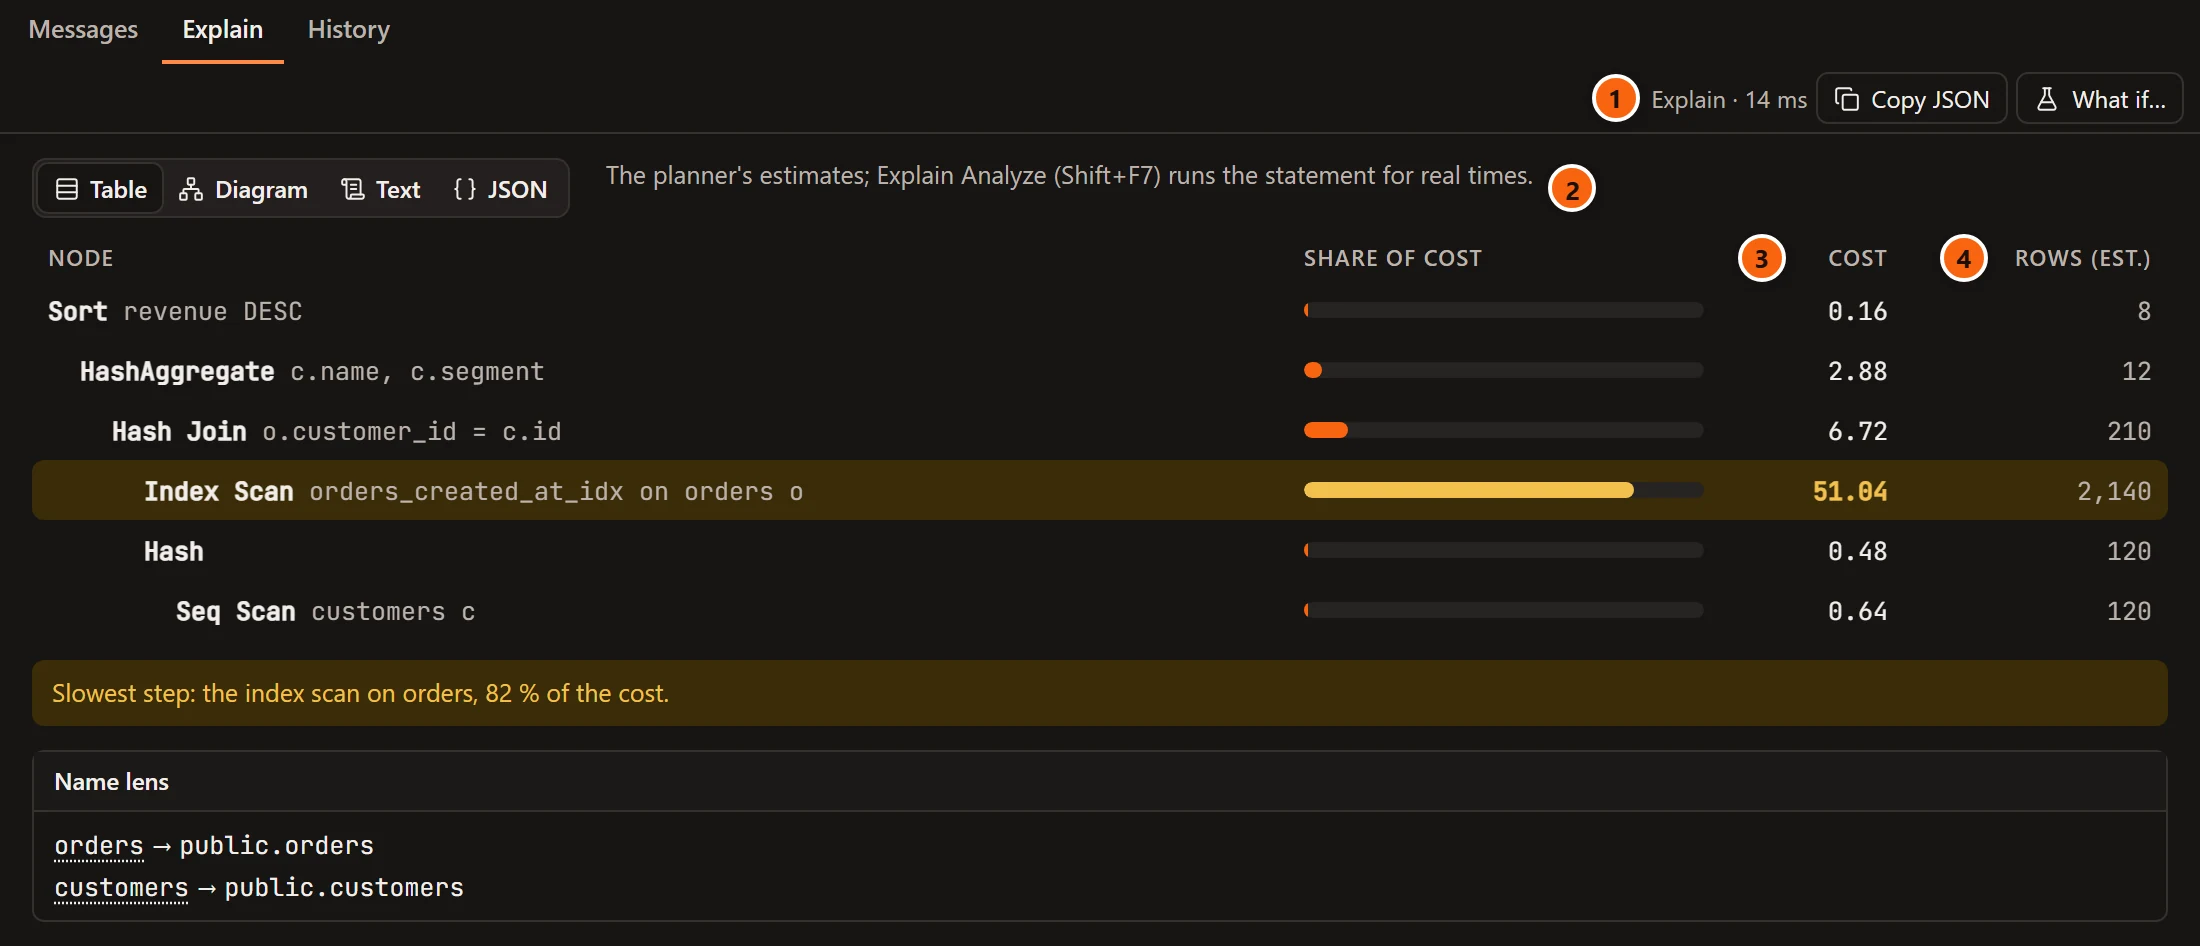
- 1 The result bar says Explain and the time it took.
- 2 “The planner’s estimates; Explain Analyze (Shift+F7) runs the statement for real times.” On a Mac it names ⌥⌘E, and after you change the shortcut, yours.
- 3 Cost is each step’s own cost, in the planner’s units.
- 4 Rows (est.) is the number of rows the planner expects. Nothing is marked as badly estimated, and no tips are offered, since nothing ran.
Read the plan as a diagram
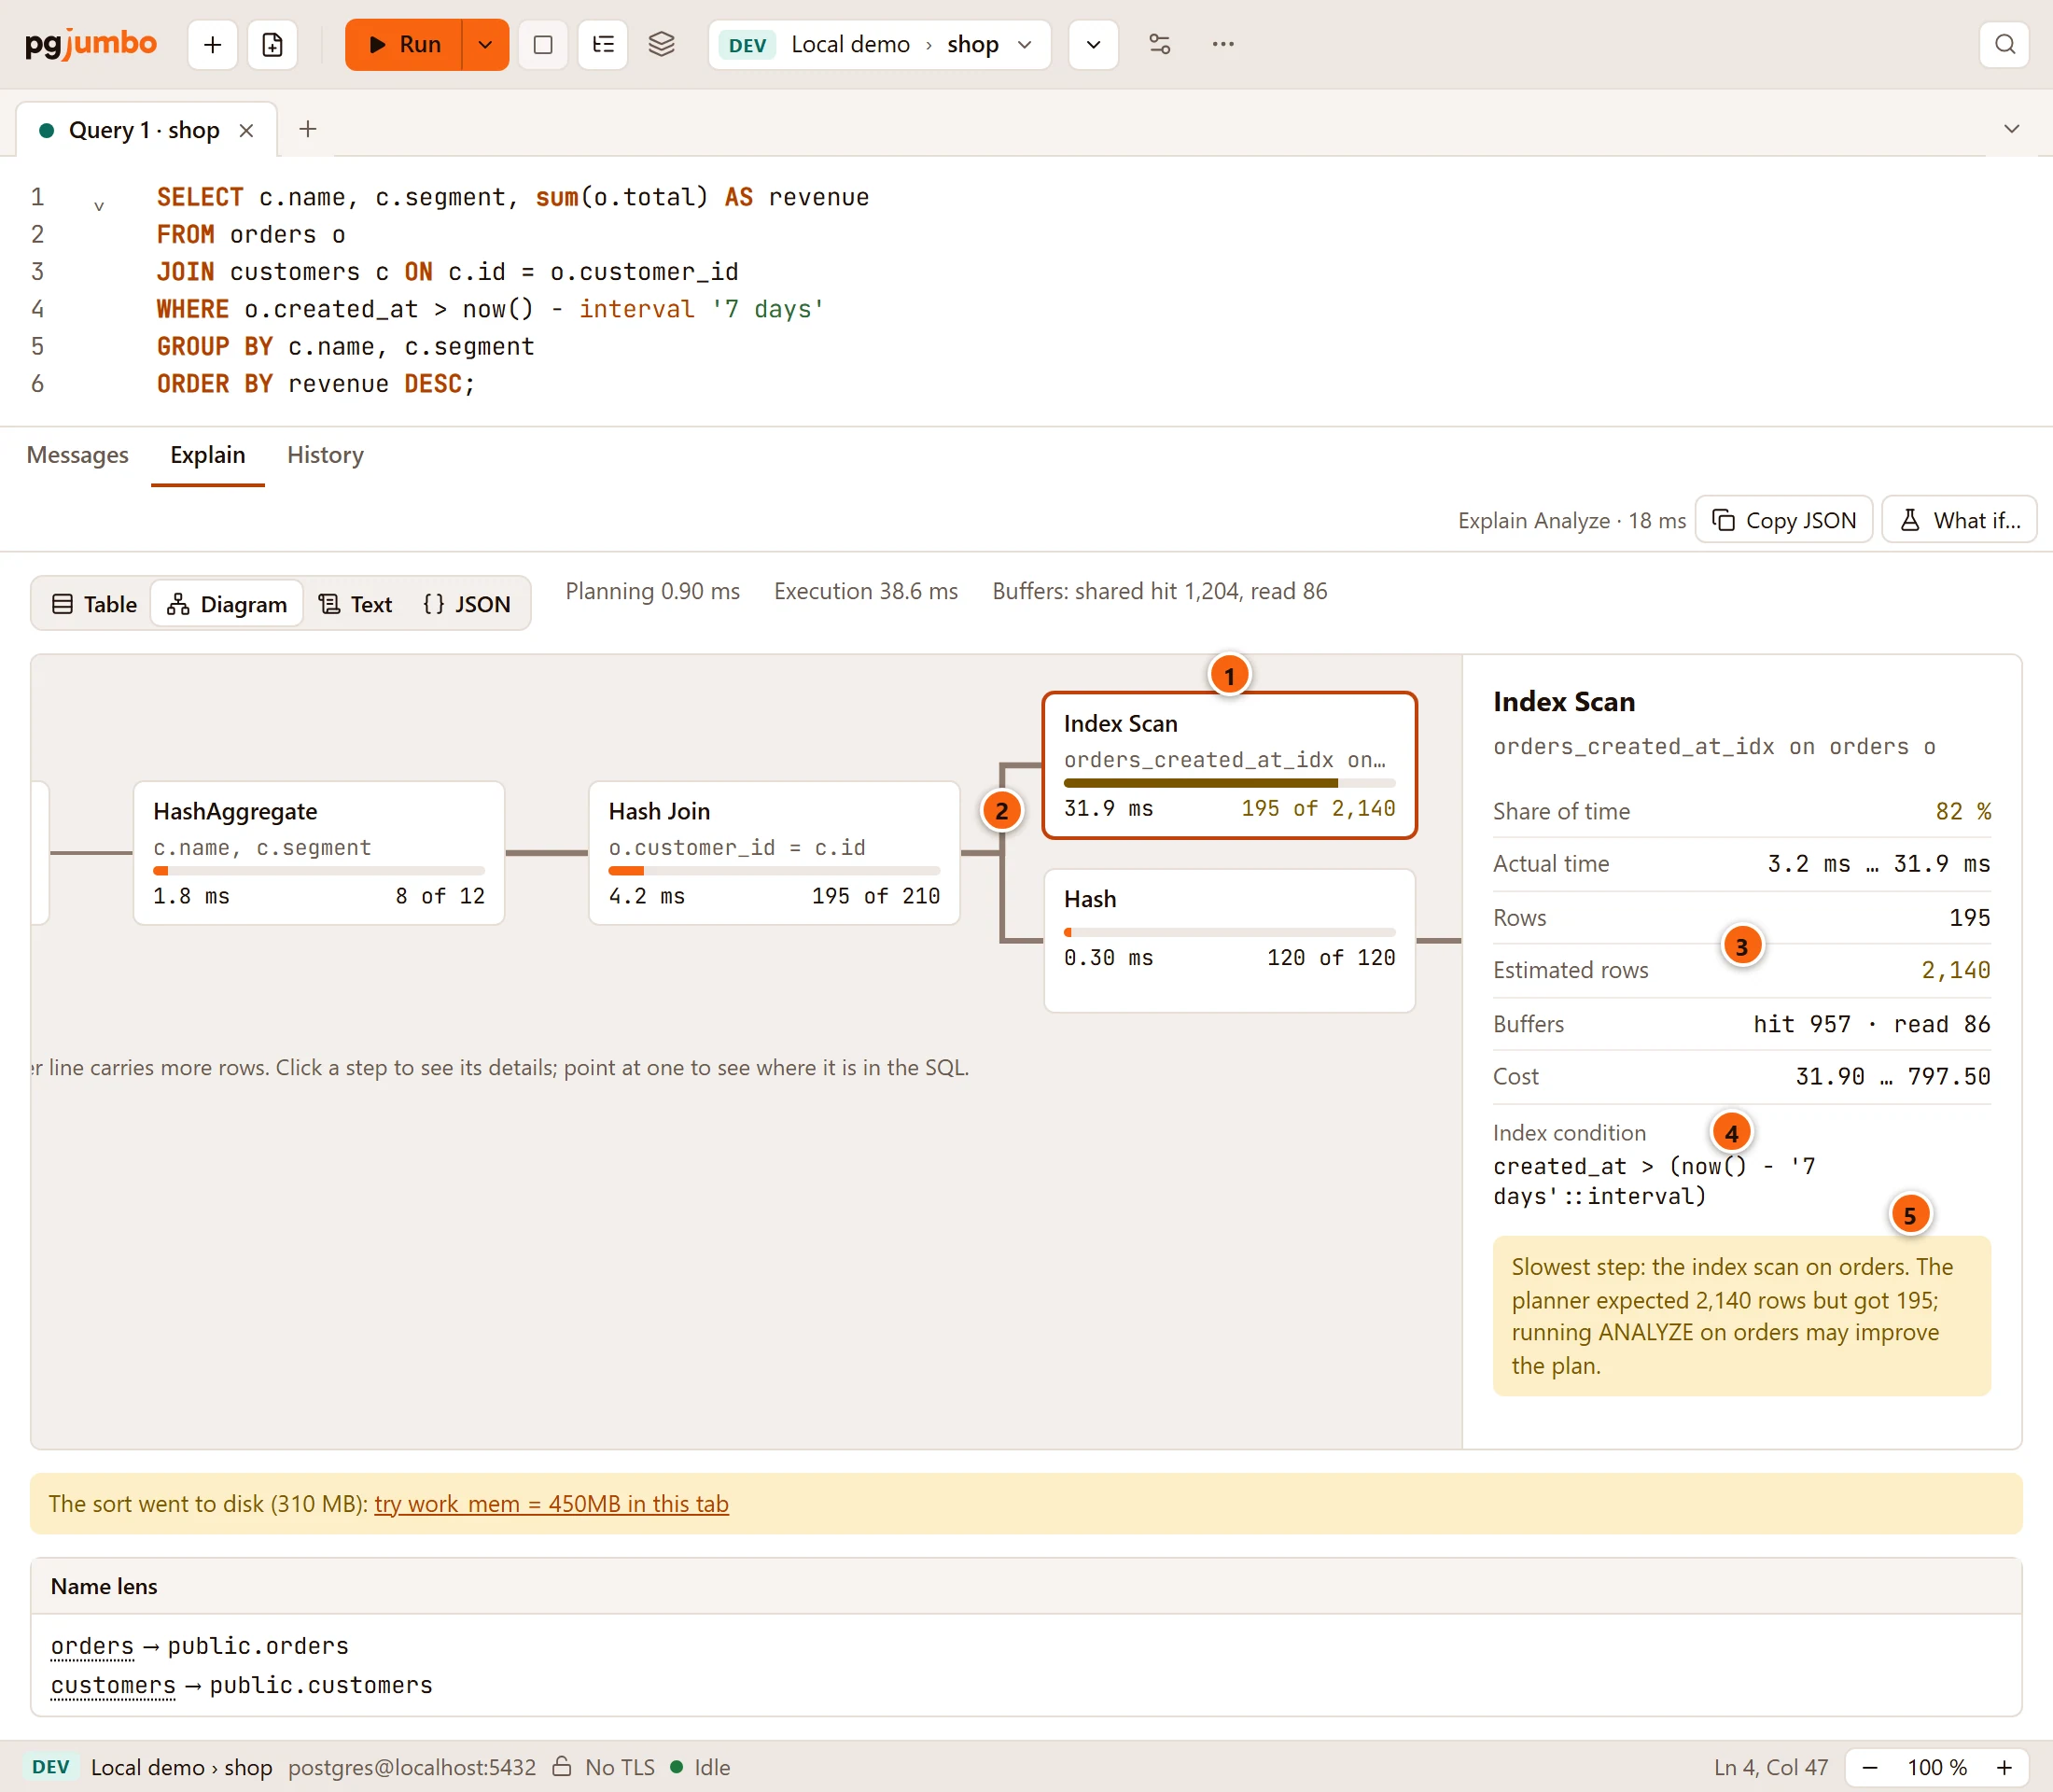
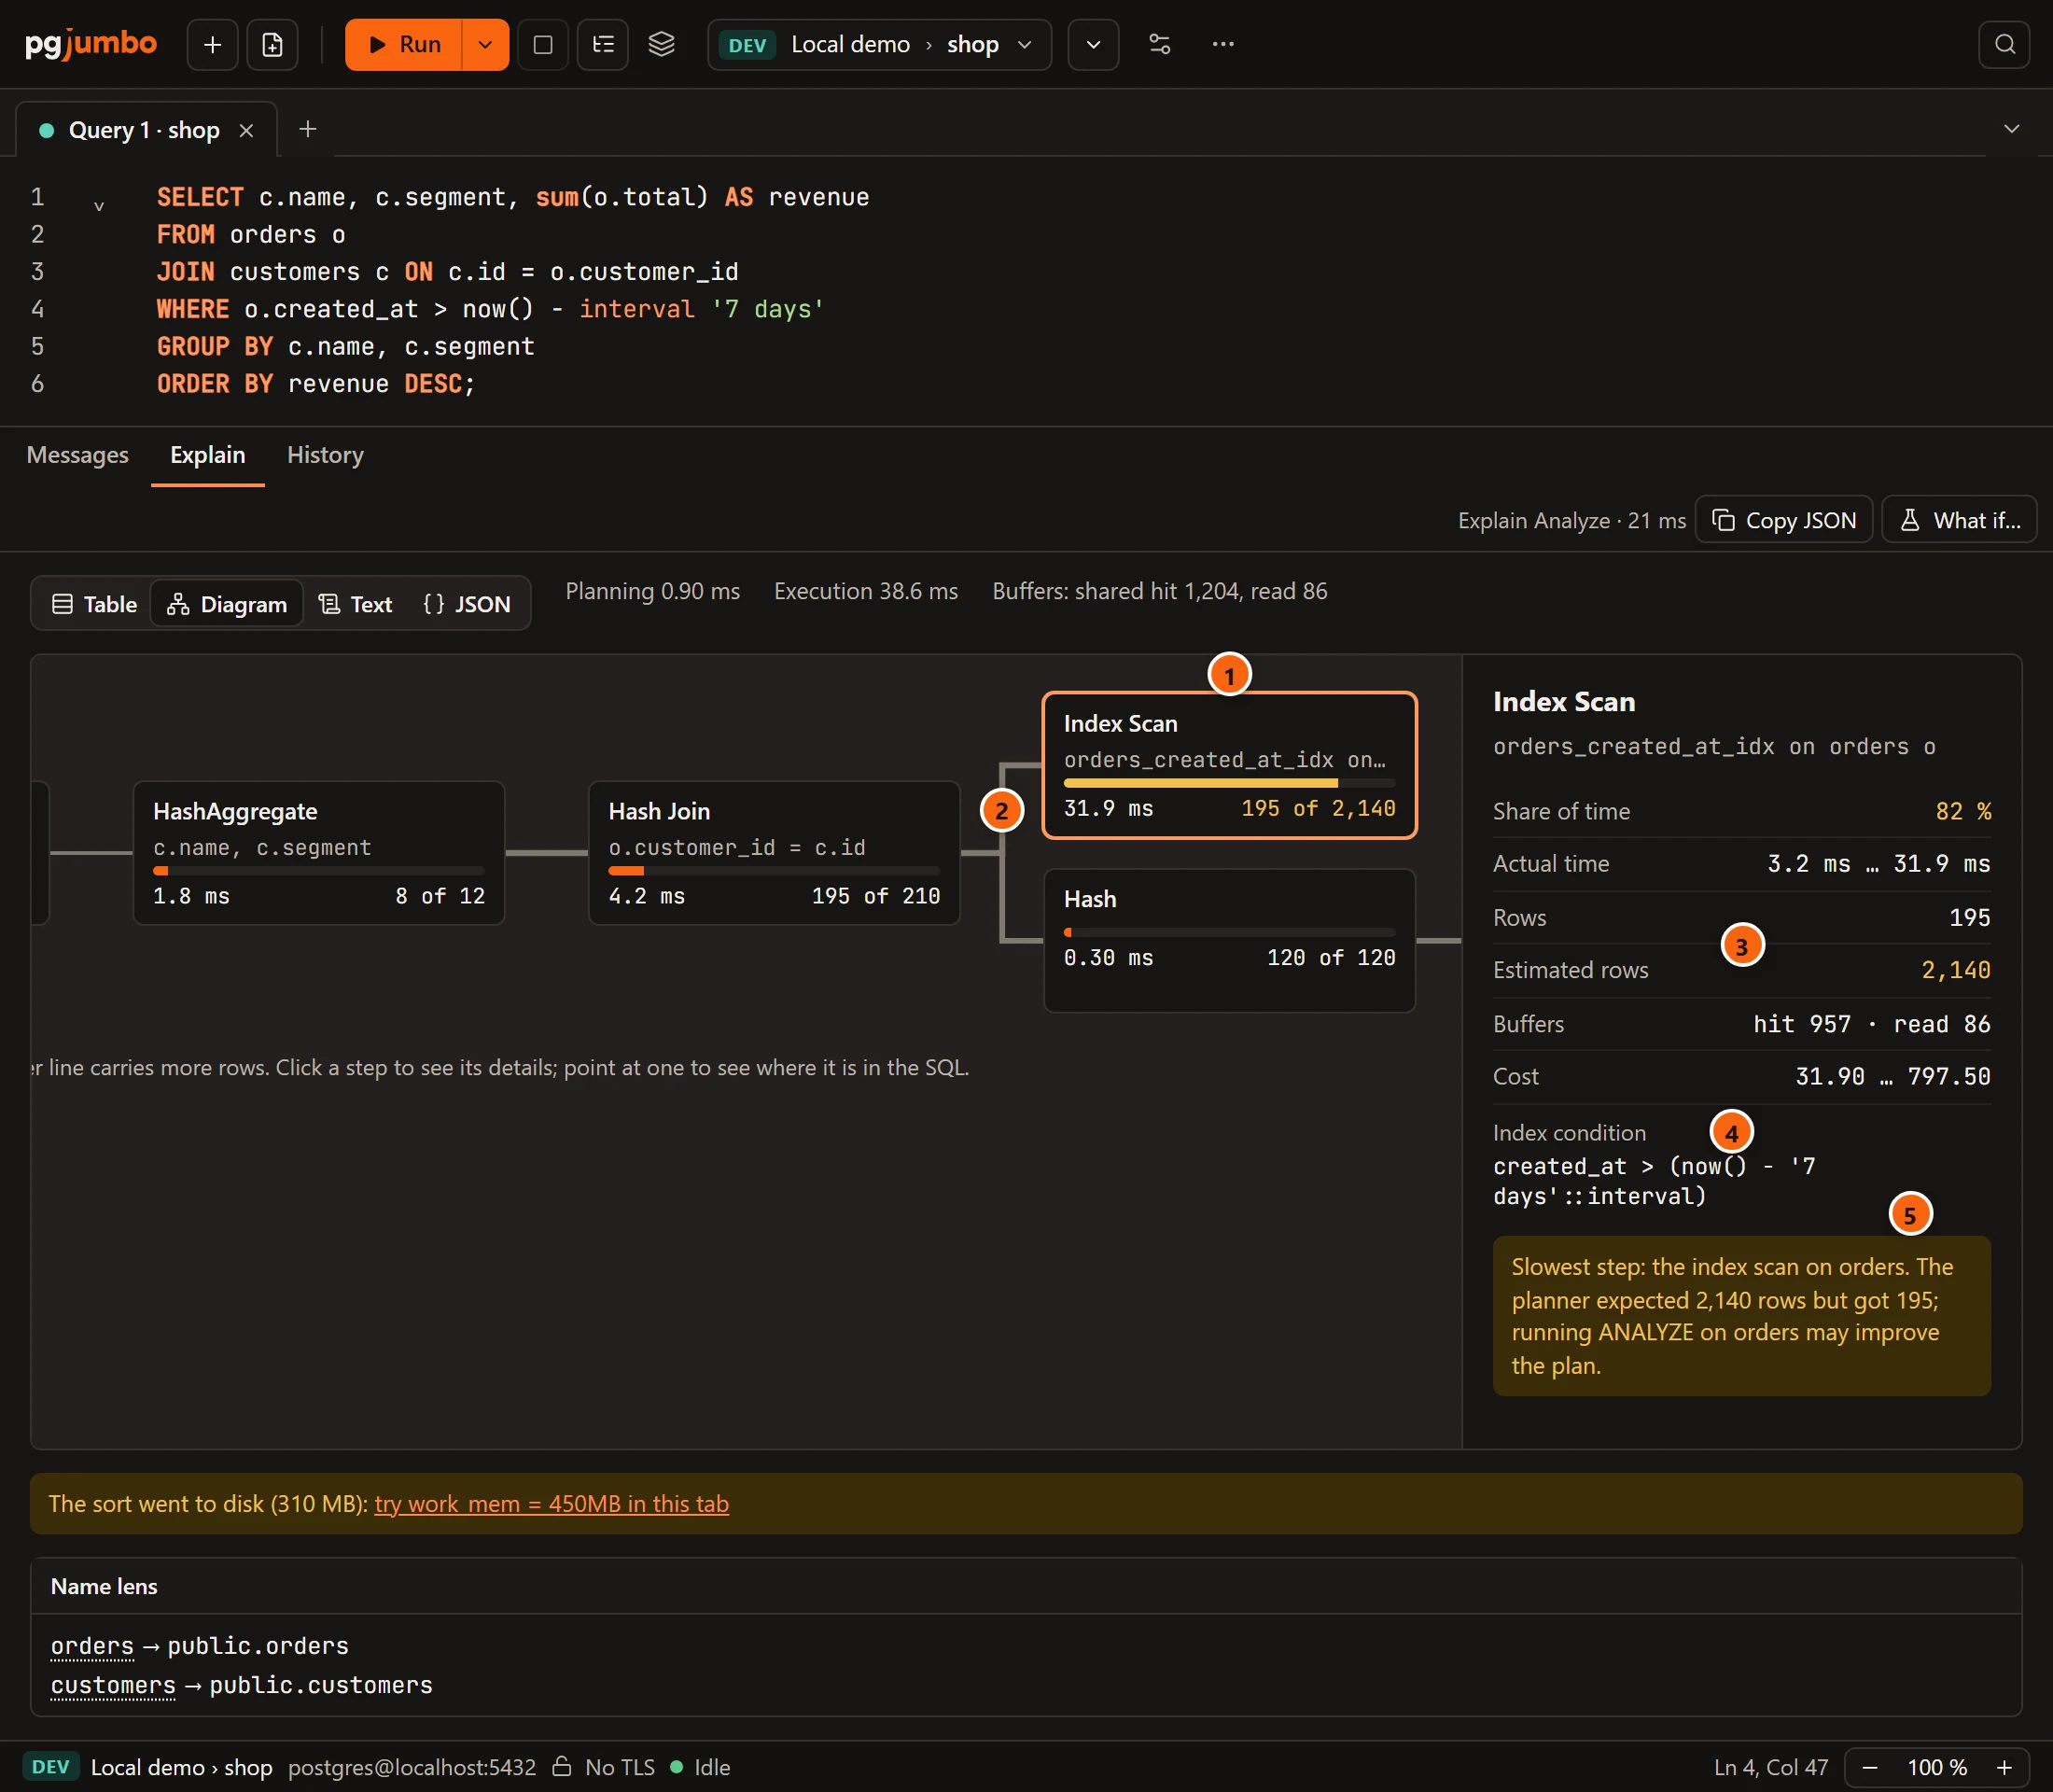
Section titled “Read the plan as a diagram”Click Diagram. pgjumbo draws each step as a card: the top of the plan on the left, the steps that feed it to the right. Rows flow from right to left, and a thicker line carries more rows.
-
1 A step’s card: its name and what it works on, a bar for its share of the time (or cost), its own time (or cost), and its rows against the estimate (
195 of 2,140; with Explain only the estimate). The slowest step has an outline and is chosen when the diagram opens. Click any card to choose it. -
2 The lines join each step to the step it feeds. The more rows a step returns, the thicker its line.
-
3 The chosen step’s name and what it works on, then its numbers:
Line What it says Share of time / Share of cost Its own time (or cost) as a share of the plan; in another colour for the slowest step. Actual time Explain Analyze only: the time to its first row and to its last, per loop. Rows Explain Analyze only: the rows it returned, over all loops. Estimated rows The rows the planner expected; in another colour when ten times off. Loops How many times it ran, when more than once. Buffers Explain Analyze only: shared buffers hitandread, the steps under it included.Cost The planner’s cost to its first row and to its last. -
4 Its conditions and keys, in full: Index condition, Recheck condition, Hash condition, Merge condition, Join filter, Filter, Sort key and Group key, as the step has them.
-
5 A hint: for the slowest step, the same as under the table; for another badly estimated step, “The planner expected 2,140 rows here and got 195; running ANALYZE on orders may give it better numbers.”
A plan wider or taller than the pane scrolls, as in the picture, where the first card (Sort) is off to the left; the details scroll on their own. The line under the cards repeats how to read them: “Rows flow from right to left; a thicker line carries more rows. Click a step to see its details; point at one to see where it is in the SQL.” The tips and the Name lens stay under the diagram, as under the table.
Read the plan as text or JSON
Section titled “Read the plan as text or JSON”- Text shows the plan laid out the way
psqlprintsEXPLAIN: each step with its cost (and with Analyze its time, rows and loops), its keys, conditions and the rows its filter removed under it, and the steps it reads from indented behind an arrow (->). pgjumbo writes this text from the JSON plan. Copy text copies it. - JSON shows the plan exactly as the server sent it (
FORMAT JSON). Copy JSON copies it, for example to paste into a plan visualiser.
Find a step in the SQL
Section titled “Find a step in the SQL”The plan and the SQL are linked both ways, in the Table view and in the Diagram.
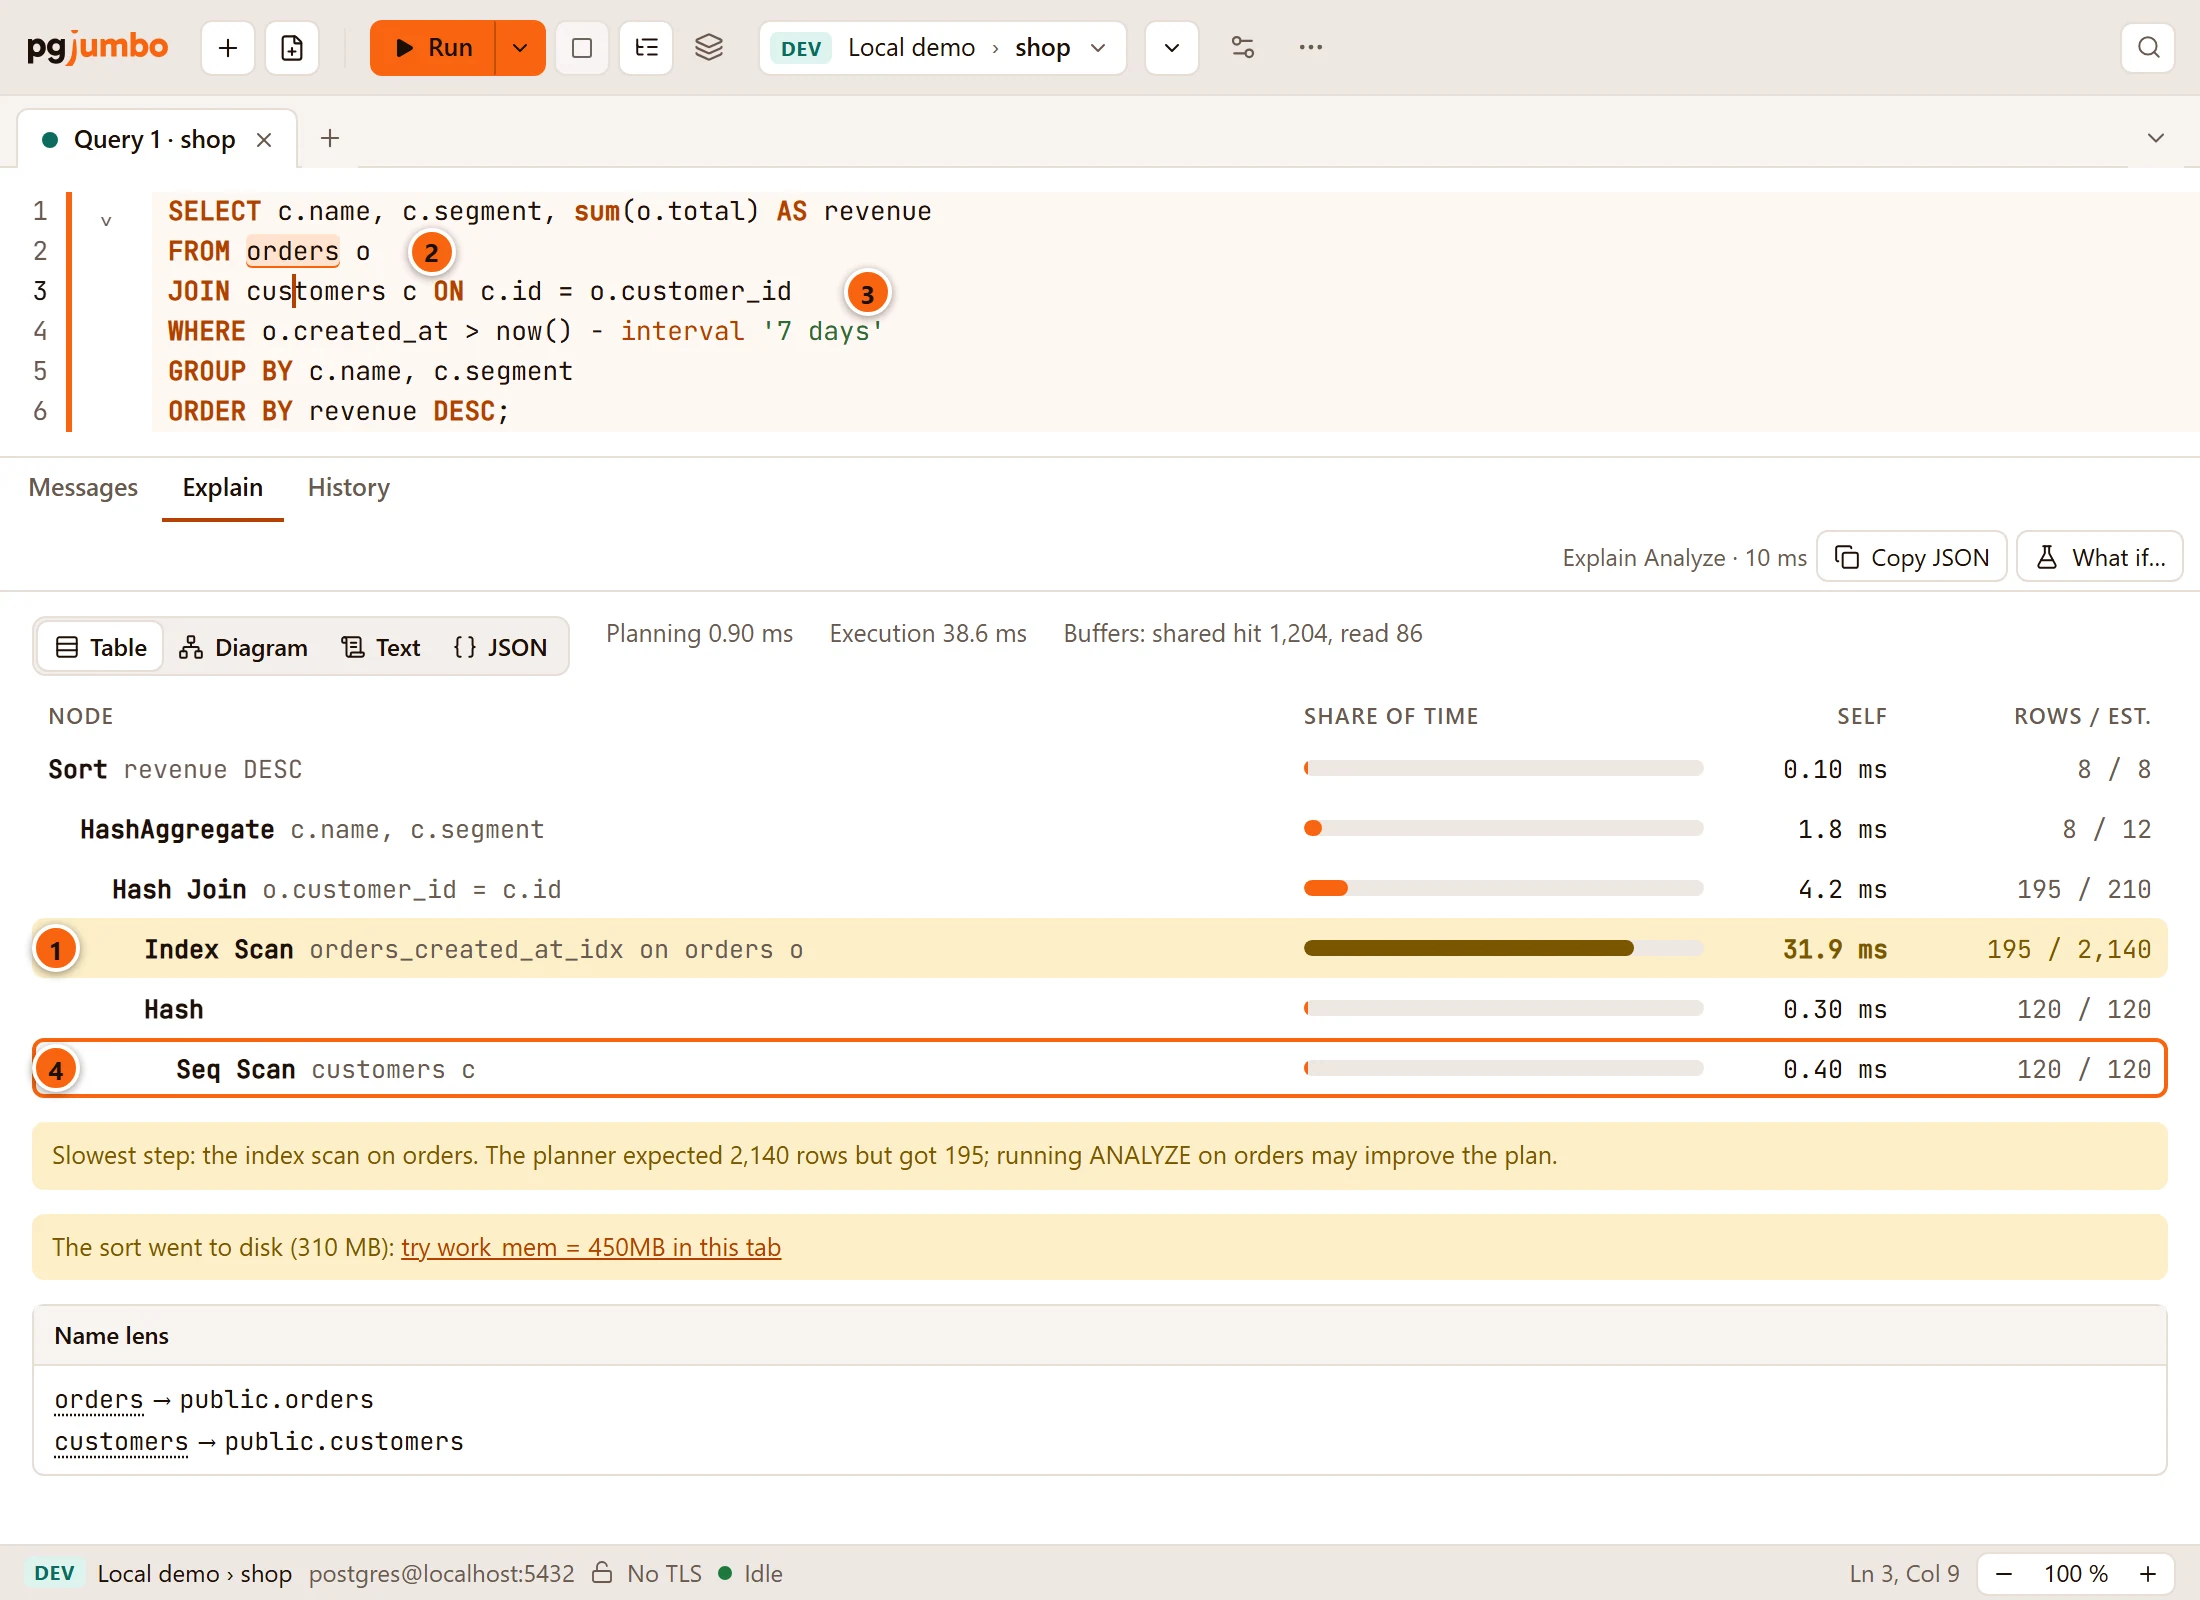
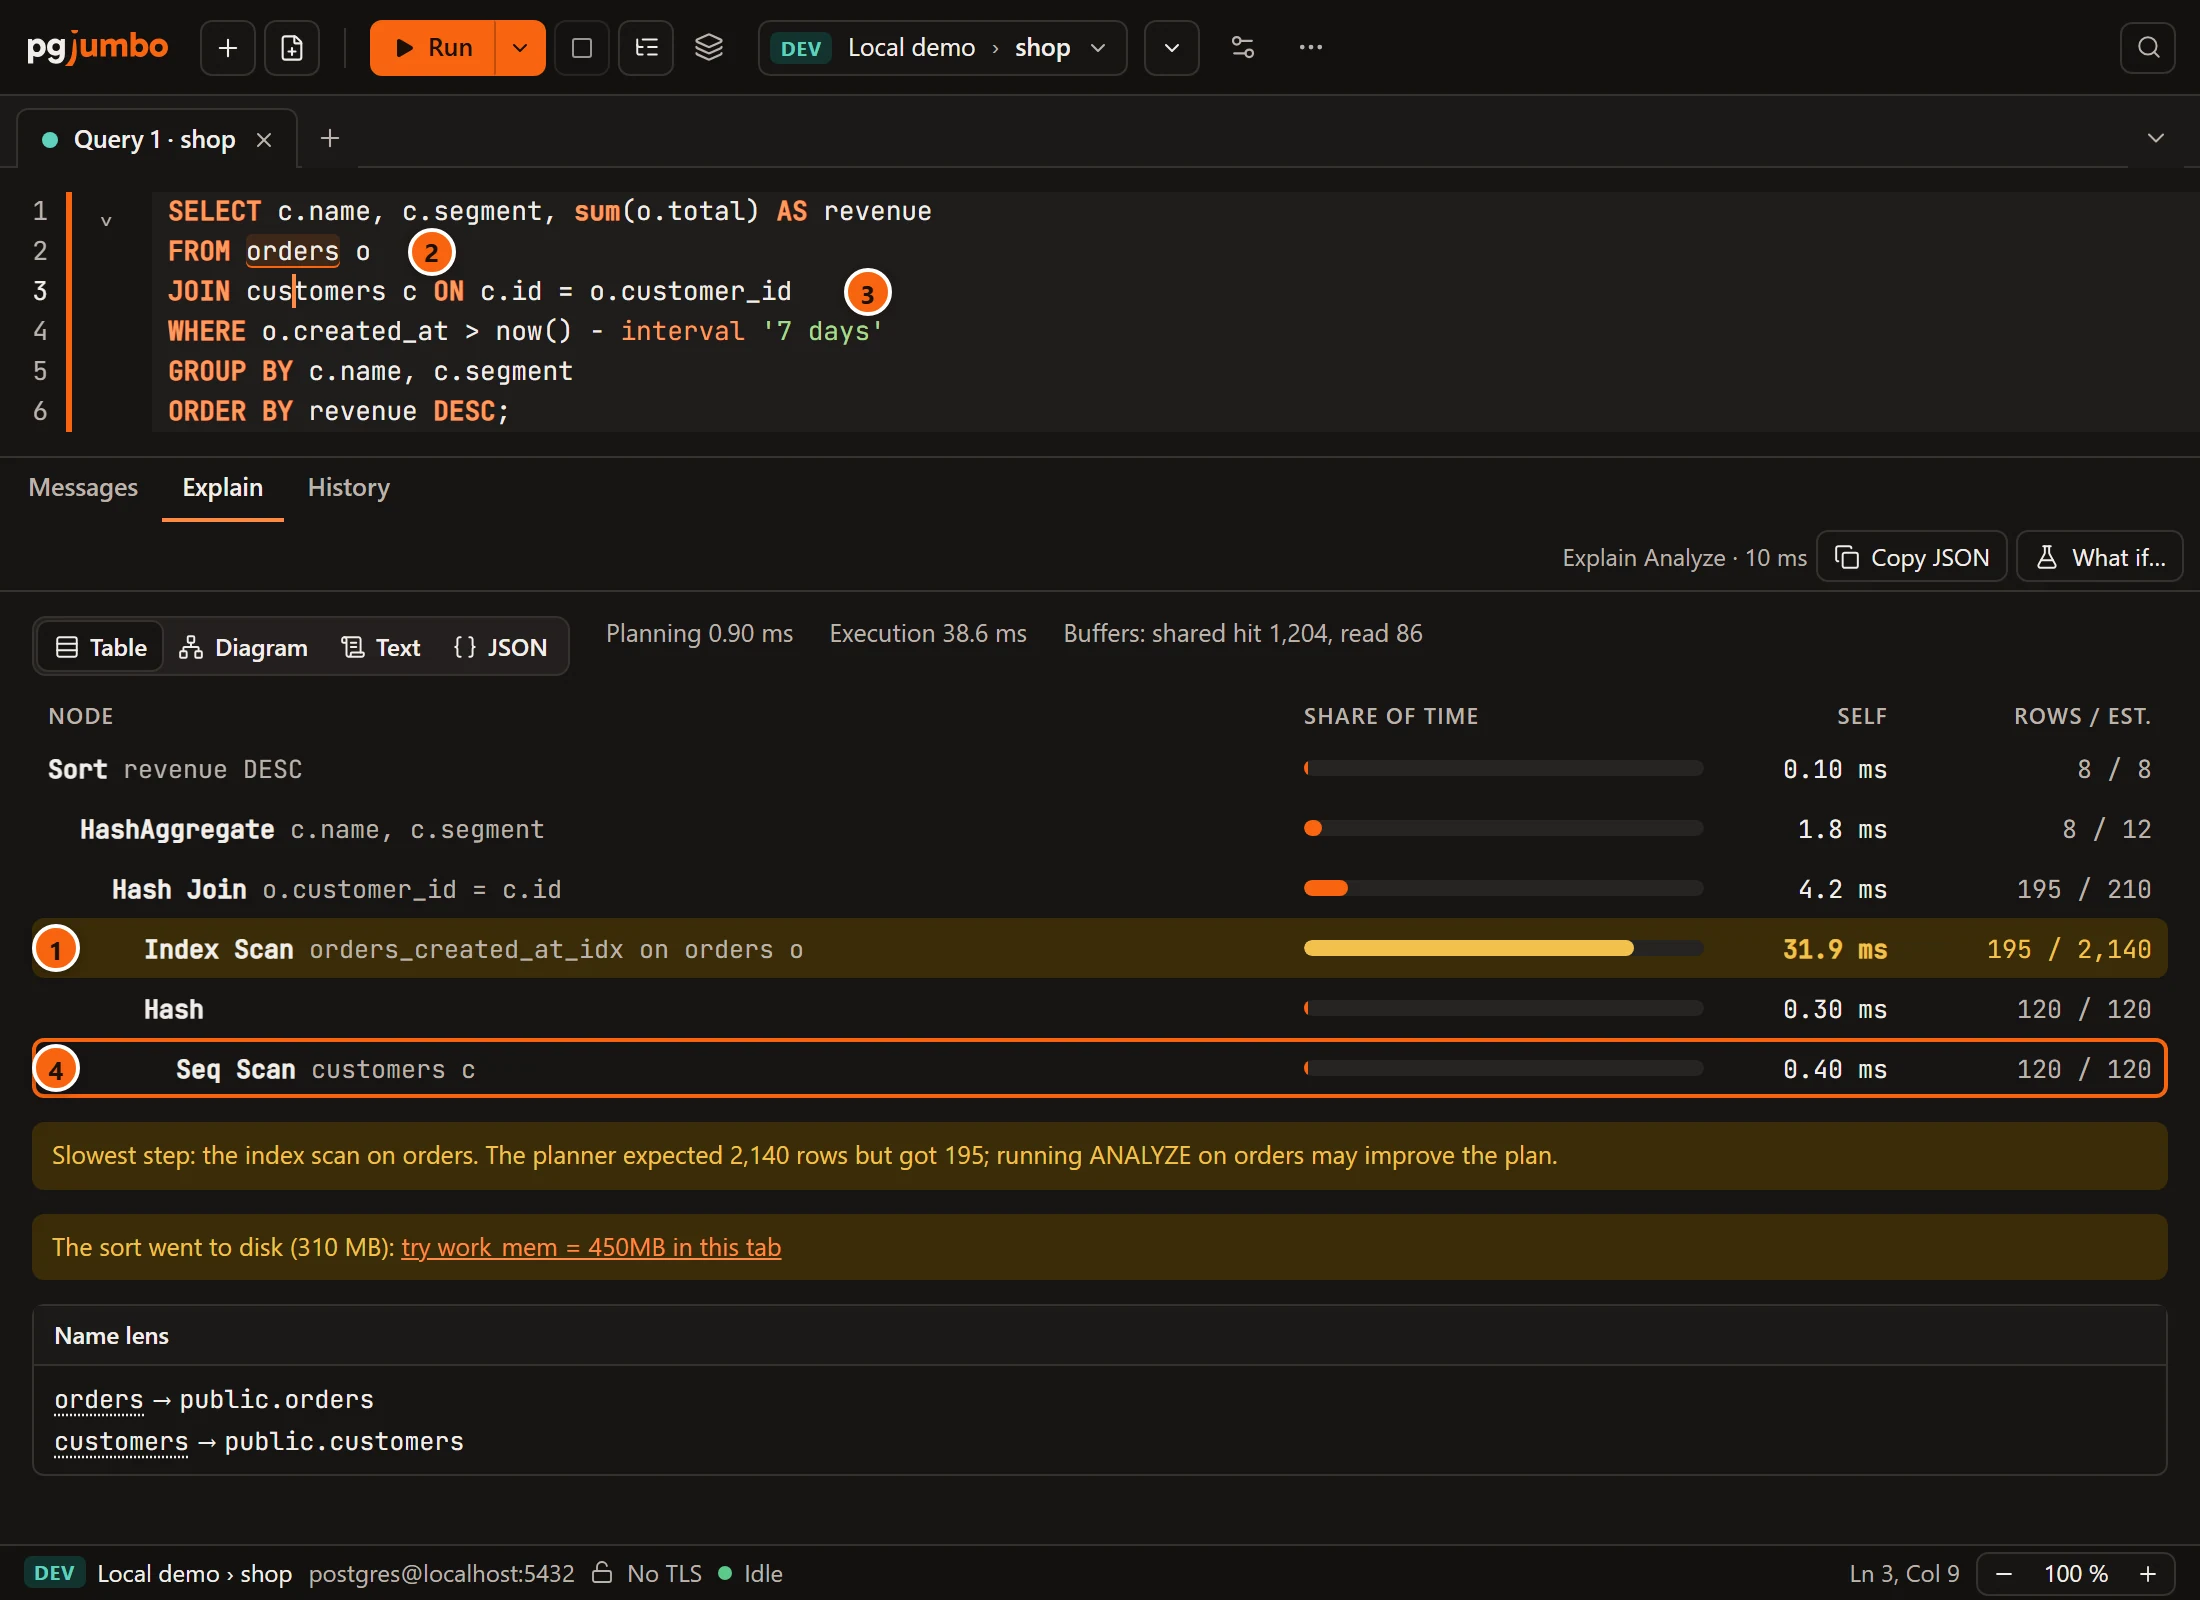
- 1 Point at a step of the plan.
- 2 The places in the SQL the step comes from light up. Move the pointer away and the light goes out.
- 3 Put the editor’s cursor somewhere in the statement.
- 4 The step that place belongs to gets a ring in the plan. When several steps come from the same place, the ring is on the one whose place is the smallest.
What lights up depends on the step:
| Step | What lights up in the SQL |
|---|---|
| A scan of a table or an index | The table in FROM, and the conditions on that table alone. |
| A join | Its condition, from ON or from WHERE. |
| A sort | ORDER BY. |
| An aggregate | GROUP BY. |
| A limit | LIMIT. |
A step with no place of its own in the statement, such as a Hash that only feeds a join, lights nothing. In the
diagram, a card lights its places when you point at it and when it has the keyboard focus.
Both directions work while the editor still holds the statement as it was explained. Change the statement and the link is gone until you explain it again. pgjumbo reads the places from PostgreSQL’s own parser, so nothing runs for them.
See what each name resolves to
Section titled “See what each name resolves to”Under the plan, the Name lens says what the server makes of the names in your statement: which table an unqualified name really is, which of your functions a call reaches, and where the server casts a column before it compares it. It is read from PostgreSQL’s parser and the catalog, on the tab’s session with its search path. Nothing runs, and the lens shows after Explain as after Explain Analyze.
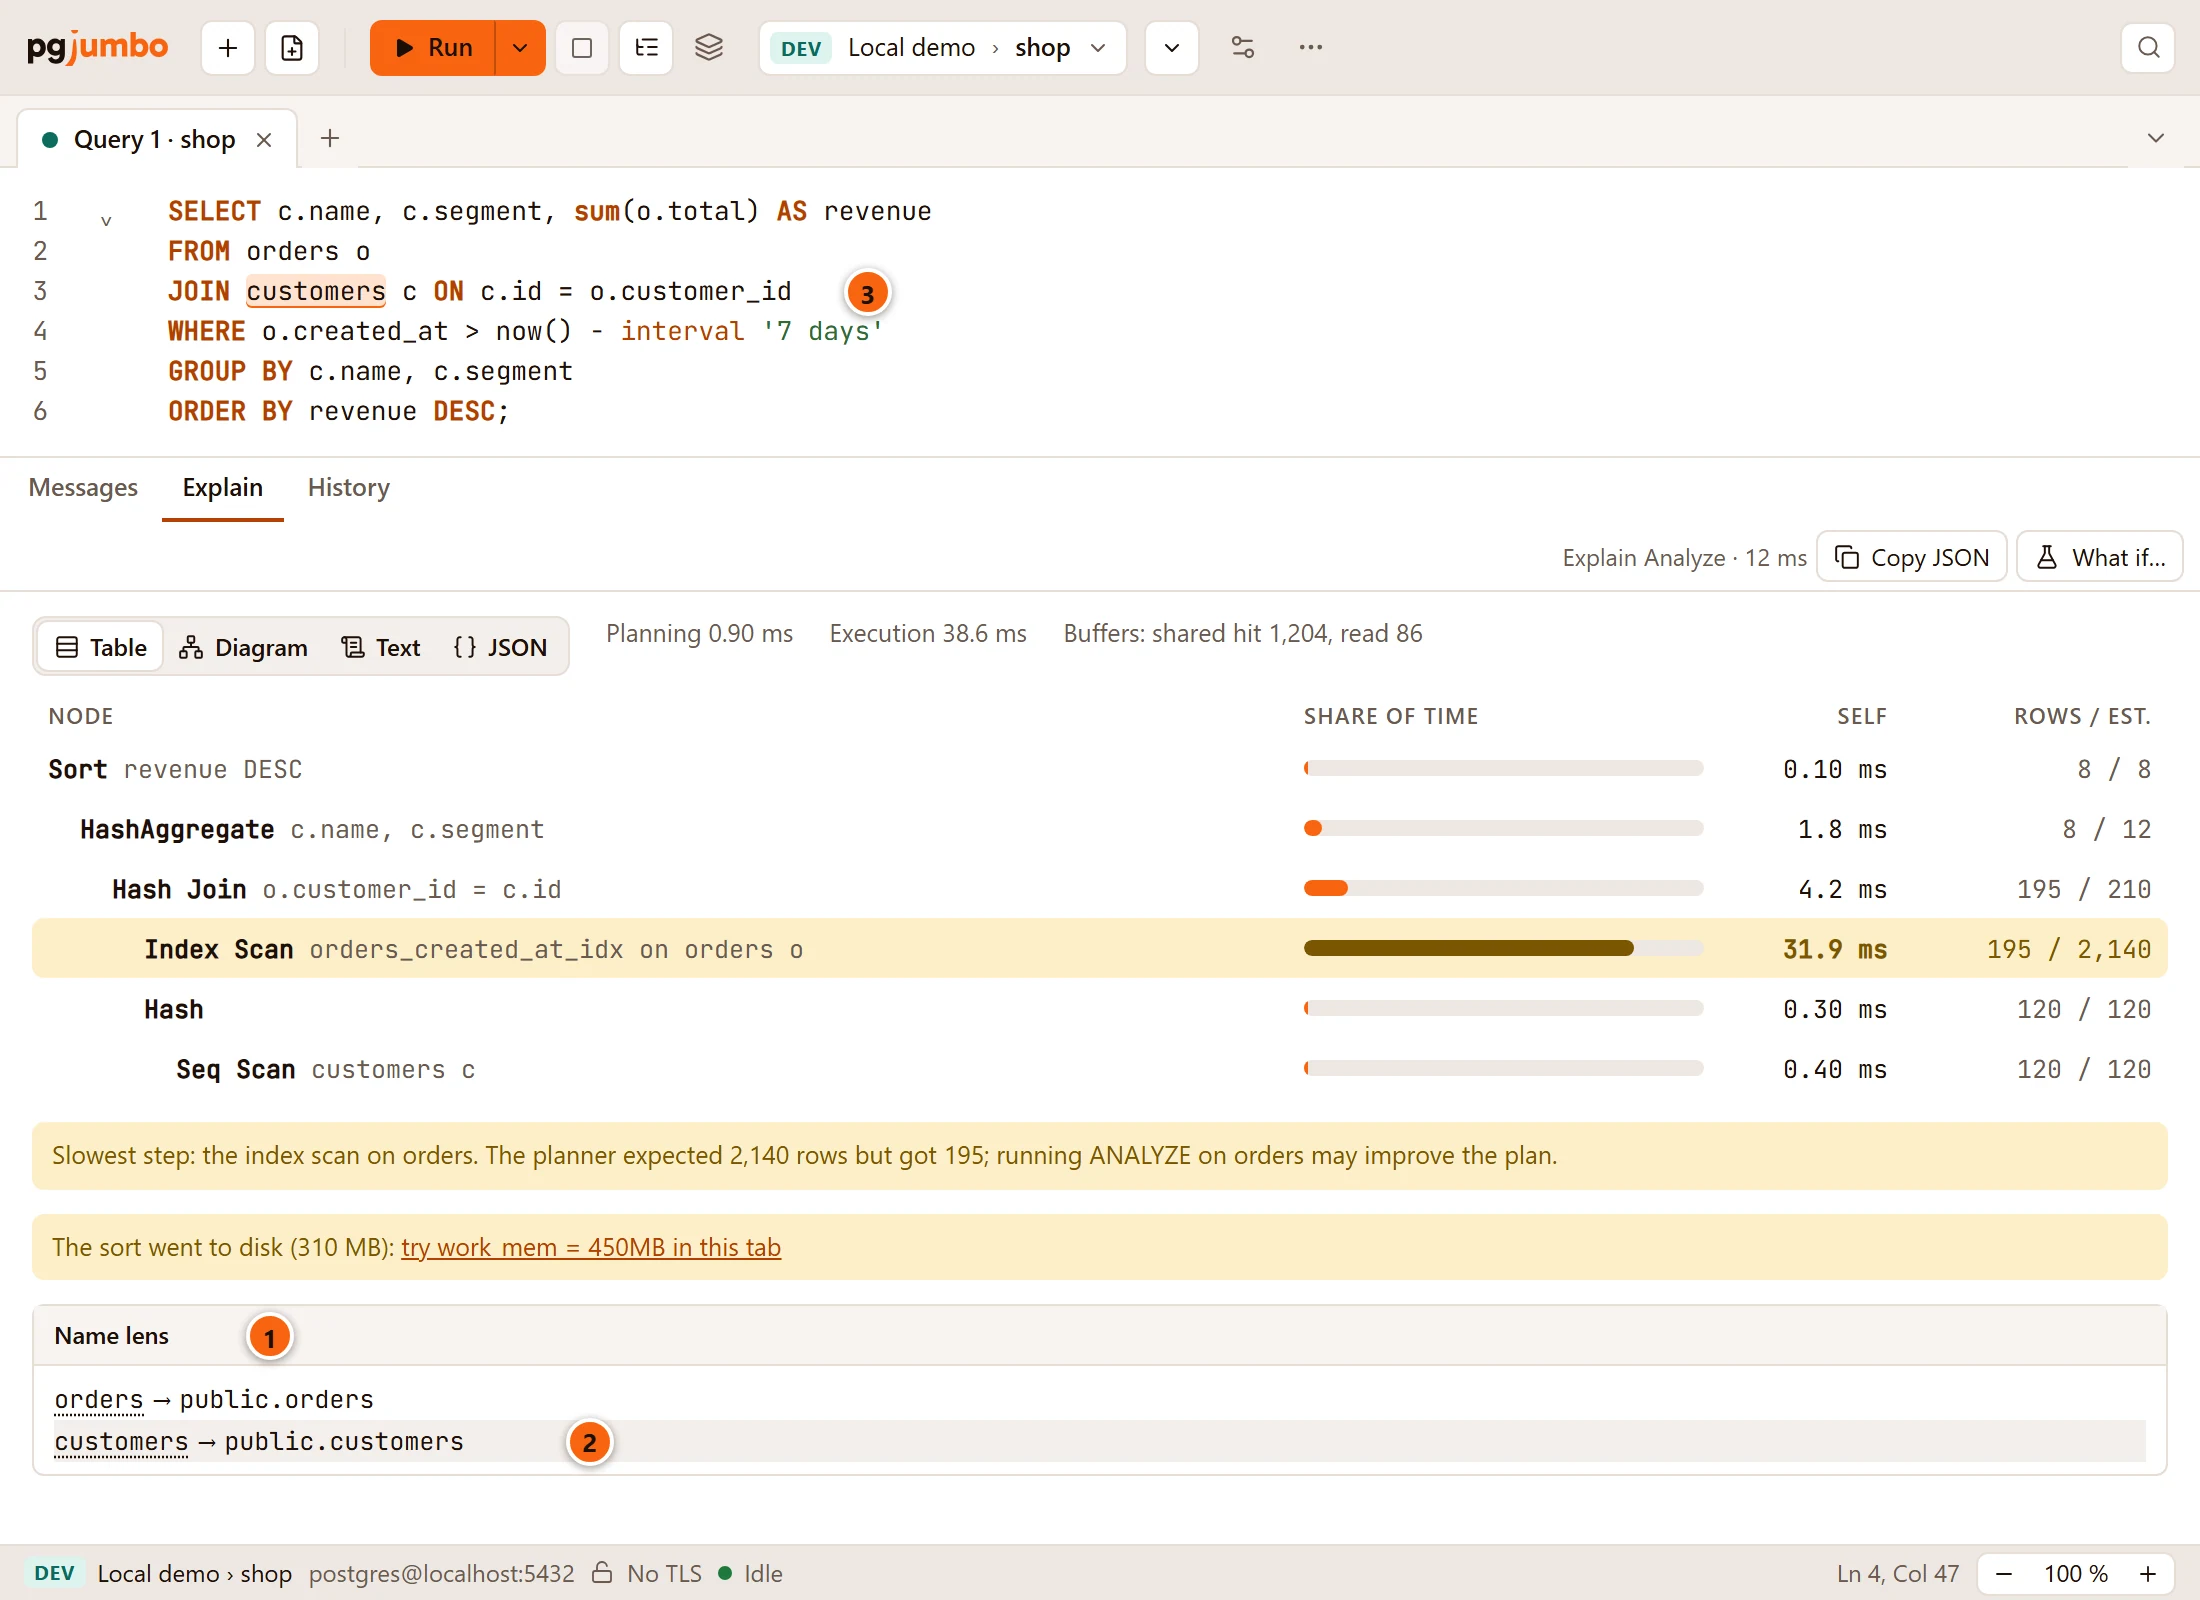
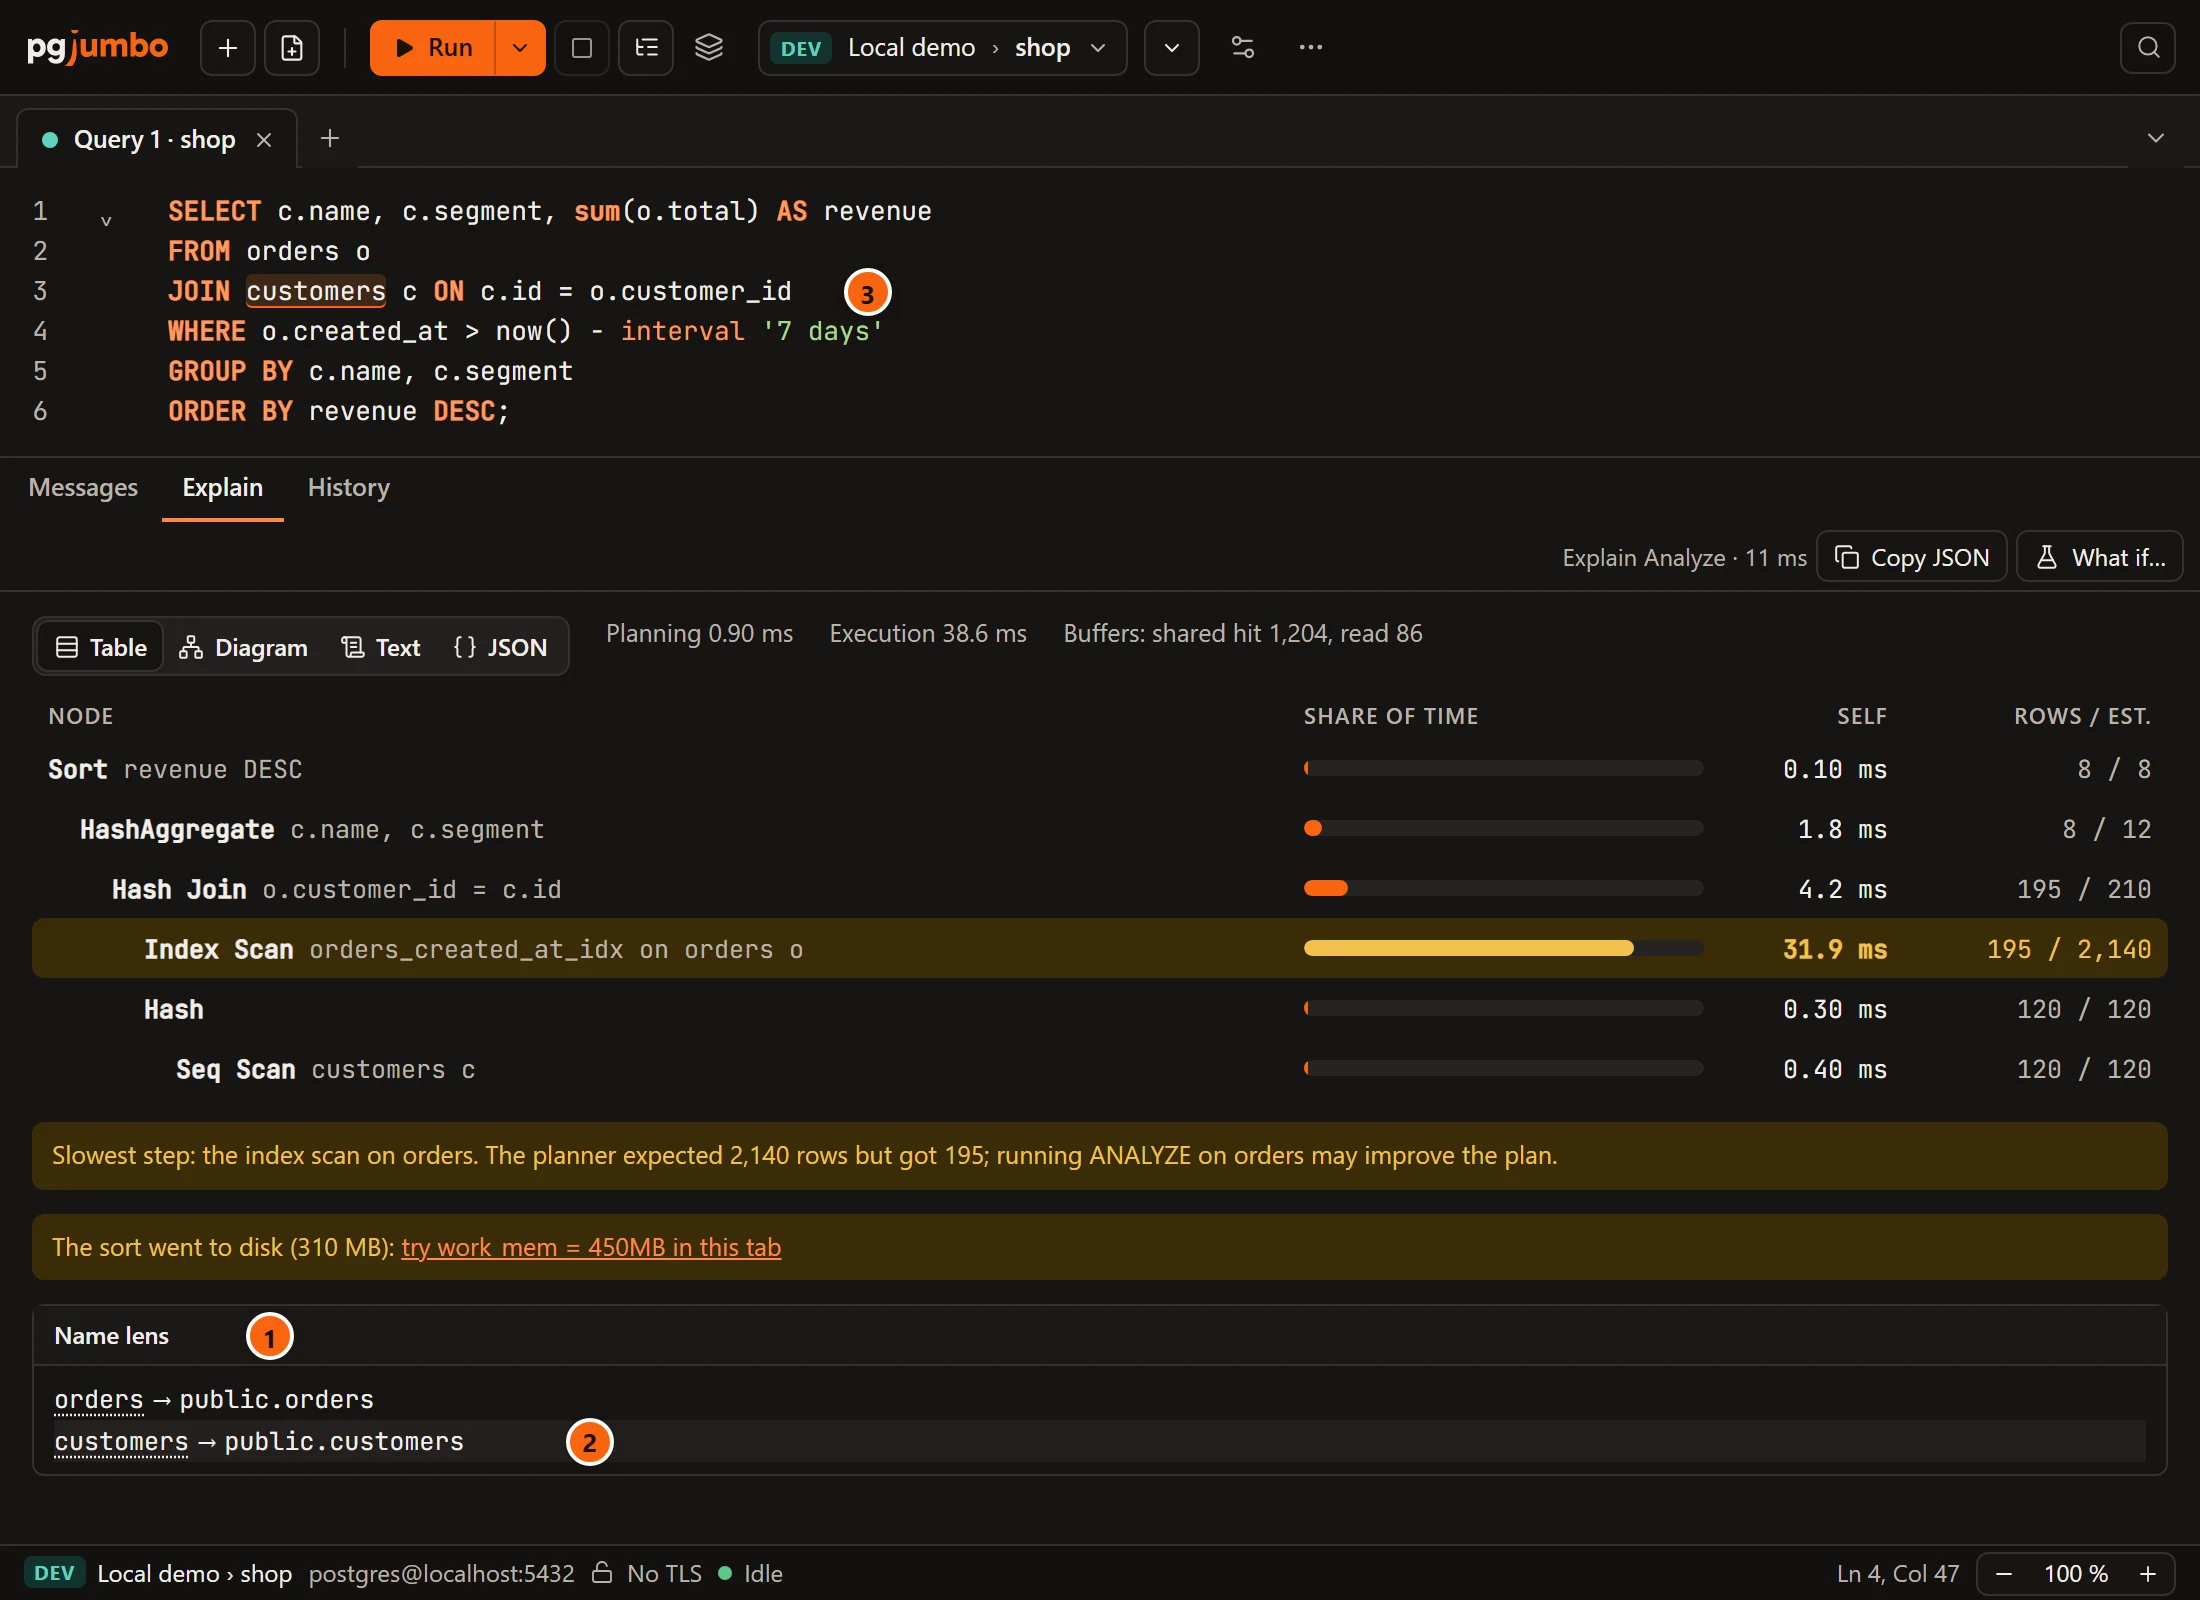
- 1 Name lens, under the hint and the tips. It is left out when it has nothing to say.
- 2 A line: the name as you wrote it, an arrow, and what the server uses for it. Point at a line.
- 3 Its place in the SQL lights up, as a plan step’s does.
The lens can hold four kinds of lines, in the order of their places in the statement:
| Kind | What the line says |
|---|---|
| A table name written without its schema | The table it resolves to on the tab’s search path, as orders → public.orders. In brackets after it: what it is when it is not a plain table (a view, a materialized view, a partitioned table, a foreign table, a sequence), “a temporary table of this session” (written pg_temp.orders), and the tables of the same name further along the search path, as “archive.orders is shadowed by the search path”. |
| A name that is not found | “not found”, with “no table, view or such of this name on the search path”. A name written with its schema is listed only in this case. |
| A call to one of your functions | The function the call reaches, with its argument types, as total_for(integer). When the name has several: “the one of 3 with 1 argument; 2 others of this name”. When several take that many arguments: “2 overloads take 1 argument”, with “the server picks by the arguments’ types” and, when they are in different schemas, which schema wins a tie by the search path. When none fits: “no such function”. PostgreSQL’s built-in functions are not listed. |
| A cast the server puts on a column to compare it | The condition as you wrote it, and a note such as “id (integer) is compared as numeric: the index on id can’t help”. Hover the line to read the condition as the server runs it. Casts that change nothing for an index are not listed. |
The casts come from a plain EXPLAIN (VERBOSE) of the statement, which plans it and does not run it.
See where a result column comes from
Section titled “See where a result column comes from”Column lineage answers the same kind of question from the other end: for a column of a result, which expression and which tables it comes from.
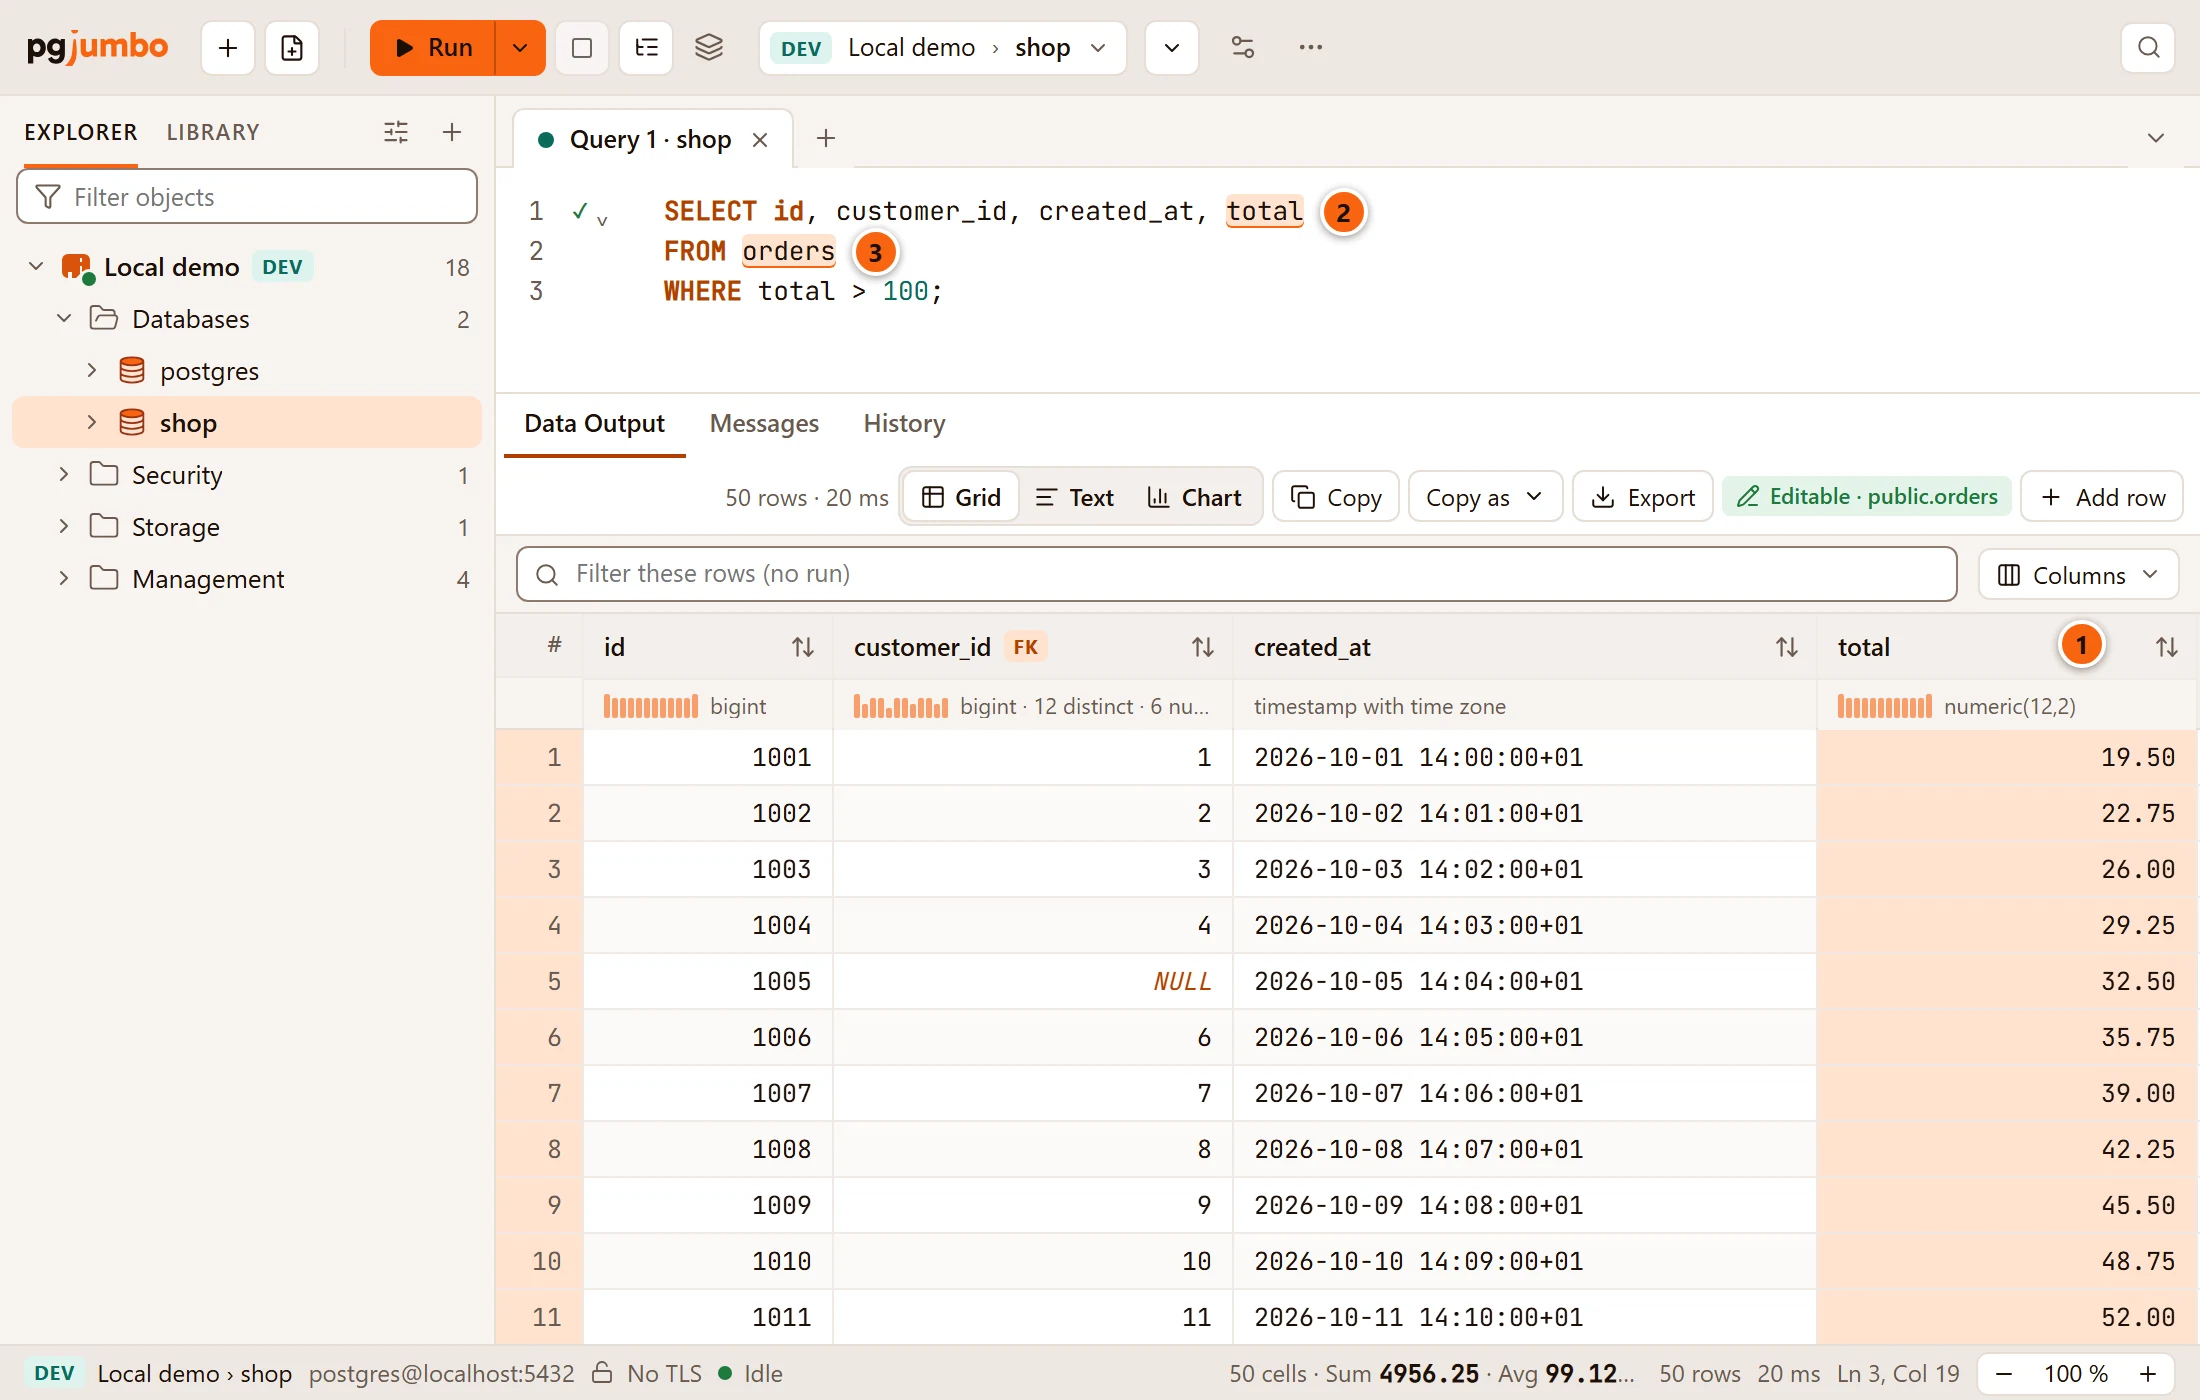
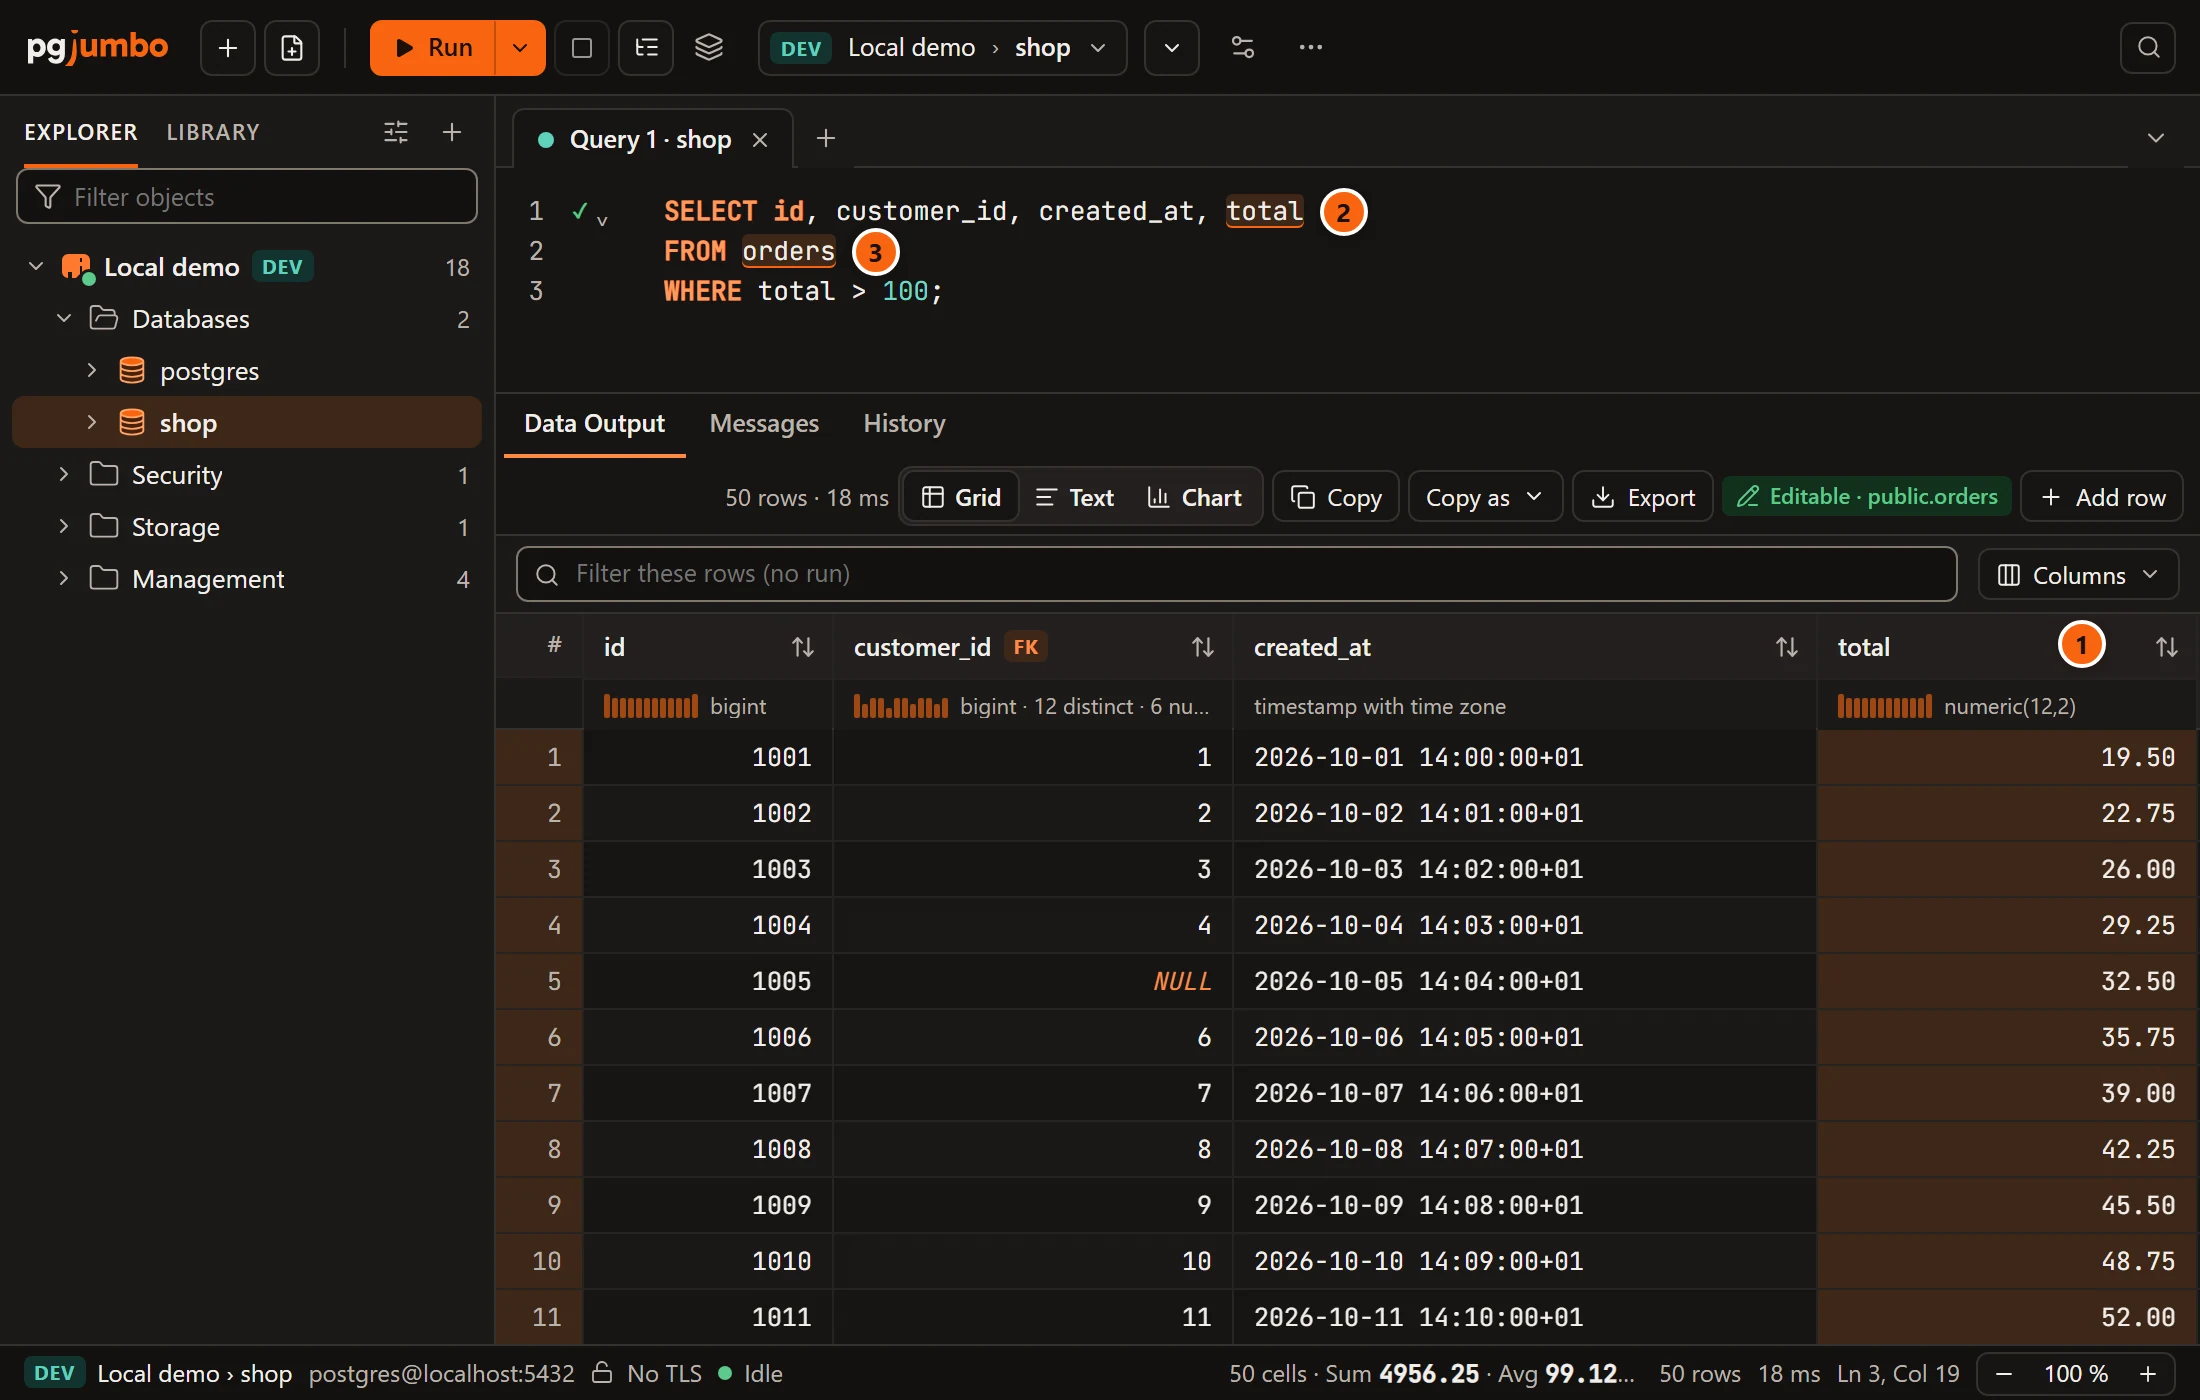
- 1 Run the statement, then click a column’s heading in Data Output. The click selects the whole column.
- 2 The column’s expression lights up in the editor, at each level it passes through: the outer select list, then the common table expression or the subquery it comes from.
- 3 The tables under it light up too.
Select something else in the grid and the light goes out. Lineage needs no plan: it is read from PostgreSQL’s parser and the catalog when you click, and nothing runs.
It works in a Query Tool’s results while the editor still holds the statement as it ran. A result of
Run on several databases has none. Where a column comes from something whose columns
pgjumbo cannot see here, such as a function in FROM, the trail ends there.
When there is no plan
Section titled “When there is no plan”

- 1 The result bar says No plan in red.
- 2 The tab says why. The messages you may see:
| Message | What to do |
|---|---|
| “Explain one statement at a time: put the cursor in it, or select it.” | The selection holds more than one statement. Select one, or click into it with nothing selected. |
| “There is no statement to explain.” | The selection holds only comments or blank lines. Select the statement itself. |
| “A psql meta-command cannot be explained.” | The statement is a backslash command such as \d. |
| “This tab’s transaction failed. Roll it back before explaining.” | A statement failed inside your transaction. Click Rollback. |
| “This tab is still running a query. Wait for it, or cancel it.” | The tab is busy. Wait, or click Stop. |
| “This tab’s connection is busy. Try again in a moment.” | Explain Analyze found the connection neither idle nor in a transaction. Try again. |
An error from the server, such as relation "orders2" does not exist |
The statement itself has an error. Fix it as you would before running it. |